HAL Id: tel-01579402
https://tel.archives-ouvertes.fr/tel-01579402
Submitted on 31 Aug 2017
HAL is a multi-disciplinary open access
archive for the deposit and dissemination of
sci-entific research documents, whether they are
pub-lished or not. The documents may come from
teaching and research institutions in France or
abroad, or from public or private research centers.
L’archive ouverte pluridisciplinaire HAL, est
destinée au dépôt et à la diffusion de documents
scientifiques de niveau recherche, publiés ou non,
émanant des établissements d’enseignement et de
recherche français ou étrangers, des laboratoires
publics ou privés.
diversity
Johann-Daniel Harnoss
To cite this version:
Johann-Daniel Harnoss. Essays on the economics of immigration and birthplace diversity. Economics
and Finance. Université Panthéon-Sorbonne - Paris I, 2014. English. �NNT : 2014PA010008�.
�tel-01579402�
UniversitÈ Paris 1 PanthÈon-Sorbonne
Centre d’Économie de la Sorbonne
Essays on the Economics of
Immigration and Birthplace Diversity
ThËse soumise en vue de l’obtention du
Doctorat en Science Economique
par
Johann-Daniel Harnoss
Thesis Advisor:
Hillel Rapoport (Université Paris 1 Panthéon-Sorbonne)
Thesis Committee:
Alberto Alesina (Harvard University)
Jean-Claude BerthÈlemy (Université Paris 1 Panthéon-Sorbonne)
Hippolyte d’Albis (Université Paris 1 Panthéon-Sorbonne)
Hillel Rapoport (Université Paris 1 Panthéon-Sorbonne)
Yves Zenou (Stockholm University)
Ekaterina Zhuravskaya (EHESS)
Date de soutenance:
January 21, 2014
Contents
Résumé vii Abstract ix Acknowledgements xi 1 Birthplace Diversity 1 1.1 Introduction . . . 11.2 Diversity and economic prosperity . . . 2
1.3 Diversity and attitudes to immigration . . . 4
1.4 Diversity and attitudes to redistribution . . . 5
1.5 References . . . 7
2 Diversity and Economic Prosperity 11 2.1 Introduction . . . 11
2.2 Related literature . . . 14
2.3 An index of birthplace diversity . . . 16
2.4 Empirical analysis . . . 19
2.4.1 Birthplace diversity data . . . 19
2.4.2 Descriptive statistics and correlations . . . 19
2.4.3 Model specification . . . 21 2.4.4 OLS results . . . 23 2.4.5 Robustness . . . 24 2.5 Identification . . . 27 2.5.1 Omitted variables . . . 27 2.5.2 Unobserved heterogeneity . . . 28 2.5.3 Reverse causality . . . 31
2.6 Does cultural distance matter? . . . 35 iii
2.6.1 An augmented index . . . 35
2.6.2 Results . . . 36
2.7 Conclusion . . . 37
2.8 References . . . 38
2.9 Tables and figures . . . 44
2.10 Appendix . . . 55
3 Diversity and Attitudes to Immigration 75 3.1 Introduction . . . 75
3.2 Preferences on migration policy . . . 78
3.2.1 Individual level determinants . . . 78
3.2.2 Country level determinants . . . 81
3.3 Empirical strategy and data . . . 82
3.3.1 Empirical model . . . 82
3.3.2 Data . . . 84
3.3.3 Descriptive statistics . . . 86
3.4 Results . . . 87
3.4.1 Labor market results . . . 87
3.4.2 Welfare e§ects . . . 90
3.4.3 Preference e§ects . . . 90
3.4.4 Robustness . . . 91
3.5 Addressing endogeneity . . . 93
3.5.1 Instrumenting size and variety of immigration . . . 93
3.5.2 Using European Social Survey (ESS) data . . . 95
3.6 Conclusion . . . 96
3.7 References . . . 97
3.8 Tables and figures . . . 100
4 Diversity and Attitudes to Redistribution 117 4.1 Introduction . . . 118
4.2 The demand for redistribution . . . 121
4.2.1 Economic and cultural determinants . . . 121
4.2.2 Race, ethnicity, birthplace and redistribution . . . 122
4.3 Empirical strategy and data . . . 124
4.3.1 Data . . . 124
4.3.2 Descriptive analysis . . . 125
CONTENTS v
4.4 Results . . . 127
4.4.1 Group loyalty e§ects . . . 128
4.4.2 Labor market e§ects . . . 129
4.4.3 Extensions and robustness . . . 131
4.4.4 Addressing reverse causality . . . 134
4.5 Conclusion . . . 136
4.6 References . . . 137
4.7 Tables and figures . . . 140
5 Conclusion 157
Résumé
Cette thèse s’intéresse à la mesure et à l’analyse des e ets de la diversité liée aux lieux (pays) de naissance d’une population. A partir de données d’immigration pour l’ensemble des pays du monde, nous proposons un indice de «diversité des pays de naissance» de la main d’œuvre pour 195 pays en 1990 et 2000. Cet in-dice est disponible pour la frange «qualifiée» (titulaire d’un diplôme supérieur au BAC) et non-qualifiée de la main d’œuvre et est décomposé entre une marge extensive, la part de la population immigrée (née à l’étranger) dans la popula-tion âgée de 25 ans et plus, et une marge intensive, qui dépend de la diversité des lieux de naissance de la population immigrée. Nous montrons que la «di-versité des lieux de naissance» est une dimension nouvelle de la di«di-versité d’une population, qu’elle est conceptuellement et statistiquement distincte de la di-versité ethno- linguistique ou génétique et que, contrairement à celles-ci, elle est corrélée positivement avec les niveaux de revenu et de productivité à long terme. Le chapitre 1 donne une interprétation générale.
Dans le chapitre 2 nous étudions empiriquement la relation entre diversité des lieux de naissance et niveaux de développement. Dans un modèle empirique très riche et pour un échantillon de 120 pays (et tout en contrôlant pour un grand nombre de variables — l’éducation, le commerce, la géographie, le développement institutionnel, etc.), nous montrons que la diversité de l’immigration a ecte positivement le PIB à long terme et la productivité par habitant. Cet e et est plus important pour les immigrants qualifiés dans les pays riches. Une attention particulière est portée au traitement des problèmes d’endogéneité. Les résultats apparaissent robustes à l’utilisation de nombreuses spécifications alternatives ainsi qu’au recours à des techniques de variables instrumentales. Nous montrons également que l’e et productif de la diversité est plus grand pour les immigrants qui sont proches culturellement des natifs du pays d’accueil - mais pas trop proches - et qui sont originaires de pays plus riches. Au total, ces résultats
suggèrent la présence de complémentarités dans la fonction de production entre les autochtones et les immigrants.
Dans le chapitre 3, nous étudions le lien entre la diversité des lieux de nais-sance et les attitudes vis-à-vis de l’immigration. Nous utilisons le World Values Survey pour 72 pays et montrons que les natifs qualifiés augmentent leur sou-tien à l’immigration lorsque la diversité des immigrants qualifiés est élevée. Les résultats sont robustes à l’utilisation du European Social Survey comme base de données alternative, ainsi qu’au recours à des techniques d’instrumentation permettant de prédire le niveau de diversité de l’immigration dans le cadre d’un modèle de gravité. Ces résultats sont en contradiction avec l’hypothèse du marché du travail telle que nous la connaissons traditionnellement et suggèrent que les attitudes vis-à-vis de l’immigration relèvent d’un modèle plus élaboré. Notamment, nos résultats sont cohérents avec un modèle où les travailleurs nat-ifs les plus qualifiés internalisent les bénéfices en termes de complémentarité liés à une immigration plus qualifiée et plus diverse.
Enfin, nous analysons dans le chapitre 4 le lien entre la diversité des lieux de naissance et les attitudes vis-à-vis de la redistribution en Europe. En util-isant des données de 29 pays européens, nous constatons que les travailleurs autochtones ont tendance à réduire leur soutien aux politiques de redistribu-tion lorsque l’immigraredistribu-tion (au niveau du pays ou de la profession) est élevée. En outre, cet e et varie le long de la répartition des compétences des natifs et converge vers zéro pour les personnes très éduquées ; il est de plus robuste à l’utilisation de mesures plus précises des niveaux de compétences sur le marché du travail. Au total, ces résultats suggèrent la présence d’e ets bien connus dits « de loyauté » (le fait de préférer redistribuer au sein du groupe) mais également d’e ets liés au marché du travail (e ets de complémentarité et e et d’assurance, aux deux extrêmes de la distribution des qualifications) qui n’avaient pas été mis en évidence dans la littérature antérieure.
La thèse conclut sur l’idée que la diversité liée aux lieux de naissance con-stitue une dimension fondamentalement nouvelle de l’immigration et appelle à repenser les politiques d’immigration en intégrant la dimension de la diversité.
Abstract
This thesis deals with the economic analysis of population diversity, specifically diversity in terms of people’s countries of origin. We propose an index of birth-place diversity for the work force of 195 countries in the years 1990 and 2000. This index is available for skilled (college-educated) and unskilled workers and is decomposed into an extensive margin, the share of the immigrant population, and an intensive margin, the diversity of the immigrant population. We show that birthplace diversity is a new dimension of population diversity that is con-ceptually and empirically distinct from ethno-linguistic and genetic measures of diversity and, unlike these, is positively correlated with long-run economic output. Chapter 1 provides a comprehensive interpretation of our results.
In Chapter 2, we use OLS and 2SLS estimators on a dataset of 120 countries and control for a wide range of confounding factors (e.g., education, trade, geography and institutions). Our results show that the diversity of immigrant workers positively a ects GDP and TFP per capita. This e ect is larger for skilled immigrants in richer countries. A particular focus is given to multiple sources of endogeneity. Our results remain robust to a wide range of alternative specifications (among those a 2SLS model) and thus appear unlikely to be driven solely by endogeneity. We also find the productive e ect of diversity to be larger for immigrants who are culturally close (but not too close) to natives and those who come from richer origin countries. Collectively, these results suggest the presence of production function complementarities between natives and immigrants.
In Chapter 3, we investigate the link between birthplace diversity and atti-tudes to immigration. Using the World Values Survey with data for 72 countries, we find that skilled natives increase their support for immigration when diver-sity of skilled immigrants is high. Results are robust to using the European Social Survey as alternative data source and also persist in a 2SLS model where
a gravity model-predicted measure of diversity is used for instrumentation. We also find evidence for negative preference e ects of immigrant diversity for more ethnocentric individuals. Overall, these results are at odds with a simple la-bor market hypothesis and suggest that attitudes to immigration follow a more elaborate model that allows for labor market complementarities at the upper end of the skill distribution.
In Chapter 4, we analyze the link between birthplace diversity and attitudes to redistribution in Europe. Using data for 29 European countries, we find that native workers tend to lower their support for redistribution of income when immigration (at the country or occupation level) is high. In addition, this e ect varies along the skill distribution of natives, converges towards zero for highly educated individuals and is robust to using more detailed measures of labor market skill. Collectively, these results suggest the presence of well-known group loyalty and also less-known labor market e ects of immigration (which have not been discussed in prior literature).
We conclude that birthplace diversity is a fundamentally new dimension of population diversity with novel economic and social implications for the way immigration is analyzed and treated as a policy question.
Acknowledgements
This thesis would have never been possible without Alberto Alesina and would have never come to fruition without Hillel Rapoport. I feel honored for the privilege to have learned from them.
Alberto Alesina encouraged me to work on ethnic diversity, guided me through the ups and downs of my first steps in academic research and asked me the crucial question “why don’t you do a PhD?” Hillel Rapoport pointed me to birthplace diversity, agreed to supervise my thesis, arranged work meet-ings in locations as diverse as Boston, Tel Aviv, Munich or Paris, and, most importantly, taught me to see the world with more curious eyes. I hope to teach others what they taught me.
I also thank Jean-Claude Berthélemy, Hippolyte d’Albis, Yves Zenou and Ekaterina Zhuravskaya for kindly agreeing to be part of my thesis committee as well as the Université Paris 1 Panthéon-Sorbonne for warm hospitality.
Finally, I thank my dear fiancée Sandra, my parents, my brothers and friends. You are my travel companions on the journey that is life. Above us only sky.
Chapter 1
Birthplace Diversity
One of the most important challenges facing modern societies, and at the same time one of our most significant opportunities, is the increase in ethnic and social heterogeneity in virtually all advanced countries. The most certain prediction that we can make about almost any modern society is that it will be more diverse a generation from now than it is today.
In the long run immigration and diversity are likely to have impor-tant cultural, economic, fiscal, and developmental benefits. In the short run, however, immigration and ethnic diversity tend to reduce social solidarity and social capital.
Robert Putnam, 2007
1.1
Introduction
These words summarize the state of economics and political science knowledge on population diversity a couple of years ago. Putnams words, at the most general level, remain true today as they were then. But our understanding of many nuances has advanced significantly since.
This thesis aims to contribute to this advancement of our joint knowledge. The common thread of this work is the new concept of birthplace diversity — het-erogeneity in people’s countries of birth. Putnam’s remark shows that the two distinct concepts ethnic diversity and immigration — due to then-prevailing lack of country-level data — had been largely seen as two closely related margins of
population diversity. We hope to demonstrate that birthplace diversity (arising from people crossing national borders) is a fundamentally new and interesting margin of heterogeneity. This margin is surprisingly unrelated to measures of ethnic diversity. It also likely has very di erent implications.
This thesis focuses on birthplace diversity’s economic and social implications and stands at the intersection of research on economic growth, migration and political economy. We address three broad questions. The first of these relates to birthplace diversity’s long run economic benefits, while the latter ones relate to its social costs:
• Does birthplace diversity raise long run income/capita and productivity? • Does birthplace diversity a ect preferences for immigration policy? • Does birthplace diversity a ect preferences for redistributive policy? Each question corresponds to one of the following chapters. The chapters generally start from a more specific version of these broader questions, with the objective of contributing an (even if tiny) novel aspect to the large existing body of research.
1.2
Diversity and economic prosperity
This chapter contributes to the research on population diversity and macroeco-nomic growth, which has established a range of results mostly for ethnic/linguistic and genetic diversity.
Population diversity in terms of ethnic or linguistic di erences tends to yield negative economic outcomes. Ethnic diversity is associated with lower economic growth (Alesina et al., 2003, Desmet et al., 2012), particularly in countries with weak institutions (Collier, 1999, 2001). This is due to ethnic conflict (Easterly and Levine, 1997), lower levels of trust (Alesina and La Ferrara, 2000, 2002) and sub-optimal levels of public goods provision (Alesina et al., 1999). Lastly, ethnic diversity may itself be endogenous to deeper geographic determinants at the sub-national level (Michalopoulos, 2012).
Alternative dimensions of diversity, namely genetic diversity, capture not only costs but also benefits of heterogeneity. Ashraf and Galor (2013a,b) con-tend that genetic diversity has a long-lasting e ect on population density in the pre-colonial era as well as on contemporary income per capita. More specif-ically, they estimate genetic diversity’s e ect on income to follow an inverted
1.2. DIVERSITY AND ECONOMIC PROSPERITY 3 u-shape with an optimal genetic diversity close to that of the United States today. This pattern can be interpreted as the trade-o between beneficial forces of diversity such as a wider spectrum of traits that enhance knowledge creation and detrimental forces that generate ine ciencies due to lower trust as well as un-cooperative behavior.
What about a new dimension of population diversity, one that is based not on ethnic or genetic di erence, but (very naturally) on di erences with respect to people’s country of birth? Empirical macro evidence for this type of diversity is limited to U.S. cities and has only recently arrived at the country level (Ottaviano and Peri, 2006, Ortega and Peri, 2013).
In this chapter, we define a birthplace diversity index for 195 countries. We show that this index indeed captures a new dimension of diversity, which is (sur-prisingly) largely uncorrelated with previous diversity measures. In addition, the new index correlates highly robustly with income per capita. While it may seem natural to see ethnic diversity as a longer-term stock and birthplace diversity simple as a short term (one-generation) flow measure, the inherent coarseness of ethnic or linguistic diversity indices (on average only 5 ethnic/linguistic groups per country) directly implies that the link between birthplace and ethnic di-versity is ambiguous (think of emigrants from Haiti to Canada). Furthermore, ethnic/linguistic diversity indices likely capture a di erent type of heterogeneity than birthplace diversity, one that may not be as valuable in production (think of two immigrants to the United States, a fourth-generation grand-grandchild of an emigrated German peasant and a first-generation German immigrant).
Using a dataset of 120 countries, we then empirically investigate the rela-tionship between the birthplace diversity of a country and measures of economic prosperity (GDP and TFP per capita). We demonstrate a positive correlation between birthplace diversity and income/productivity. This association is par-ticularly strong for the diversity of skilled immigrants in richer countries. Based on 2SLS estimates using a gravity model-based instrument, we find that increas-ing the diversity of skilled immigration by one percentage point increases long run economic output by 1-2%.
We extensively discuss identification issues arising from potential reverse causality, unobserved heterogeneity among skilled immigrants, and omitted vari-ables. The solutions we propose (among them various robustness checks and a gravity model of migration) deal at least partly with these issues. Based on these discussions, we conclude that it is unlikely that such e ects explain our main results.
Lastly, we extend our index of birthplace diversity and account for cultural and economic distance between immigrants and natives. The productive e ects of birthplace diversity are largest for immigrants that are culturally closer (but not too close) to natives and those who come from richer origin countries. This finding suggests an economically optimal level of birthplace diversity at interme-diate cultural distance from natives. We interpret these findings as suggestive of production function e ects of birthplace diversity that emerge from complemen-tarities in skills or problem solving capabilities for workers with diverse origins in joint production tasks.
1.3
Diversity and attitudes to immigration
This chapter contributes to the literature on non-economic e ects of birthplace diversity, namely social preferences. People’s preferences influence political de-cisions on immigration policy, and these preferences may be informed by the actual patterns of birthplace diversity. On average, people tend to hold rela-tively restrictive views on immigration — only a small minority of rich country citizens (less than 10%) expresses a desire to invite more immigrants to their countries (Transatlantic Trends, 2011).
Previous research has analyzed a range of individual and country level fac-tors in terms of their e ect on attitudes to immigration. A very stable empiri-cal pattern is that support for immigration increases in an individual’s level of education (O’Rourke and Sinnott, 2001, Card, Dustmann and Preston, 2005, Mayda, 2006, Scheve and Slaughter, 2006). This has typically been interpreted as evidence for labor market e ects (Mayda, 2006, Scheve and Slaughter, 2006), namely that more educated natives favor immigration if immigrants are rel-atively less educated, since those immigrant workers are not substitutes, but rather complements for such natives. Alternative hypotheses proposed for this phenomenon revolve around the thesis of “educated preferences” (Hainmueller and Hiscox, 2007, 2010), namely that higher education fundamentally changes individuals’ preferences, making them less ethnocentric and more open to im-migration. A recent study by Card, Dustmann and Preston (2012) finds some evidence for both channels, but gives higher weight to the latter explanation, while other studies using more detailed measures of skill (based on task skill intensities) strengthen the former, labor market e ects (Ortega and Polavieja, 2012).
1.4. DIVERSITY AND ATTITUDES TO REDISTRIBUTION 5 We revisit this still controversial question using the newly introduced mea-sure of country level birthplace diversity. Specifically, we ask a very intuitive question: How do the share of immigrants, their diversity and their skill level compared to natives a ect natives’ attitudes to immigration? Based on the prior literature, one should expect the e ect of more immigrants to vary with immigrant and native skill, the e ect of immigrant diversity to be negligible and the e ect of relative skill to vary with native skill. Surprisingly, our findings are not in line with this prior.
Using the World Values Survey with data for individuals in 72 countries, we find that skilled natives are more likely to support open immigration policies if immigration of skilled workers is more diverse. A one standard deviation increase in diversity raises this likelihood by about 5 percent. This relationship is particularly strong for people in the labor force, those who are employed and those working in knowledge-intensive occupations. Endogeneity concerns are addressed using a gravity model of migration. These results are robust to a wide range of alternative specifications including the use of an alternative survey for European countries (European Social Survey). Surprisingly, the relative skill level of immigrants compared to natives does not a ect attitudes. Our results suggest that educated natives’ attitudes follow an extended labor market model that allows for productive labor market complementarities between skilled natives and skilled immigrants.
1.4
Diversity and attitudes to redistribution
This chapter further contributes to the literature on non-economic e ects of birthplace diversity. Here, we focus on preferences towards redistribution.
The study of attitudes to redistribution — like that of attitudes to immigra-tion — starts with economic models of individual utility maximizaimmigra-tion (Meltzer and Richard, 1981, Benabou and Ok, 2001). A very intuitive central prediction of these models is that individuals with higher current or prospective income tend to view redistribution less favorably than others. These predictions, par-ticularly those for expected future income, find ample empirical support. People with past experience of upward income mobility are less in favor of income re-distribution (Piketty, 1995), those with higher subjective (Corneo and Grüner, 2002) and objective (Alesina and La Ferrara, 2005) chances to move up in the income ladder follow the same pattern. Beliefs about the worthiness of the
redistributive beneficiaries also matter. People who believe that the poor are poor more due to bad luck than due to lack of e ort tend to be more generous (Alesina and La Ferrara, 2005).
How does population diversity a ect these attitudes? The answer depends on the particular dimension of diversity. Racial diversity (and to a lesser extent ethnic diversity) matters, particularly in the United States. As many studies for the U.S. show, representatives of the (white) American majority are found to be much less supportive of redistribution than members of minority groups (Alesina and La Ferrara, 2005). This is typically interpreted not only as heterogeneity in cultural preferences, but as sign of racial prejudices. Using individual data for the U.S., Luttmer (2001) shows evidence for “group loyalty e ects”, namely that support for redistribution increases if members of the respondent’s own ethnic group are over-represented among welfare recipients.
Empirical evidence for the U.S. shows that lower attitudes to redistribution due to racial heterogeneity even extend to lower actual levels of redistribution (Alesina, Baqir and Easterly, 1999). In addition, Alesina and Glaeser (2004) show that the share of African- Americans in the population correlates highly negatively with maximum welfare allowances across U.S. states. These studies for the U.S. have in common that they find racial, not ethnic, linguistic or birth-place di erences, to be the politically salient margin with respect to attitudes and welfare spending.
Strikingly, empirical evidence for Europe is comparatively sparse. We aim to fill this gap and start from the prior that the results for ethnic diversity in the United States may not hold 1:1 in a European context. We ask whether birthplace diversity in general, and specifically in terms of its size, diversity and relative skill of immigrants to natives, a ects natives’ attitudes to redistribution in Europe.
Using European Social Survey and OECD migration data for individuals in 29 European countries, we find evidence consistent with two potential chan-nels. First, we confirm the presence of group loyalty e ects that are strong in the U.S. along the racial dimension for the native/immigrant dimension in Europe — but at much lower magnitudes. Second, we find evidence for a novel channel of influence on attitudes to redistribution, labor market e ects. These make certain natives more supportive of redistributive policy. We conclude that birthplace diversity - not racial/ethnic diversity - is the politically salient mar-gin of diversity in Europe. The presence of two partly compensating channels of e ect further suggests that immigration to Europe will - at best - only modestly
1.5. REFERENCES 7 decrease support for the welfare state in Europe.
1.5
References
Alesina, A., R. Baqir and W. Easterly (1999), "Public Goods and Ethnic Divisions." Quarterly Journal of Economics, 114(4): 1243-84.
Alesina, A., A. Devleeschauwer, W. Easterly, S. Kurlat and R. Wacziarg (2003), "Fractionalization." Journal of Economic Growth, 8(2): 155-194.
Alesina, A. and E. La Ferrara (2000), "Participation in Heterogeneous Com-munities." Quarterly Journal of Economics, 115(3): 847-904.
Alesina, A. and E. La Ferrara (2002), "Who Trusts Others?" Journal of Public Economics, 85(2): 207-234.
Alesina, A. and E. La Ferrara (2005), "Preferences for Redistribution in the Land of Opportunities." Journal of Public Economics, 89(5): 897-931.
Alesina, A. and E. Glaeser (2004), "Fighting Poverty in the U.S. and Europe: A World of Di erence." Oxford: Oxford University Press.
Ashraf, Q. and O. Galor (2013a), "The Out of Africa Hypothesis, Human Genetic Diversity and Comparative Economic Development." American Eco-nomic Review, 103(1): 1-46.
Ashraf, Q. and O. Galor (2013b), "Genetic Diversity and the Origins of Cultural Fragmentation." American Economic Review, 103(3): 528—533.
Benabou, R. and E. Ok (2001), "Social Mobility and the Demand for Redis-tribution: The POUM Hypothesis." Quarterly Journal of Economics, 116(2): 447-487.
Card, D., C. Dustmann and I. Preston (2005), "Understanding Attitudes to Immigration: The Migration and Minority Module of the first European Social Survey." CDP Working Paper No 03/05.
Card, D., C. Dustmann and I. Preston (2012), "Immigration, Wages, and Compositional Amenities." Journal of the European Economic Association, 10(1): 78—119.
Collier, P. (1999), "On the Economic Consequences of Civil War." Oxford Economic Papers, 51: 168-183.
Collier, P. (2001), "Ethnic Diversity: An Economic Analysis of its Implica-tions." Economic Policy, 32: 129-166.
Corneo, G., and H.P. Grüner (2002), "Individual Preferences for Political Redistribution." Journal of Public Economics, 83(1), 83-107.
Dahlberg, M., K. Edmark and H. Lundqvist (2012), "Ethnic Diversity and Preferences for Redistribution." Journal of Political Economy, 120(1): 41-76.
Desmet, K., I. Ortuño-Ortín and R. Wacziarg (2012), "The Political Econ-omy of Ethnolinguistic Cleavages." Journal of Development Economics, 97(2): 322-338.
Easterly, W. and R. Levine (1997), "Africa’s Growth Tragedy: Policies and Ethnic Divisions." Quarterly Journal of Economics, 112(4): 1203-1250.
Hainmueller, J. and M. Hiscox (2007), "Educated Preferences: Explaining Attitudes Toward Immigration in Europe." International Organization, 61(2): 399—442.
Hainmueller, J. and M. Hiscox (2010), "Attitudes toward Highly Skilled and Low-skilled Immigrants: Evidence from a Survey Experiment." American Political Science Review, 104(1): 61—84.
Luttmer, E. (2001), "Group Loyalty and the Taste for Redistribution." Jour-nal of Political Economy, 109(3): 500-528.
Mayda, A. (2006), "Who is against immigration? A cross—country investi-gation of individual—level attitudes toward immigrants." Review of Economics and Statistics, 88(3): 510—530.
Meltzer, A. and S. Richard (1981), "A Rational Theory of the Size of Gov-ernment." Journal of Political Economy, 89(5): 914-927.
Michalopoulos, S. (2012), "The Origins of Ethnolinguistic Diversity." Amer-ican Economic Review, 102(4): 1508-1539.
O’Rourke, K. and R. Sinnott (2006), "The determinants of individual at-titudes towards immigration." European Journal of Political Economy, 22(4): 838—861.
Ortega, F. and J. Polavieja (2012), "Labor Market Exposure as Determinant of Attitudes toward Immigration." Labour Economics, 19(3): 298—311.
Ortega, F. and G. Peri (2013), "Migration, Trade and Income." IZA Working Paper No. 7325.
Ottaviano, G. and G. Peri (2006), "The Economic Value of Cultural Diver-sity: Evidence from U.S. Cities." Journal of Economic Geography, 6(1): 9-44.
Piketty, T. (1995), "Social Mobility and Redistributive Politics." Quarterly Journal of Economics, 110(3): 551-584.
Putnam, R. (2007), "E Pluribus Unum: Diversity and Community in the Twenty-First Century. The 2006 Johan Skytte Prize Lecture." Scandinavian Political Studies, 30(2): 137-174.
1.5. REFERENCES 9 Scheve, K. and M. Slaughter (2001), "Labor Market Competition and Indi-vidual Preferences Over Immigration Policy." Review of Economics and Statis-tics, 83(1): 133—145.
Transatlantic Trends (2011), "Transatlantic Trends: Immigration.” Wash-ington: German Marshall Fund of the United States.
Chapter 2
Diversity and Economic
Prosperity
ABSTRACT1
We propose an index of population diversity based on people’s birthplaces and decompose it into a size (share of foreign-born) and a variety (diversity of immigration) component. We show that birth-place diversity is largely uncorrelated with ethnic, linguistic or ge-netic diversity and that the diversity of immigration relates
pos-itively to measures of economic prosperity. This holds especially
for skilled immigrants in richer countries at intermediate levels of cultural proximity. We partly address endogeneity by specifying a pseudo-gravity model predicting the size and diversity of immigra-tion. The results are robust across specifications and suggestive of skill-complementarities between immigrants and native workers.
2.1
Introduction
Foreign-born individuals now represent about ten percent of the workforce in OECD countries, a threefold increase since 1960 and a twofold increase since
1990.2 What does this increase in intrapopulation diversity - namely birthplace
1This chapter is co-authored with Alberto Alesina (Harvard University) and Hillel
Rapoport (Université Paris 1 Panthéon-Sorbonne and Paris School of Economics)
2See Ozden et al. (2011) for a picture of the evolution of international migration over the
last fifty years. High-skill migration stands out even more, with a twofold increase during the
diversity - imply for receiving countries? In general, diversity leads to beneficial skill complementarities in certain production processes, but also to detrimental
ine¢ciencies due to lower trust and social cohesion.3 The empirical literature
has so far focused on ethnic and linguistic fractionalization, which were shown to exert negative e§ects on economic growth in cross-country comparisons (East-erly and Levine, 1997, Collier 2001, Alesina et al., 2003, 2012) with the possible exception of very rich countries, and on genetic diversity (Ashraf and Galor, 2013a,b) which has an inverse u-curve relationship with GDP per capita.
In this paper we examine the relationship between population birthplace diversity and economic prosperity. Surprisingly, ethnic, genetic and birthplace diversity are empirically almost completely uncorrelated. Conceptually, ethnic, genetic and birthplace diversity also di§er as people born in di§erent countries are likely to have been educated in di§erent school systems, learned di§erent skills, and developed di§erent cognitive abilities.
This paper makes four contributions.
First, we construct and discuss the properties of a new index of birthplace diversity. We build indicators of diversity for the workforce of 195 countries in 1990 and 2000, disaggregated by skill/education level, and computed both for the workforce as a whole and for its foreign-born component.
Second, we investigate the relationship between birthplace diversity and eco-nomic development. We find that unlike ethnic/linguistic fractionalization or genetic diversity, birthplace diversity is positively related to productivity and GDP per capita after controlling for many covariates. This positive relationship is stronger for skilled migrants (workers with college education) in richer, more productive countries. We interpret this as suggestive evidence that birthplace diversity works through a channel of production function e§ects closer to the technology frontier. In terms of magnitudes, increasing the diversity of skilled
immigration by one percentage point raises long-run output by 1-2%.4
Third, we make progress towards addressing endogeneity issues arising from potential omitted variables bias, selection on unobservables and reverse causal-ity. Among other approaches, we specify a gravity model to predict the size and diversity of a country’s immigration using exogenous bilateral geographic/cultural variables and confirm the robustness of our initial findings in 2SLS models.
1990s alone (see Docquier and Rapoport, 2012).
3See Alesina and La Ferrara (2005) for a survey.
4A one percentage point increase in the diversity index corresponds to a one percent increase
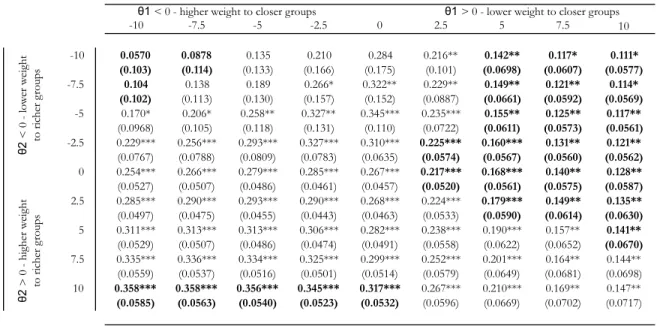
2.1. INTRODUCTION 13 Fourth, we allow the e§ect of diversity to vary with bilateral distance between immigrants and natives along two dimensions, genetic/cultural distance and income at origin. The productive e§ect of birthplace diversity is largest for immigrants from richer origin countries and immigrants that are su¢ciently (but not too much) culturally di§erent from natives. This suggests an optimal level of birthplace diversity in terms of embedded cultural proximity.
The empirical evidence linking income/productivity and the new dimension of birthplace diversity is relatively limited. Studies so far focused, to the best of our knowledge, largely on the context of the United States. Ottaviano and Peri (2006) construct a measure of cultural diversity (based on origin country data) for the period 1970-1990 using migration data on U.S. metropolitan areas and find positive e§ects on the productivity of native workers as measured by their wages. Peri (2012) finds positive e§ects of the diversity coming from immigra-tion on the productivity of U.S. states, a result he attributes to unskilled mi-grants promoting e¢cient task-specialization and adoption of unskilled-e¢cient technologies, and more so when immigration is diverse. Ager and Brückner (2013) study the link between immigration, diversity and economic growth in the context of the United States about a century ago, at a time now commonly
referred to as "the age of mass migration" (Hatton and Williamson, 1998).5
They find that fractionalization increases output while polarization decreases it in U.S. counties during the period 1870-1920. Finally, a paper by Ortega and Peri (2013) also analyzes the connection between income per capita/TFP and migration in a cross-section of countries. They focus on the growth e§ects of openness and diversity of trade vs. migration and find the share of immigra-tion to be a stronger determinant of long run output than trade. Instead, we focus on the e§ect of intrapopulation diversity, comparing birthplace to other dimensions of diversity (ethnic, linguistic, genetic) and demonstrate the positive e§ect of the former (especially for diversity arising from high-skill immigration) on long-run income and productivity.
The rest of this paper proceeds as follows. Section 2 briefly discusses theoret-ical channels and related micro and macro literature on diversity and economic performance. Section 3 explains the construction and analytical decomposition of our birthplace diversity index; we also explore its descriptive features and patterns of correlation with other diversity/fractionalization indices. In Section
5See also Bandiera, Rasul and Viarengo (2013) and Abramitzky, Boustan and Eriksson
(2012a/b), respectively, on the measurement of entry and return flows and on migrants’ self-selection during that period.
4 we provide data sources, develop our empirical model, and describe OLS re-sults for birthplace diversity in a range of empirical specifications. In Section 5, we discuss and assess multiple identification issues. In Section 6, we extend our birthplace diversity index to include cultural distance and income at origin. Section 7 concludes.
2.2
Related literature
People born in di§erent places are likely to have di§erent productive skills be-cause they have been exposed to di§erent life experiences, di§erent school and value systems, and thus have developed di§erent perspectives that allow them to interpret and solve problems di§erently. If early pre-working age years are formative for one’s own values, perspectives and problem solving skills, these dif-ferences are likely (at least more likely than di§erences in skin color or language spoken at home) to be complementary and lead to higher overall productivity. Birthplace diversity, therefore, may be beneficial for productivity due to skill complementarities. Alesina et al. (2000) formalize this idea using a Dixit-Stiglitz type production function where outputs increase in the variety of inputs and inputs can be interpreted as di§erent workers. Their model thus allows for di-versity to increase output without any counterbalancing costs. Lazear (1999a,b) proposes a model of teams of workers where diversity brings benefits via pro-duction complementarities from relevant disjoint information sets and also costs via barriers to communication; with decreasing marginal benefits and
increas-ing marginal costs, this suggests that there is an optimal degree of diversity.6
Hong and Page (2001) see two sources for the heterogeneity of people’s minds: cognitive di§erences between people’s internal perspectives (their interpretation of a complex problem) as well as their heuristics (their algorithms to solve these problems). They show theoretically that, under certain conditions, a group of cognitive diverse but skill-limited workers can outperform a homogenous group
of highly skilled workers.7
Empirically, diversity is commonly measured by fractionalization (Easterly and Levine 1997, Alesina et al., 2003, Fearon, 2003) and polarization indices (Esteban and Ray, 1994, Reynal-Querol, 2002 and Montalvo and Reynal-Querol,
6A related argument, also brought forward by Lazear (1999b), is that diverse groups of
immigrants tend to assimilate more quickly (in terms of learning the language of the majority) since they have stronger incentives to do so.
7Fershtman, Hvide and Weiss (2006) reach similar conclusions in a model where workers
2.2. RELATED LITERATURE 15 2005, 2011).
At a macro level, the costs of fractionalization have been established em-pirically in particular for ethno-linguistic diversity. These studies began with Easterly and Levine (1997), who show that ethnic fragmentation is associated with lower economic growth, specifically in Africa. Collier (1999, 2001) adds that ethnic fractionalization is less detrimental in the presence of democratic
institutions that mediate ethnic conflict.8 Alesina and La Ferrara (2000, 2002)
stress the role of trust, showing that individuals in racially diverse cities in the U.S. participate less frequently in social activities and trust their neighbors to a lesser degree. The authors also find evidence that preferences for redistribution are lower in racially diverse communities. This also extends to the provision of productive public goods (Alesina, Baqir and Easterly, 1999). Alesina et al.
(2012) highlight the inequality dimension of ethnic diversity9 while Esteban,
Mayoral and Ray (2012) distinguish conflicts over public and private goods and find polarization to correlate positively with conflict on the former, and frac-tionalization to correlate positively with the latter (see also Esteban and Ray, 2011). Most recently, Ashraf and Galor (2013a) introduce a new dimension of diversity, intrapopulation genetic heterozygosity. Genetic diversity is found to have a long-lasting e§ect on population density in the pre-colonial era as well as contemporary income per capita. More specifically, the authors find an inverted u-shaped relationship between genetic diversity and productivity, suggestive of the trade-o§ between beneficial forces of diversity expanding the technology
frontier and detrimental ones leading to higher ine¢ciency and conflict.10
At a micro level, empirical studies of diverse teams in the management and organization literature also find diversity to be a double-edged sword, with di-versity (in terms of gender, education, tenure, nationality) being often beneficial for performance but also decreasing team cohesion and increasing coordination costs (see Milliken and Martins, 1996, and O’Reilly et al., 1989). A study in the airline industry by Hambrick et al. (1996) finds that management teams het-erogenous in terms of education, tenure and functional background react more slowly to a competitor’s actions, but also obtain higher market shares and profits than their homogeneous competitors. In a recent experimental study,
Hoogen-8It is, however, unclear if this observation is not a corollary of higher income (and
presum-ably production function e§ects).
9For these authors, it is the interplay between ethnic fractionalization and ethnic inequality
that leads to conflict.
1 0In another paper, Ashraf and Galor (2011) find that cultural diversity (based on World
Values Survey data) is positively correlated with contemporary development and suggest that cultural diversity facilitated the transition from agricultural to industrial societies.
doorn and van Praag (2012) set up a randomized experiment in which business school students were assigned to manage a fictitious business and increase out-come metrics like market share, sales and profits of their business. The authors find that more diverse teams (defined by parents’ countries of birth) outperform more homogeneous ones, but only if the majority of team members is foreign. Hjort (2013) analyzes productivity at a flower production plant in Kenya and uses quasi-random variation in ethnic team composition as well as natural ex-periments in this setting to identify productivity e§ects from ethnic diversity in joint production. He finds evidence for taste-based discrimination between ethnic groups, suggesting that ethnic diversity, in the context of a society with deep ethnic cleavages and weak institutions, a§ects productivity negatively.
Brunow et al. (2012) analyze the impact of birthplace diversity on firm pro-ductivity in Germany. They find that the share of foreigners has no e§ect on firm productivity while the diversity of foreign workers does impact firm perfor-mance positively (as does workers’ diversity at the regional level). These e§ects appear to be stronger for manufacturing and high-tech industries, suggesting the presence of skill complementarities at the firm level as well as regional spill-overs from workforce diversity. Parrotta et al. (2012) use a firm level dataset of matched employee-employer records in Denmark to analyze the e§ects of di-versity in terms of skills, age and ethnicity on firm productivity. They find that while diversity in skills increases productivity, diversity in ethnicity and age decreases it. They interpret this as showing that the costs of ethnic diver-sity outweigh its benefits. Interestingly, they also find suggestive evidence that diversity is more valuable in problem-solving oriented tasks and in innovative industries. Ozgen et al. (2013) match Dutch firm level innovation survey data with employer/employee records and find that the diversity of immigrant work-ers increases the likelihood of product and process innovations. Boeheim et al. (2012) find further micro level evidence for the presence of production function complementarities using a linked dataset of Austrian firms and their workers during the period 1994-2005. The workers’ wages increase with diversity and the e§ect is stronger for white-collar workers and workers with young tenure.
2.3
An index of birthplace diversity
We base our birthplace diversity measure on the Herfindahl diversity index. Let
2.3. AN INDEX OF BIRTHPLACE DIVERSITY 17 i = 1, . . . , I. In particular, i = 1 refers to natives.
The fractionalization index Divpop may be expressed as:
Divpop= I X i=1 si (1 si) = 1 I X i=1 (si)2 (2.1)
This index measures the probability that two individuals drawn randomly from the entire population have two di§erent countries of birth, i.e. the
Herfind-ahl index. A certain level of moderate Divpopmay come from a relatively small
but very diverse pool of immigrants, or by a relatively homogenous but large fraction of immigrants in the population. It is useful then to develop indices which can highlight these di§erences.
We therefore decompose our diversity index into a Divbetweenand a Divwithin
component. We define Divbetween as the diversity from immigration,
irrespec-tive of further country of origin-di§erences. Divwithinthen captures all residual
diversity from di§erences between immigrants only. If we assume that all
im-migrants are born in one country i = 2 so that s1+ s2= 1, then using (2.1) we
can define:
Divbetween= s1 (1 s1) + (1 s1) s1 (2.2)
This essentially calculates the Divpop index assuming that all migrants can
be grouped into one category (1 s1) - thus excluding all diversity contributed
by the fact that migrants tend to come from more than one origin country.
We rewrite (2.2) to include Divbetween as follows:
Divpop = 2 s1 (1 s1) +
I X i=2
[si ((1 si) s1)] (2.3)
We can now define
Divwithin=
I X i=2
[si ((1 si) s1)] (2.4)
so that Divpop is composed of two parts, Divbetween and Divwithin:
Divpop = Divbetween+ Divwithin (2.5)
This decomposition does not separate clearly between size and variety e§ects: Divwithin still depends on s1 - the share of natives -, sincePIi=2si= (1 s1).
We thus rewrite the Divwithin component so that it does not depend on s1. We
achieve this by defining sj as the share of immigrants from country j in the
total population of immigrants. It follows that sj= (1ssi1) where s1is the share
of natives (i = 1).
We thus re-scale Divwithin using (2.4):
Divwithin= I X i=2 " si (1 s1) ((1 si) s1) (1 s1) # (1 s1)2 (2.6)
and simplify to:
Divwithin= J X j=1 h sj (1 sj) i (1 s1)2 (2.7)
Our result has a very intuitive interpretation: since PJj=1hsj (1 sj)
i is basically (2.1) but applied to the population of immigrants, it is essentially a diversity index of immigrants only, irrespective of the natives. We thus define:
Divmig= J X j=1 h sj (1 sj) i (2.8) And rewrite (2.5)
Divpop= Divbetween+ (1 s1)2 Divmig (2.9)
where (1s1)2has an intuitive interpretation as scale parameter for Divmig.
We can then rewrite (2.9) in terms of sf, the share of immigrants (defined
as foreign-born) and define sf = (1 s1):
Divpop = 2 sf (1 sf) + (sf)2 Divmig (2.10)
We have thus an expression of Divpop purely as a function of the size and
2.4. EMPIRICAL ANALYSIS 19
2.4
Empirical analysis
2.4.1
Birthplace diversity data
Our computation of birthplace diversity indices relies on the Artuc, Docquier, Ozden and Parsons (henceforth ADOP, 2013) data set that provides a com-prehensive 195x195 matrix of bilateral migration stocks disaggregated by skill category (with or without college education) and gender for the years 1990 and 2000. Immigrants are defined as foreign-born individuals aged 25+ at census or survey date. The dataset is based on a comprehensive data collection e§ort in the host countries. For few destinations (and even fewer in our sample), o¢cial census information is not available. ADOP 2013 thus rely on a gravity
model-based estimation of these cells.11 In our sample, only 10% of skilled immigrants
are estimated.12
Three caveats are in order. First, illegal immigration is not accounted for in most censuses, although in some case lime in the U.S. it is estimated. However, this limitation is mitigated by the fact that we use data on immigration stocks, not flows: most illegal migrants eventually become legalized or return to their country of origin. Second, immigrants who are children at age of entry are subsequently treated fully as immigrant workers (when aged 25+). However, these people will grow up, socialize and go to school in the host country, which puts a limit on the extent of variety in skills that he or she can contribute. We address this issue in a robustness check. Third, a migrant is considered skilled independently of the location of college education, meaning that skilled migrants may be heterogeneous in terms of human capital quality. We partly address this issue by controlling for what we call "origin-e§ects" and review implications for our identification in Section 5.
2.4.2
Descriptive statistics and correlations
Figure 1 shows bilateral correlations between ethnic, genetic and birthplace diversity measures. Overall, these di§erent dimensions of diversity are only very weakly correlated. The correlation between ethnic fractionalization and
Divmig (all) is negative at -.11 and close to zero for Divmig(skilled). Similarly,
all bilateral correlations between the di§erent dimensions of ethnic, linguistic,
1 1See ADOP (2013) for more details.
1 2We conduct a robustness check restricting our OLS and IV models to those non-estimated
genetic and birthplace diversity are relatively low (see Table 1 for correlations
and summary statistics).13
There is ample variation in country level birthplace diversity: Canada, Italy, Israel, Germany, Australia and the UK have high birthplace diversity of
im-migrants (Divmig). The United States rank only 18th in a list of countries
with the highest immigration diversity (at .92) due to relatively low diversity for unskilled immigration (0.84). Similarly low rankings can be observed for
Germany (rank 27, at .90) and Australia (rank 28, at .90). In terms of Divmig
(skilled), however, the USA is very near the top (at .97). Countries with low-est overall immigration diversity are Pakistan, Bangladesh, Nepal, and Syria and Iran (all lower than .5). Neighboring country e§ects seem to play a role:
Ireland’s Divmig (.54 overall, .44 for the unskilled and .67 for the skilled) is
still quite low due to dominant immigration from the UK. Switzerland, Austria or Australia follow similar patterns. Generally, such e§ects are more prevalent
for Divmig (unskilled). As a result, Divmig (skilled) tends to be higher than
Divmig (unskilled). This is consistent with migrants’ self-selection being driven
by net-of-migration-costs wage di§erentials, where low migration costs (due to
short distances and high networks) mostly a§ect low-skill migration.14
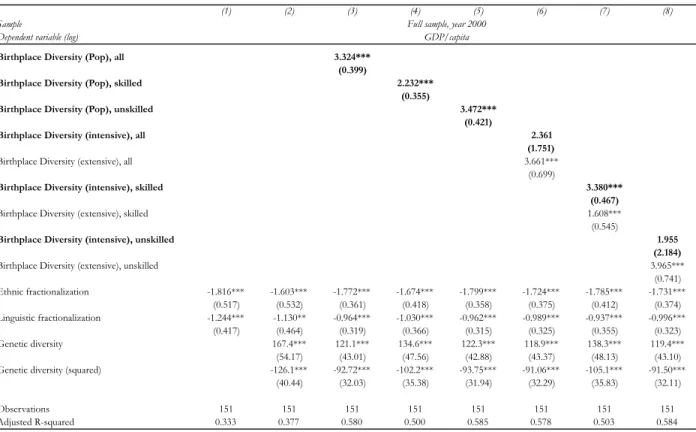
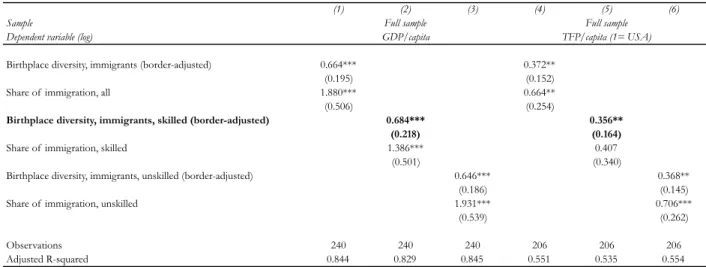
We proceed with a horse race between di§erent dimensions of diversity and income. Table 2 shows our results. Unlike all other dimensions of
diver-sity, Divpop correlates very robustly and positively with economic development
(GDP/capita at PPP), while fractionalization does so negatively. Genetic diver-sity’s e§ect on income follows an inverted u-shape (Ashraf and Galor, 2013a/b). When we include birthplace diversity, coe¢cients on ethnic diversity change only minimally. Strikingly, the inclusion of birthplace diversity adds consider-ably to the predictive power of the model. We interpret this as indication that
- like ethnic diversity (see Michalopoulos, 2012) - Divpopis correlated with and
jointly determined by many other factors, such as geography or the quality of institutions. Interestingly, this seems to be more an issue for the diversity of the unskilled population, and generally this is driven to a lower extent by the variety than the size of immigration. This point is further illustrated in models
(4)-(7): Here, we make use of our decomposition analysis and separate Divpop
into Divbetween and Divwithin. The productive e§ects of Divpop vary by skill
1 3This also holds in first di§erences: the correlation between changes in size and diversity
of skilled immigration 1990-2000 is low and even negative at -.14.
1 4See Munshi (2003), McKenzie and Rapoport (2010) and Bertoli (2010) for micro evidence,
2.4. EMPIRICAL ANALYSIS 21
level: Divpop (unskilled) is mostly driven by Divbetween, but the association of
Divpop (skilled) with income runs mostly through Divwithin. Still, Divbetween
and Divwithin are not independent from each other, as both depend on sf. We
thus proceed with a model that includes a large range of co-determinants of
birthplace diversity and income. We also clearly separate the size (sf) and the
variety (Divmig) dimensions of birthplace diversity.
2.4.3
Model specification
To empirically investigate the relationship between birthplace diversity and eco-nomic development, we specify the following model where our dependent vari-able y is a country’s income (GDP) or productivity (TFP) per capita at real
PPP:15
ln ykt = + 1 diversity of immigrantskst
+2 share of immigrationkst+ 3 origin effectskst
+4 years of schoolingkt+ 5 market size controlskt
+6 kt+ 7 k+ 8 k+ 9 kt+ k+ t+ e (2.11)
kt is a vector of controls for trade openness and trade diversity, k is
a vector of fractionalization/diversity measures, k is a vector of geographic
characteristics, kt is a control for institutional development, is a continent
fixed e§ect and is a period fixed-e§ect. We use indices s for skill groups (s=overall, skilled, unskilled), t for time (1990, 2000) and k for countries.
The results from our decomposition analysis as well as our horse race with
income point to the need to separate Divbetween and Divwithin further into
their components, the share of foreigners, sf, and the diversity of immigrants,
Divmig. Our empirical specification thus includes the share and the diversity of
immigrants evaluated at the means of the respective variables.16
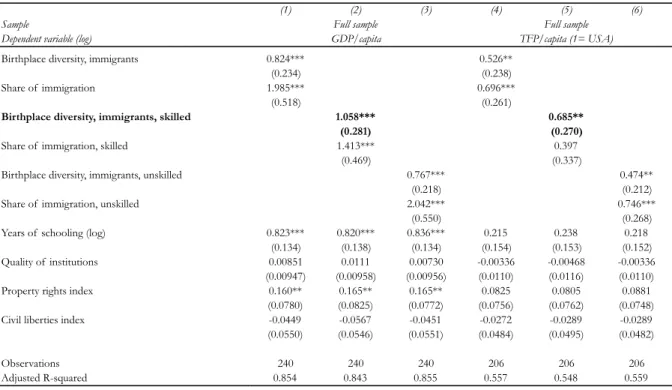
We control for a very wide range of potential confounding factors to avoid omitted variable bias. Our base specification starts with a rudimentary model based on Table 2. We then add further controls, starting with standard co-variates for education (years of schooling, Barro and Lee 2013), market size (population and area sizes and a landlocked dummy, CEPII, 2010) and
origin-1 5See the appendix for details on the definitions and sources for all variables.
1 6We also test for interaction e§ects between size and variety using split samples. Refer to
e§ects. Origin-e§ects of diversity are proxied using a weighted average of the GDP per capita (PPP) of immigrants’ origin countries. This index captures the income at origin of the average representative immigrant and - while not a proxy for the selection of immigrants from each country of origin - correlates with immigrant groups’ ability to cover migration costs. Richer destination countries that draw on (relatively) richer source countries should thus be able to attract a wider range of immigrant groups and have higher immigrant diver-sity. Controlling for such origin-e§ects thus allows us to account for di§erences in migrant backgrounds (and skills) and thus focus on the pure variety e§ect of
immigration.17
For the fractionalization vector, we include both ethnic and linguistic frac-tionalization (from Alesina et al., 2003, and genetic diversity by Ashraf and Galor, 2013a) since all three indices capture a di§erent productive margin of diversity. We also control for the volume and structure of trade, geography and institutional quality since these factors are well known to a§ect long run income (e.g. Frankel and Romer, 1999, Rodrik et al., 2004, Glaeser et al., 2004).
For the trade vector, we use real trade openness from PWT 8.018 and also
control for the structure of trade by constructing measures of trade diversity
(based on Feenstra et al., 2005).19 These diversity indices are the goods market
equivalents of Divpop, since import diversity is a proxy for variety in (imported)
intermediary goods. Controlling for trade is also necessary since trade is
deter-mined by similar factors as migration.20
For the geography vector, we follow the well established literature on
geo-graphical determinants of income21 and include the share of population living
within 100km of an ice-free coast (Gallup et al., 1998), a set of disease measures of malaria, yellow fever and tuberculosis incidence (Gallup et al., 1998, Sachs 2003, World Bank, 2013), average temperature and precipitation (World Bank, 2013) and also include a set of continent fixed e§ects for Latin America, South-East Asia and Sub-Saharan Africa (Rodriguez and Rodrik, 2001, World Bank 2013). For institutional quality, we use the revised combined Polity-2 score
1 7For an extended discussion and more results, see section 5.
1 8We use the standard measure of trade volume: real trade openness (exports+imports)
in % GDP in real PPP prices. This indicator correlates most robustly with GDP growth (Yanikkaya, 2003).
1 9This definition follows the literature on trade concentration, see e.g. Kali et al. (2007) for
the e§ect of trade concentration on income or Frankel et al. (1995) on transportation costs.
2 0Surprisingly, Div
mig and variables of trade openness/diversity are not much correlated
(+.08 for trade openness, +0.12 for trade diversity).
2 1See e.g. Hall and Jones, 1999, Gallup et al., 1998, Rodriguez and Rodrik, 2001, Sachs
2.4. EMPIRICAL ANALYSIS 23 from the Polity IV database (Marshall and Jaggers, 2012). This index measures the competitiveness of political participation, openness of executive recruitment and extent of executive constraints (Glaeser et al., 2004). To account for deeper determinants of institutions, we add a vector of dummies for British, French
and Spanish ex-colonies.22
We end up with a highly structured model and a short panel of 120 countries
with data for 1990 and 2000.23 We made a significant e§ort to broaden our
sam-ple. The 120 countries reflect the intersection of the ADOP (2013) data, which is available for 190 countries and territories (195 origins, but no immigration data for five destinations), the PWT 8.0 data, which does not contain GDP data for 26 of those (and no TFP data for another 17), the education data (Barro and Lee, 2013) which is not available for 25 remaining countries and other data sources where missing data drops another 19 countries (primarily Alesina et al.
2003 and Ashraf and Galor, 2013a).24 Our full sample is very comparable to a
broader sample (lacking data for some covariates) at the intersection of PWT 8.0 and ADOP (2013). Di§erences in sample means are small (not statistically
significant) for most variables, with two exceptions: the sample mean for sf of
skilled people is actually lower in our full sample than in the broader sample.25
This reflects the fact that we drop mainly small island states and territories that
have very few skilled natives and correspondingly higher sf (skilled).26 Still,
after these reductions of the sample size, our full sample still covers 90% of all global migrants and 93.7% of all skilled migrants.
2.4.4
OLS results
We estimate our model using an OLS estimator with standard errors clustered at the country level to account for serial correlation of standard errors. OLS results are presented in Tables 3 to 7, separately for GDP and TFP and also separately for rich and poor countries.
Table 3 shows results for Divmigand sf as estimated in our baseline model.
Coe¢cients on both variables are estimated to a§ect income and productivity positively (at 1% statistical significance). Once we disaggregate skilled and un-skilled immigrants, size seems to be what matters for the latter, and variety
2 2See the appendix for robustness checks on geography and institutions.
2 3For the TFP model, we have 103 countries due to lower data availability in PWT 8.0.
2 4Typical countries that drop out of this sample are small island states or territories.
2 5See appendix for details.
2 6This omission of small island states and territories also results in a slightly higher Div
mig
for the former.27 These findings mirror our results from the horse race (Ta-ble 2) and indicate that variety of origins is particularly valua(Ta-ble for skilled workers. Our three other dimensions of diversity are nearly all estimated to be indistinguishable from zero, but show the expected patterns (e.g. u-shape for genetic diversity). This should not suggest that ethnic or genetic diversity are insignificant for economic development. What they may suggest, however, is that their association with long run income conditional on many other factors is less robust than that for birthplace diversity.
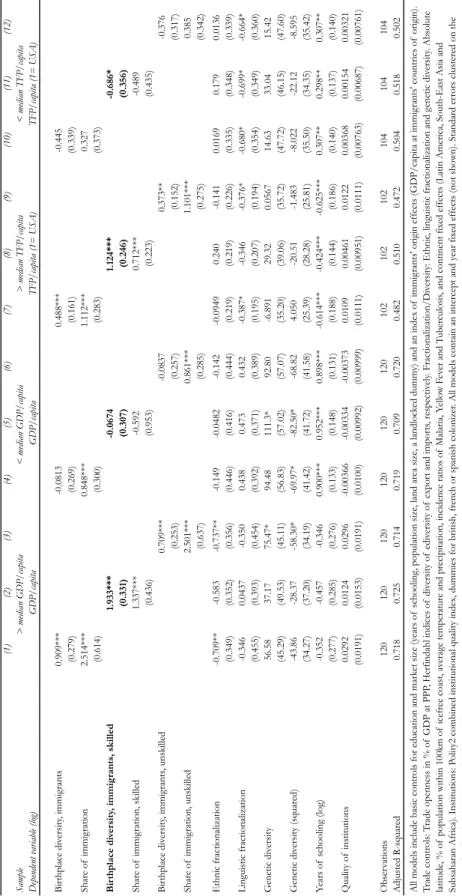
Table 4 shows sub-sample results for rich and poor countries (above or below median GDP/capita in 1990) and high and low productivity countries (above
or below median TFP/capita in 1990). Given our review in Section 2, we
expect birthplace diversity to capture production function complementarities to a higher degree than other diversity indices. We thus have the prior that
we our estimates on Divmig (skilled) should be larger and more significant in
a subset of rich/high productivity economies. This is exactly what we find.
Our estimates for Divmig (skilled) are now magnified by a factor of about 1.3.
In poor/low productivity countries, however, we find no significant relationship
between size (sf), variety of immigrants (DivM ig) and economic development.
2.4.5
Robustness
We present a selection of our robustness checks. The appendix shows more details and provides further robustness exercises.
Patenting activity
We extend our model to patent data in order to shed more light on the
pro-ductivity e§ects of Divmig (see Table 5). We define average patent intensity
as the average number of patent applications per capita filed by country na-tionals and registered by national patent o¢ces. We obtain this data from the World Intellectual Property Organization (2010) for the period 1995-2005 and
construct this measure for 117 countries.28 We apply our baseline model using
all covariates on a year 2000 cross section and find that the diversity of skilled immigrants - much more so than diversity of unskilled immigrants - relates
posi-2 7When Div
mig(unskilled) and Divmig (skilled) are entered jointly, the results for Divmig
(skilled) remain fully robust while those for Divmig (unskilled) turn insignificant (available
upon request).
2 8The sample thus includes all countries with patenting activity as covered by WIPO (2010).
2.4. EMPIRICAL ANALYSIS 25 tively to patenting activity. More precisely, we find that higher skilled birthplace diversity (by +0.01) increases patenting activity by about 2.8 percentage points. These results are even stronger in our subsample of rich countries. We take this as indication that the variety of backgrounds and problem solving heuristics
embedded in Divmig partly works through increased innovation.
Second-generation e§ects
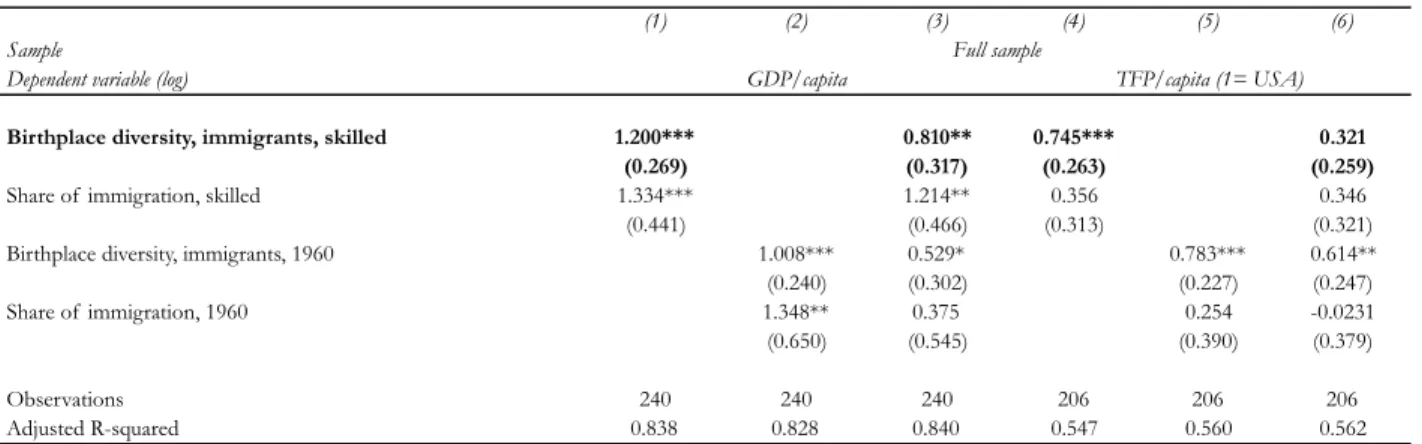
Migration networks make immigration patterns quite time persistent. This
mean that Divmigcould capture much more than the intended first-generation
e§ects. We thus construct a measure of Divmig in 1960 based on data from
Ozden et al. (2011) to obtain a lagged birthplace diversity index.29 We add
this new index as well as the share of immigration in 1960 to our main model (see Table 6). We find that our main results for first-generation birthplace di-versity remain positive but lose significance in the full sample when past and present immigration diversity are entered jointly (both are also highly corre-lated). When restricting the analysis to rich/high TFP countries, we find that today’s diversity for skilled immigration remains positive and highly significant (while past diversity is not). This suggests that skilled diversity’s productive e§ects in high income countries - our main finding - operate primarily through first-generation e§ects. This is fully consistent with the theoretical arguments outlined in Section 2.
Country borders pre-1989
We also address the potential endogeneity in the definition of migrant groups. We, e.g. count Slovaks in the Czech Republic as immigrants, although these people have lived jointly together in the same country, Czechoslovakia, until 1993. We proceed by coding these groups as natives in such cases (other cases include, e.g., former Soviet or Yugoslavian Republics). This results in lower birthplace diversity of the population (driven by the now lower share of foreign-born) but higher diversity of immigration in countries where these "virtual" immigrants have been substantial. Our results remain highly robust as slightly
lower magnitudes but similar statistical significance.30
2 9The Ozden 2011 dataset does not provide a skill dimension.
Children immigrants
We turn to heterogeneity from immigrants’ age at entry. We thus recompute
Divmig(skilled) at di§erent age-of-entry thresholds, using data for a subset of 29
OECD destination countries from Beine, Docquier, Rapoport (2007). Children immigrants are - in terms of education and exposure to the destination country - (arguably) often more native than foreign. These immigrants should thus lower our baseline estimates, with the extent of attenuation increasing in the
number of people migrating before age 25. We thus re-compute our Divmigand
sf measures at di§erent age-of-entry thresholds. This is exactly the pattern
that we find in the data.31 The more people we exclude due to possible
"over-exposure" to the host country, the higher our estimates. We interpret this as further evidence for our proposed channel, production function complementarity
e§ects.32
Emigration and immigration
We conduct a placebo test using emigration in addition to immigration.
Counter-intuitively, the Divmigof skilled immigration and emigration are largely
orthog-onal at -0.05 in our full sample and +0.06 (bilateral correlations) in the rich
country subsample. We add semig and Divemig to our basic model. These
vari-ables impact income and TFP mostly insignificantly, while our main results for
the diversity of immigration remain fully robust.33
Dropping countries that attract most skilled immigrants
Finally, we drop countries that may qualify as outliers in our model. Australia, Canada and New Zealand have points-based immigration systems that select skilled immigrants according to labor market needs. The United States attracts a huge part of all skilled migrants in the world thanks to its large (pre and post tax) premium for skilled labor (Grogger and Hanson, 2011). Controlling for these countries or even dropping them from the sample does not a§ect our
results (available upon request).34
3 1Please refer to the appendix for details.
3 2This pattern would be unlikely if our main e§ects were driven by pure selection e§ects.
3 3Please refer to the appendix for details.