HAL Id: inserm-00130206
https://www.hal.inserm.fr/inserm-00130206
Submitted on 12 Feb 2007
HAL is a multi-disciplinary open access
archive for the deposit and dissemination of sci-entific research documents, whether they are pub-lished or not. The documents may come from teaching and research institutions in France or abroad, or from public or private research centers.
L’archive ouverte pluridisciplinaire HAL, est destinée au dépôt et à la diffusion de documents scientifiques de niveau recherche, publiés ou non, émanant des établissements d’enseignement et de recherche français ou étrangers, des laboratoires publics ou privés.
myeloma cells.
Karène Mahtouk, Dirk Hose, Thierry Rème, John de Vos, Michel Jourdan,
Jérôme Moreaux, Geneviève Fiol, Marc Raab, Eric Jourdan, Véronique Grau,
et al.
To cite this version:
Karène Mahtouk, Dirk Hose, Thierry Rème, John de Vos, Michel Jourdan, et al.. Expression of EGF-family receptors and amphiregulin in multiple myeloma. Amphiregulin is a growth factor for myeloma cells.. Oncogene, Nature Publishing Group, 2005, 24 (21), pp.3512-24. �10.1038/sj.onc.1208536�. �inserm-00130206�
Expression of EGF-family receptors and amphiregulin in multiple myeloma. Amphiregulin is a growth factor for myeloma cells.
Karène Mahtouk1, Dirk Hose2, Thierry Rème1, John De Vos1, Michel Jourdan1, Jerôme Moreaux1, Geneviève Fiol1, Marc Raab2, Eric Jourdan3, Véronique Grau1, Marion Moos2, Hartmut Goldschmidt2, Marion Baudard5, Jean François Rossi5, Friedrich W Cremer2,4, Bernard Klein1
1 INSERM U475 and Unit for Cellular Therapy, CHU Montpellier, Hôpital St Eloi, 34000 Montpellier, France
2 Medizinische Klinik und Poliklinik V, Universitätsklinikum Heidelberg, INF410, 69115 Heidelberg, Germany
3 Internal Medecine Department B, CHU Nîmes, 30900 Nîmes, France. 4 Institut für Humangenetik, Universitätsklinikum Heidelberg, INF 366, 69120
Heidelberg, Germany
5 Clinical Hematology Department, CHU Montpellier, Hôpital Lapeyronie, 34000 Montpellier, France
Corresponding Author: Pr. Bernard Klein, INSERM U475, 99 Rue Puech Villa, 34197 Montpellier, France. Tel: +33(0)4 67 33 78 88. klein@montp.inserm.fr
Key words: amphiregulin, myeloma, EGF receptor, Running title: EGF family in multiple myeloma
Abstract.
A hallmark of plasma cells is the expression of syndecan-1, which has major functions in epithelial cells, in particular as the coreceptor of heparin-binding growth factors. We previously found that heparin-binding epidermal growth factor-like growth factor (HB-EGF) is a growth factor for malignant plasma cells. As amphiregulin (AREG) is another heparin-binding factor of the EGF family, we investigated its role in multiple myeloma. Using Affymetrix DNA microarrays, we show here that the
AREG gene was expressed by purified primary myeloma cells from 65 patients and
that the expression was higher than in normal bone marrow plasma cells or plasmablastic cells. AREG stimulated IL-6 production and growth of bone marrow stromal cells. Using real-time RT-PCR, we found that MM cells expressed ErbB receptors and that AREG promoted their growth. Furthermore, PD169540 (a pan-ErbB inhibitor) and IRESSA (an ErbB1-specific inhibitor) induced apoptosis of primary myeloma cells from 10/14 and 4/14 patients, respectively, and there was a synergistic effect with dexamethasone. Altogether, our data provide strong evidence that AREG plays an important role in the biology of multiple myeloma and emphasize the advantages of using ErbB inhibitors, which might target myeloma cells as well as the tumor environment.
Introduction
Multiple myeloma (MM) is a B cell neoplasia characterized by the accumulation of clonal malignant plasma cells in the bone marrow. In the majority of patients, malignant plasma cells require mediators delivered by the tumor environment to survive and proliferate. Interleukin-6 (IL-6) is one of these factors produced by the bone marrow environment (Kawano et al., 1988; Klein et al., 1989) but cannot alone promote the survival of myeloma cells from patients with intramedullary myeloma (Gu et al., 2000). Thus, additional factors produced by the tumor environment are necessary to promote the survival of primary myeloma cells, together with IL-6 (Klein et al., 2003). A hallmark of plasma cells is the expression of the heparan-sulfate proteoglycan (HSPG) syndecan-1 (CD138), which is induced during the differentiation of B cells into plasma cells (Costes et al., 1999). In epithelial cells, syndecan-1 plays a major biological role as a coreceptor for heparin-binding growth factors and chemokines (Couchman, 2003; Rapraeger, 2000). This underscores that heparin-binding growth factors are involved in the biology of normal or malignant plasma cells. We recently found that one of the members of the epidermal growth factor (EGF) family, HB-EGF, is produced by some myeloma cell lines and is a potent growth factor for myeloma cells that express HB-EGF receptors (Mahtouk et al., 2004; Wang et al., 2002). HB-EGF is one of the 10 members of the EGF-related growth factors that include EGF, transforming growth factor-α (TGF-α), amphiregulin (AREG), HB-EGF, betacellulin, epiregulin, and the four neuregulins 1–4 (Harris et al., 2003). Both HB-EGF and AREG have a heparin-binding domain (Inui et al., 1997; Nylander et al., 1998). This family binds to and induces the homo- or heterodimerization of three receptors: the EGF receptor ErbB1, ErbB3 and
ErbB4. ErbB2 is a fourth member unable to bind EGF ligands. It is the preferred heterodimerization partner for all other ErbB members and contributes to the potentiation of ErbB receptor signaling (Holbro et al., 2003). Interestingly,
AREG was recently highlighted in two studies on myeloma cells. Claudio et al.
constructed a cDNA library of primary malignant plasma cells and identified several growth factors and cytokines by 5'-sequencing, including AREG (Claudio et al., 2002). In an independent study using HuGeneFL Affymetrix microarrays, Zhan et al. reported AREG to be one of the 25 genes with “spiked” expression in a subset of MM cells from newly diagnosed patients (Zhan et al., 2002). Thus, given the important role of HB-EGF as a myeloma cell growth factor, we investigated the production and biological function of AREG in multiple myeloma.
In this study, we show that purified primary myeloma cells overexpressed AREG compared to normal plasmablastic cells. In addition, AREG was overexpressed in the myeloma cells of a subset of patients compared to normal plasma cells. AREG stimulated the growth and IL-6 production of bone marrow stromal cells (BMSCs) and was able to stimulate MM cell growth. PD169540, a pan-ErbB kinase inhibitor, and IRESSA, an ErbB1-specific kinase inhibitor, each induced primary myeloma cell apoptosis in short-term culture for 5 days, alone or in combination with dexamethasone. These findings provide the framework for future clinical trials with specific ErbB receptor inhibitors, targeting both tumor cells and their microenvironment.
.
Results
Gene expression of AREG and HB-EGF by DNA microarrays and real-time
RT-PCR.
Gene expression profiling (GEP) was performed on seven normal plasmablastic cell (PPC) samples, seven normal bone marrow plasma cell (BMPC) samples, purified malignant plasma cells from 72 patients—seven with MGUS and 65 with MM—and 20 human myeloma cell lines (HMCLs) with Affymetrix U133A+B microarrays. Data for
AREG expression are shown in Figure 1A. AREG was a “present” gene (using
Affymetrix call) in myeloma cells of all 65 patients or in all seven BMPC samples, and an “absent” gene in all seven PPC samples. The median AREG expression in primary myeloma cells (median value = 251) was 2.5- and 15-fold higher than that in BMPCs (median value = 97, P = .039) or PPCs (median value = 16, P < 10–4), respectively. It was very high in some primary myeloma cell samples (Figure 1A). No significant difference in AREG expression was found between patients with Durie-Salmon stage I, II or III MM (Figure 1A). Median AREG expression was also significantly increased in plasma cells from patients with MGUS (median value = 154) compared to PPCs (P = .001) or BMPCs (P = .039). HMCLs did not express or weakly expressed AREG (median expression value = 9). AREG expression was also investigated using real-time RT-PCR in selected samples. Primary myeloma cells and BMPCs expressed AREG (respectively, five- and eightfold less than the A431 carcinoma cell line known to produce EGF-family ligands, which was assigned the arbitrary value of 100), whereas
AREG expression was undetectable in HMCLs or PPCs, validating the Affymetrix data
(Figure 2A).
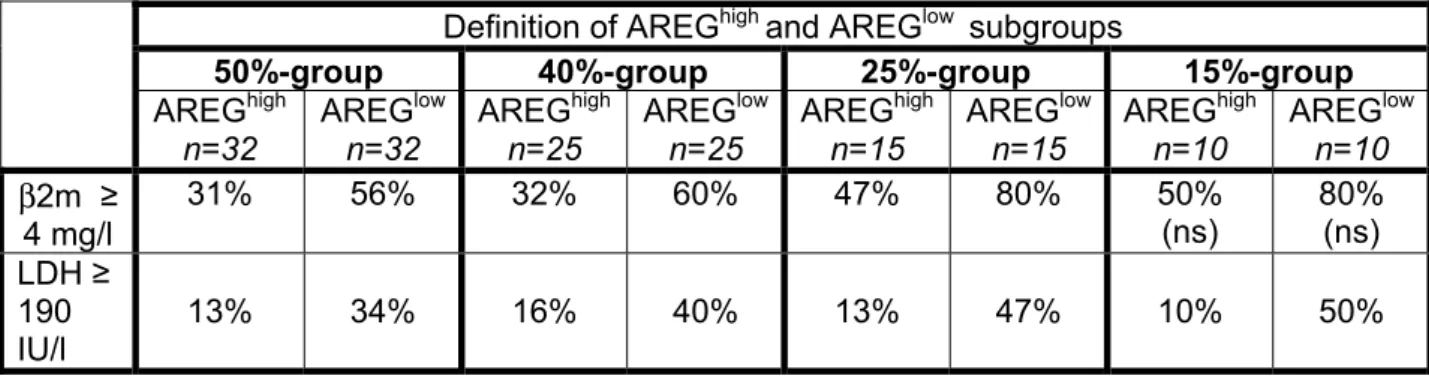
To look for a link between AREG expression and clinical parameters, the 65 patients with MM were classified into two groups: patients with a low or high AREG expression in
myeloma cells (AREGlow or AREGhigh), assayed with Affymetrix microarrays. To find the best way to delimit AREGlow and AREGhigh groups, we considered subgroups defined by 50%, 40%, 25% or 15% of the patients with the highest or lowest AREG expression in myeloma cells (Table 1). The AREGlow groups included a higher frequency of patients with lactate dehydrogenase ≥ 190 IU/l and with beta-2 microglobulin (β2m) ≥ 4 mg/l, except for the 15%-group in which the β2m levels between AREGhigh and AREGlow were not statistically different. No significant difference was found for the other clinical parameters (CRP, albumin, serum calcium, hemoglobin, age), cytogenetic abnormalities or Durie-Salmon staging (results not shown).
The HB-EGF gene showed a different expression pattern from AREG. It was weakly expressed by primary myeloma cells, BMPCs and PPCs, with a median value of 31, 50, and 22, respectively, but was more highly expressed by six out of 20 myeloma cell lines (XG-1, XG-3, XG-4, XG-7, XG-13, and XG-20; see Figure 1B), with a signal varying from 81 to 166. HB-EGF expression in certain HMCLs was confirmed by real-time RT-PCR (Figure 2A) and was in agreement with our previous RT-PCR data (Mahtouk et al., 2004). In addition, we found that the bone marrow environment (BM) of patients with MM highly expressed AREG, with a relative expression level from 20 to 145, as well as HB-EGF with a relative expression level from 2 to 31 (Figure 2B). It is noteworthy that bone marrow stromal cells (BMSCs) derived from MM patients poorly expressed AREG but highly expressed HB-EGF (Figure 2B). One putative explanation for the lack of AREG expression in HMCLs, as opposed to primary myeloma cells, is that the bone marrow tumor environment might trigger AREG expression in primary myeloma cells. In order to test this hypothesis, three GFP-transduced HMCLs were cocultured with bone marrow cells from patients with MM, and GFP-HMCLs were sorted. AREG expression could not be induced in the three
myeloma cell lines by bone marrow cells of patients with MM (results not shown). Prostaglandin E2 (PGE2), known to induce AREG expression in epithelial cancers (Shao et al., 2003), was also unable to induce AREG expression in four HMCLs (results not shown).
Gene expression of ErbB receptors in myeloma cells and bone marrow
environment cells.
AREG preferentially binds to ErbB1, in the form of ErbB1/ErbB1 homodimers or ErbB1/ErbB2 heterodimers (Holbro et al., 2003). As Affymetrix probesets were not sensitive enough for ErbB receptors detection (“absent Affymetrix call” in the majority of myeloma cell samples), we used real-time RT-PCR to study their expression in purified primary myeloma cells from 21 patients with MM, 17 HMCLs, seven PPC samples, three BMPC samples, bone marrow mononuclear cells devoid of myeloma cells from seven patients with MM, and BMSCs derived from four patients. ErbB expression in each sample was normalized to that of β2m and compared to the
expression in the XG-7 HMCL, which expresses the four ErbB receptors (Mahtouk et al., 2004). The XG-7 HMCL was assigned the arbitrary value of 100. Purified primary myeloma cells from 16 of 21 patients and seven of 17 HMCLs expressed ErbB1 mRNA (relative expression level ranging from 0.5 to 236). BMPCs also expressed ErbB1, unlike PPCs (Figure 3A). ErbB2 was variably expressed in 19 of 21 primary myeloma cells, 13 of 17 HMCLs and three out of three BMPCs, but was undetectable in six out of seven normal PPCs (Figure 3B). Fourteen of 17 HMCLs expressed
ErbB3 mRNA, whereas it was not expressed or weakly expressed in primary
myeloma cells, PPCs, and BMPCs (Figure 3C). Finally, nine of 17 HMCLs expressed
ErbB4. Purified primary myeloma cells from 14 out of 21 patients expressed ErbB4 at
a lower level than HMCLs, except for two patients whose myeloma cells highly
expressed ErbB4 (relative expression level of 684 and 4734). PPCs and BMPCs did not express ErbB4 (Figure 3D).
Bone marrow mononuclear cells from six of the seven MM patients, which were depleted of myeloma cells, expressed ErbB1, ErbB2, but not ErbB3 and ErbB4, at similar levels as those in primary myeloma cells or BMPCs (Figure 4A). Interestingly, all four BMSCs expressed very high levels of ErbB1, ErbB2 (on the average 250- and 200-fold higher, respectively, than 7 cells) and ErbB3 (three-fold higher than XG-7 cells), but not ErbB4 (Figure 4B).
AREG promotes stromal cell growth and IL-6 production by BMSCs.
As BMSCs strongly expressed ErbB1 and ErbB2, we investigated whether AREG could stimulate their growth. These cells were cultured at low serum concentration (5% FCS) in order to limit the concentration of EGF members present in FCS. As shown in Figure 5A, AREG dramatically promoted the growth of all three BMSCs derived from patients with MM (fivefold for BMSC1, sixfold for BMSC2 and twofold for BMSC3 after 3 weeks of culture, P < .01). IRESSA (1 µM), an ErbB1-specific inhibitor (Manegold, 2003), abrogated the AREG effect. In addition, AREG induced a slight but significant increase in IL-6 secretion by two BMSCs in five separate experiments: BMSC1 (2.5-fold, P = .0001) and BMSC2 (1.5-fold, P = .02) (Figure 5B). IRESSA did not affect the spontaneous IL-6 production by BMSCs but abolished the stimulatory effect of AREG (P = .0047 and P = .01, respectively). Real-time RT-PCR showed an increase in IL-6 transcripts after AREG exposure, which was abrogated by IRESSA. These results indicate that the AREG-induced stimulation of IL-6 occurred at the mRNA level (Figure 5C).
AREG is a myeloma cell growth factor.
Similar to HB-EGF, AREG is able to bind cell-associated HSPGs and the CD9 tetraspanin (Harris et al., 2003; Inui et al., 1997; Sakuma et al., 1997). The association with these molecules facilitates binding to ErbB receptors (Boucheix & Rubinstein, 2001; Rapraeger, 2000). Using Affymetrix U133 A+B microarrays, we confirmed that the HSPG syndecan-1 was expressed by all myeloma cells and normal BMPCs, but not by PPCs, as was expected (Tarte et al., 2000) (Figure 6A). CD9 was expressed (“present” call) by 71% of primary myeloma cell samples (median expression value = 264), with a very high expression in some samples, and by 65% of HMCLs (median expression value = 397). It was also expressed by 100% of BMPCs (median expression value = 469) and 71% of PPCs (median expression value = 100) (Figure 6B). It should be noted that there was a good correlation (r = 0.88; P < .05) between Affymetrix CD9 expression and CD9 protein levels assayed by FACS on HMCLs (Figure 6C).
Because of ErbB1, ErbB2, and coreceptors expression in some myeloma cell lines, we next investigated whether AREG could stimulate their growth. Data shown in Figure 7A illustrate that with a low concentration of IL-6, AREG was a potent myeloma cell growth factor for XG-1 and XG-7 HMCLs. No effect was found without adding exogenous IL-6. A significant effect was found with 100 ng/ml of AREG and a maximum effect with 1000 ng/ml (results not shown). XG-7 expressed ErbB1 (Figure 3A) and accordingly, the stimulatory effect of AREG was abrogated by IRESSA or AG1478 ErbB1 inhibitors (1 µM) and by the PD169540 pan-ErbB inhibitor (1 µM) (Figure 7B). No synergistic inhibition was found when the two inhibitors were used at suboptimal concentrations (results not shown). Surprisingly, AREG was also able to promote the proliferation of XG-1 cells that did not express ErbB1, but expressed
ErbB4 and ErbB3 (Figure 3C, D). In agreement with this, the stimulatory effect of
AREG on XG-1 cells was not affected by IRESSA or AG1478 ErbB1 inhibitors but was inhibited by the pan-ErbB inhibitor PD169540 (Figure 7B). We checked that AREG did not induce ErbB1 expression in XG-1 cells with real-time RT-PCR (Figure 7C). These data imply that AREG may promote myeloma cell growth through ErbB1-independent pathways, probably via ErbB3 and/or ErbB4.
The ErbB inhibitors PD169540 and IRESSA inhibit the survival of primary
myeloma cells.
We investigated the effect of ErbB inhibitors on the survival of primary myeloma cells from 14 patients with intramedullary myeloma. Myeloma cells were not purified because they die within 1 day after removal from the bone marrow environment, as reported (Gu et al., 2000). Data from the 14 patients are summarized in Table 2. The pan-ErbB inhibitor PD169540 significantly reduced the number of viable myeloma cells in 10 of 14 patients (median reduction = 43%, P < .001, Table 2A). Interestingly, in combination with dexamethasone (DEX), myeloma cells were almost completely eliminated (92% reduction in the number of viable myeloma cells with DEX + PD169540 versus 31% reduction with DEX alone, P < .001, Table 2A). As illustrated in Figure 8A for patient 1, the inhibitor specifically killed myeloma cells and did not affect cells from the tumor bone marrow environment. IRESSA was active in four out of 14 patients (55% reduction in the number of viable myeloma cells, P < .001), shown in Table 2B. Again, the addition of an ErbB-inhibitor potentiated the apoptotic effect of DEX (69% reduction in the number of viable myeloma cells with DEX + IRESSA versus 31% reduction with DEX alone, P = .001, Table 2B). AREG protein was detected in the culture supernatants of bone marrow cells of 12 patients with MM (median value, 26 pg/ml) and in the bone marrow plasma of 15 patients with MM
(median value, 15 pg/ml) (Figure 8B). High AREG concentrations (median value, 761 pg/ml) were also found in the myelomatous pleural effusions of four patients.
Discussion.
We show here that primary myeloma cells overexpressed the AREG gene compared to normal plasmablastic cells. Although AREG expression was very high in some MM samples, it was expressed in 65 of 65 patients’ myeloma cells with a continuous log normal distribution. Thus, we did not confirm the observation of Zhan et al., who previously mentioned that AREG was a “spike” gene, i.e., a gene with a low to undetectable expression in the majority of patients or normal samples and highly overexpressed in a subset of MM samples (Zhan et al., 2002). AREG was also highly expressed in normal bone marrow plasma cells compared to normal plasmablastic cells and this suggests that AREG expression is likely a feature of mature plasma cell differentiation.
We found that the percentage of patients with β2m > 4 mg/l or LDH > 190 IU/l was higher in the groups of patients with the lowest AREG expression level. Thus, patients with the lowest AREG expression might have a poor prognosis but the clinical follow-up of the patients was too short at the time of this study to look for a difference in event-free or overall survival. Primary myeloma cells did not express the
HB-EGF gene, another EGF family member able to bind HSPGs (Iwamoto &
Mekada, 2000), in agreement with our previous RT-PCR results (Mahtouk et al., 2004). It should be noted that myeloma cell lines had a contrary pattern. Six out of 20 cell lines highly expressed HB-EGF but none of them expressed AREG. Several explanations can account for this striking difference. One is that myeloma cell lines are obtained from a minority of patients with extramedullary proliferation who behave differently regarding AREG and HB-EGF expression compared to the majority of patients with intramedullary MM. Another explanation is that there are components in the tumor milieu in vivo that are not produced in vitro that can trigger AREG
expression. High AREG concentrations were detected in the myelomatous pleural effusions from four patients. According to our previous data with IL-6 (Lu et al., 1995a), the diffusion of growth factors is more restricted in pleural effusion and is likely a good indication of their local concentration, close to the tumor environment in vivo. AREG was also detected in bone marrow sera of patients with MM at lower concentrations.
We also determined the expression of ErbB receptors on myeloma cells and normal plasma cells. Our present data show that ErbB expression by myeloma cells is a frequent feature. In particular, we found ErbB3 expression in 14 out of 17 HMCLs, which is greater than what Walters et al. reported in detecting ErbB3 expression in one out of five HMCLs (Walters et al., 2003). Until now, the involvement of the receptors in normal plasma cells was unknown. We show here that bone marrow mature plasma cells (BMPCs) expressed ErbB1 and ErbB2, unlike polyclonal early plasmablastic cells. These data indicate that ErbB1 and ErbB2 are induced throughout normal plasma cell differentiation. We were not able to detect
ErbB3/ErbB4 mRNA in BMPCs. One hypothesis is that they are not induced in late
plasma cells. However, it is noteworthy that ErbB3 is expressed in three of 21 patients only and ErbB4 in 62% of patients (13/21), suggesting that it would be necessary to investigate additional normal BMPCs. This was not possible in the current study because plasma cells are rare bone marrow cells (0.25%), and it was very difficult to obtain enough bone marrow from healthy individuals to purify them. Our findings suggest that AREG has a dual effect that sustains tumor growth in vivo. Firstly, it may be a paracrine mediator supporting myeloma cell growth through the stimulation of the stromal cell compartment, in particular BMSC proliferation and IL-6 production. Secondly, it may be an autocrine growth factor for myeloma cells.
Surprisingly, we found that amphiregulin was able to induce XG-1 myeloma cell growth through an ErbB1-independent mechanism, probably via ErbB2/ErbB3 or ErbB2/ErbB4 complexes. This is attractive because AREG is known to be an ErbB1 ligand and it is generally accepted that it does not bind other ErbB members. Accordingly, two studies reported that the ability of ErbB receptors to mediate signal transduction through EGF-like ligands is broader than has been assumed. In murine 32D cells transfected with ErbB4 and ErbB2, Wang et al. reported that EGF and TGF-α, known to specifically bind ErbB1, can also activate ErbB2/ErbB4 complexes and induce proliferation and/or adhesion (Wang et al., 1998). Alimandi et al. showed that betacellulin (known to bind ErbB1 and ErbB4) was able to bind ErbB2/ErbB3 complexes (Alimandi et al., 1997). In a previous study, we showed that ErbB activation by HB-EGF in myeloma cells induced activation of the PI-3 kinase/AKT pathway, unlike MAP kinase or JAK/STAT pathways. HB-EGF-induced proliferation was blocked by a PI-3 kinase inhibitor (LY294002) (Mahtouk et al., 2004). Likewise, AREG-induced proliferation was inhibited by LY294002 (unpublished results) indicating that the PI-3 kinase/AKT pathway is critical to triggering the myeloma cell growth activity of AREG.
We show that the PD169540 pan-ErbB inhibitor and the IRESSA ErbB1-inhibitor induced MM cell apoptosis in 71% and 29% of patients, respectively. We found dramatic myeloma cell apoptosis when PD169540 or IRESSA were used with dexamethasone while non-myeloma cells were unaffected. The ErbB inhibitors likely block ErbB activation on primary myeloma cells, as they did with human myeloma cell lines. They might also target the bone marrow environment. We could not directly investigate this because purified primary myeloma cells cannot be maintained in short-term culture and apoptose as soon as they are removed from their bone
marrow environment (Gu et al., 2000). These data indicate that ErbB activation is critical to triggering primary myeloma-cell survival in short-term culture. AREG was detected in culture supernatants of bone marrow cells from patients with MM, indicating that AREG must be, at least in part, responsible for ErbB activation in primary myeloma cells. HB-EGF could also be involved since it is produced by the tumor environment (Mahtouk et al., 2004). HB-EGF production in the culture supernatants could not be evaluated because no ELISA was commercially available. We tried to determine the relative contribution of HB-EGF and AREG with neutralizing antibodies against AREG or HB-EGF. However, these antibodies had no effect, either used alone or in combination (data not shown). One explanation is that it is difficult to neutralize the biding of an autocrine cytokine, as was already found for autocrine IL-6 in myeloma cells (Jourdan et al., 1991). An inhibitor targeting the receptor directly, in particular the kinase activity, is far more efficient.
ErbB expression on myeloma cells is weak compared to those of bone marrow stromal cells, and we previously reported that ErbB proteins could be detected only by immunoprecipitation in some cell lines (Mahtouk et al., 2004). Thus ErbB receptors, even when expressed at low levels, can play an important role in the biology of myeloma and therefore be considered a potential therapeutic target. One explanation is that myeloma cells express two HB-EGF/AREG coreceptors — syndecan-1 and CD9 — which might increase the mitogenic actions of the EGF-ligands, stabilizing their interactions with the ErbB receptors. A second explanation could be a synergistic cooperation between ErbB receptors and gp130 IL-6 transducer signaling pathways. We have shown that HB-EGF and AREG both require low IL-6 concentrations to be able to trigger myeloma cell growth. In agreement with this observation, it is now becoming clear that ErbB receptors function as signal
integrators cross-regulating different classes of receptors (Hynes et al., 2001), in particular the IL-6 transducer gp130 (Badache & Hynes, 2001; Qiu et al., 1998). A last possible explanation might be the presence of mutations in the kinase domain of ErbB1 in responder patients, as it was recently demonstrated in non-small lung cancer cells (Lynch et al., 2004; Paez et al., 2004). These mutations enhanced tyrosine kinase activity in response to EGF and increased the sensitivity to inhibition by IRESSA. As we found a major role of AREG or HB-EGF in triggering myeloma cell survival and a strong effect of ErbB inhibitors despite weak ErbB expression, it might be interesting to look for such mutations in ErbB1 or ErbB4 in myeloma cells of certain patients.
In conclusion, our data provide strong evidence for a major role of AREG in multiple myeloma stimulating both plasma cells and BMSCs. These data emphasize the advantage of using ErbB inhibitors in myeloma, alone or in combination with dexamethasone or anti-IL-6 monoclonal antibody (Trikha et al., 2003), to improve the patients’ outcome by targeting the MM cells as well as the bone marrow microenvironment.
Materials and Methods
Primary cells and polyclonal plasmablasts
Malignant plasma cells were purified from 7 patients with MGUS and 65 myeloma patients at diagnosis (median age, 59 years) after informed consent was given. According to Durie-Salmon classification, 12 patients were at stage IA, 12 at stage IIA, 38 at stage IIIA, and three at stage IIIB. Normal bone marrow plasma cells (BMPCs) were obtained from healthy donors after informed consent was given. Plasma cells were purified with anti-CD138 MACS microbeads (Miltenyi-Biotec, Paris, France). Sera from 15 patients with MM and myelomatous pleural effusions from patients were collected as described previously (Lu et al., 1995b). Polyclonal plasmablasts (PPCs) were generated in vitro from purified CD19+ peripheral blood B cells as previously described (Tarte et al., 2000). Bone marrow mononuclear cells from seven patients were obtained by removing myeloma cells with CD138 Milteny microbeads. Bone marrow stromal cells (BMSCs) were obtained from patients with MM as previously described (Mahtouk et al., 2004). Before use, BMSC populations were phenotyped by flow cytometry (cells were negative for CD34 and CD45 and positive for CD90, CD105 and CD73).
Reagents
Recombinant amphiregulin and interleukins were purchased from R&D Systems (Minneapolis, MN), interleukin-6 (IL-6) from Abcys SA (Paris, France) and AG1478 inhibitor from Alexis Biochemicals (San Diego, CA). PD169540 (pan-ErbB inhibitor) was a generous gift from Pfizer Global Research and Development (Ann Arbor, MI), IRESSA from Astrazeneca (Cheshire, UK) and the B-E8 anti-IL-6 MoAb from J. Wijdenes (Diaclone, Besançon, France).
Myeloma cell lines
Fifteen human myeloma cell lines (HMCLs) were obtained in our laboratory (Rebouissou et al., 1998; Zhang et al., 1994). Twelve are IL-6-dependent myeloma cell lines (1, 2, 3, 4, 6, 7, 10, 13, 14, 16, XG-19, XG-20). Upon removal of IL-6, myeloma cells progressively apoptose within 10– 14 days (Gu et al., 2000; Jourdan et al., 2000). Three grow autonomously (5, XG-11, XG-12). L363, U266, RPMI8226, LP1 and OPM2 cell lines were purchased from ATCC (Rockville, MD). The HMCLs were routinely maintained in RPMI1640, 10% fetal calf serum, and for the IL-6-dependent cell lines, 2 ng/ml of IL-6.
Microarray hybridization
RNA was extracted using the RNeasy Kit (Quiagen, Hilden, Germany), the SV-total RNA extraction kit (Promega, Mannheim, Germany) and Trizol (Invitrogen, Karlsruhe, Germany) in accordance with the manufacturer’s instructions. Biotinylated complementary RNA (cRNA) was amplified with a double in-vitro transcription, according to the Affymetrix small sample labeling protocol. The biotinylated cRNA was fragmented and hybridized to the human U133 A and B GeneChip microarrays according to the manufacturer’s instructions (Affymetrix, Santa Clara, CA). Fluorescence intensities were quantified and analyzed using the GECOS software (Affymetrix). Arrays were scaled to an average intensity of 100. A threshold of 1 was assigned to values under 1.
Real-time reverse transcriptase-polymerase chain reaction
RNA was extracted using the RNeasy Kit (Qiagen, Valencia, CA). We generated cDNA from 2 µg of total RNA using the Superscript II reverse transcriptase (Life Technologies) and oligo d(T)12-18 (Amersham Pharmacia Biotech, Orsay, France) as primer. For real-time RT-PCR, we used the assay-on-demand primers and probes
and the TaqMan Universal Master Mix from Applied Biosystems (Courtaboeuf, France) according to the manufacturer’s instructions. Gene expression was measured using the ABI Prism 7000 Sequence Detection System. For comparative analysis of gene expression, data were obtained by using the ∆∆Ct method derived from a mathematical elaboration previously described. For each sample, the CT value for the gene of interest was determined, normalized to its respective CT value for β2m (∆CT = CT – CT β2m) and compared to A431 (for AREG and HB-EGF) or XG-7
cells (for ErbB receptor genes) used as positive control. The formula used was: ½∆CT sample - ∆CT control cell line. Ct values were collected during the log phase of the cycle.
The results were expressed as the relative mRNA levels to control cell line mRNA.
Myeloma cell proliferation assay
Cells were cultured for 5–7 days in 96-well flat-bottomed microtiter plates at 104 cells/well in 100 µl of RPMI 1640 culture medium and 5% fetal calf serum (FCS). Various concentrations of growth factors or inhibitors of growth factor were added at the beginning of the culture in six culture wells per group. At the end of the culture, cells were pulsed with tritiated thymidine (Amersham Pharmacia Biotech, Orsay, France) for 12 h, harvested and counted as reported previously (De Vos et al., 2001).
Bone marrow stomal cell growth and IL-6 production
Bone marrow stromal cells from three different patients were cultured in six-well plates at 4×10⁴ cells/ml, in 2 ml of DMEM culture medium at low serum concentration (5% FCS) to limit cell growth. Every 5–7 days, cells were counted in trypan blue and plated again at 4×10⁴ cells/ml. The IL-6 production by BMSCs was assayed as described (Uchiyama et al., 1993). Briefly, confluent BMSCs were starved in DMEM and 1% FCS for 24 h. Cells were washed and incubated for 48 h in DMEM and 1% FCS with AREG, with or without IRESSA. The culture supernatant was recovered at
the end of the culture and assayed for IL-6 by ELISA (Beckman-Coulter, Marseilles, France).
Short-term culture of primary myeloma cells
Mononuclear cells from patients with MM were cultured for 5 days at 5 × 10⁵ cells/ml in RPMI 1640 medium, 5% FCS, 1 ng/ml IL-6, without (control) or with the PD169540 pan-ErbB inhibitor (1 µM), or the IRESSA ErbB1 inhibitor (1 µM), or 10–6 M dexamethasone (DEX) used alone or in combination. In each culture group, the number of viable myeloma cells was determined by trypan blue staining, and myeloma cells were stained with anti-CD138-PE MoAb (Beckman-Coulter, Marseilles, France). At day 5 of culture, supernatants were collected to determine the amount of AREG by ELISA.
ELISA
AREG concentrations were determined with an ELISA purchased from R&D Systems (Minneapolis, MN). The peroxidase reaction was performed with a tetramethylbenzidine (TMB) substrate kit (Sigma, St Louis, MO). Light absorbance was measured at 450 nm. The sensitivity of the ELISA was 5 pg/ml.
Statistical analysis
GEPs were analyzed with our bioinformatics platform (RAGE, remote analysis of microarray gene expression) designed by T. Reme (INSERM U475, Montpellier, France). Statistical comparisons were made with the nonparametric Mann-Whitney test, the chi-square test, the Student t-test for pairs or the Wilcoxon test for pairs.
Acknowledgements
This work was supported by grants from the Ligue Nationale Contre le Cancer (équipe labellisée), Paris, France, and from the Association Guillaume Espoir, St Genis Laval, France.
References.
Alimandi, M., Wang, L.M., Bottaro, D., Lee, C.C., Kuo, A., Frankel, M., Fedi, P., Tang, C., Lippman, M. & Pierce, J.H. (1997). Embo J, 16, 5608-17.
Badache, A. & Hynes, N.E. (2001). Cancer Res, 61, 383-91.
Boucheix, C. & Rubinstein, E. (2001). Cell Mol Life Sci, 58, 1189-205.
Claudio, J.O., Masih-Khan, E., Tang, H., Goncalves, J., Voralia, M., Li, Z.H.,
Nadeem, V., Cukerman, E., Francisco-Pabalan, O., Liew, C.C., Woodgett, J.R. & Stewart, A.K. (2002). Blood, 100, 2175-86.
Costes, V., Magen, V., Legouffe, E., Durand, L., Baldet, P., Rossi, J.F., Klein, B. & Brochier, J. (1999). Hum Pathol, 30, 1405-11.
Couchman, J.R. (2003). Nat Rev Mol Cell Biol, 4, 926-37.
De Vos, J., Couderc, G., Tarte, K., Jourdan, M., Requirand, G., Delteil, M.C., Rossi, J.F., Mechti, N. & Klein, B. (2001). Blood, 98, 771-780.
Gu, Z.J., De Vos, J., Rebouissou, C., Jourdan, M., Zhang, X.G., Rossi, J.F., Wijdenes, J. & Klein, B. (2000). Leukemia, 14, 188-97.
Harris, R.C., Chung, E. & Coffey, R.J. (2003). Exp Cell Res, 284, 2-13. Holbro, T., Civenni, G. & Hynes, N.E. (2003). Exp Cell Res, 284, 99-110.
Hynes, N.E., Horsch, K., Olayioye, M.A. & Badache, A. (2001). Endocr Relat Cancer,
8, 151-9.
Inui, S., Higashiyama, S., Hashimoto, K., Higashiyama, M., Yoshikawa, K. & Taniguchi, N. (1997). J Cell Physiol, 171, 291-8.
Iwamoto, R. & Mekada, E. (2000). Cytokine Growth Factor Rev, 11, 335-344.
Jourdan, M., De Vos, J., Mechti, N. & Klein, B. (2000). Cell Death and Differentiation,
7, 1244-1252.
Jourdan, M., Zhang, X.G., Portier, M., Boiron, J.M., Bataille, R. & Klein, B. (1991).
147, 4402-4407.
Kawano, M., Hirano, T., Matsuda, T., Taga, T., Horii, Y., Iwato, K., Asaoka, H., Tang, B., Tanabe, O., Tanaka, H., Kuramoto, A. & Kishimoto, T. (1988). 332, 83-85. Klein, B., Tarte, K., Jourdan, M., Mathouk, K., Moreaux, J., Jourdan, E., Legouffe, E.,
De Vos, J. & Rossi, J.F. (2003). Int J Hematol, 78, 106-13.
Klein, B., Zhang, X.G., Jourdan, M., Content, J., Houssiau, F., Aarden, L., Piechaczyk, M. & Bataille, R. (1989). Blood, 73, 517-526.
Lu, Z.Y., Brailly, H., Wijdenes, J., Bataille, R., Rossi, J.F. & Klein, B. (1995a). Blood,
86, 3123-3131.
Lu, Z.Y., Zhang, X.G., Rodriguez, C., Wijdenes, J., Gu, Z.J., Morel-Fournier, B., Harousseau, J.L., Bataille, R., Rossi, J.F. & Klein, B. (1995b). Blood, 85, 2521-2527.
Lynch, T.J., Bell, D.W., Sordella, R., Gurubhagavatula, S., Okimoto, R.A., Brannigan, B.W., Harris, P.L., Haserlat, S.M., Supko, J.G., Haluska, F.G., Louis, D.N., Christiani, D.C., Settleman, J. & Haber, D.A. (2004). N Engl J Med, 350, 2129-39.
Mahtouk, K., Jourdan, M., De Vos, J., Hertogh, C., Fiol, G., Jourdan, E., Rossi, J.F. & Klein, B. (2004). Blood, 103, 1829-37.
Manegold, C. (2003). Adv Exp Med Biol, 532, 247-52.
Nylander, N., Smith, L.T., Underwood, R.A. & Piepkorn, M. (1998). In Vitro Cell Dev
Biol Anim, 34, 182-8.
Paez, J.G., Janne, P.A., Lee, J.C., Tracy, S., Greulich, H., Gabriel, S., Herman, P., Kaye, F.J., Lindeman, N., Boggon, T.J., Naoki, K., Sasaki, H., Fujii, Y., Eck, M.J., Sellers, W.R., Johnson, B.E. & Meyerson, M. (2004). Science, 304, 1497-500.
Qiu, Y., Ravi, L. & Kung, H.J. (1998). Nature, 393, 83-5. Rapraeger, A.C. (2000). J Cell Biol, 149, 995-8.
Rebouissou, C., Wijdenes, J., Autissier, P., Tarte, K., Costes, V., Liautard, J., Rossi, J.F., Brochier, J. & Klein, B. (1998). Blood, 91, 4727-4737.
Sakuma, T., Higashiyama, S., Hosoe, S., Hayashi, S. & Taniguchi, N. (1997). J
Biochem (Tokyo), 122, 474-80.
Shao, J., Lee, S.B., Guo, H., Evers, B.M. & Sheng, H. (2003). Cancer Res, 63, 5218-23.
Tarte, K., Fiol, G., Legouffe, E., Rossi, J.F. & Klein, B. (2000). Blood, 96, 514a. Trikha, M., Corringham, R., Klein, B. & Rossi, J.F. (2003). Clin Cancer Res, 9,
4653-65.
Uchiyama, H., Barut, B.A., Mohrbacher, A.F., Chauhan, D. & Anderson, K.C. (1993).
Blood, 82, 3712-3720.
Walters, D., French, J., Arendt, B. & Jelinek, D. (2003). Oncogene, 22, 3598-3607. Wang, L.M., Kuo, A., Alimandi, M., Veri, M.C., Lee, C.C., Kapoor, V., Ellmore, N.,
Chen, X.H. & Pierce, J.H. (1998). Proc Natl Acad Sci U S A, 95, 6809-14. Wang, Y.D., De Vos, J., Jourdan, M., Couderc, G., Lu, Z.Y., Rossi, J.F. & Klein, B.
(2002). Oncogene, 21, 2584-92.
Zhan, F., Hardin, J., Kordsmeier, B., Bumm, K., Zheng, M., Tian, E., Sanderson, R., Yang, Y., Wilson, C., Zangari, M., Anaissie, E., Morris, C., Muwalla, F., van Rhee, F., Fassas, A., Crowley, J., Tricot, G., Barlogie, B. & Shaughnessy, J., Jr. (2002). Blood, 99, 1745-57.
Zhang, X.G., Gaillard, J.P., Robillard, N., Lu, Z.Y., Gu, Z.J., Jourdan, M., Boiron, J.M., Bataille, R. & Klein, B. (1994). Blood, 83, 3654-3663.
Table 1: Clinical data of the AREGhigh and AREGlow patients
Definition of AREGhigh and AREGlow subgroups
50%-group 40%-group 25%-group 15%-group
AREGhigh n=32 AREGlow n=32 AREGhigh n=25 AREGlow n=25 AREGhigh n=15 AREGlow n=15 AREGhigh n=10 AREGlow n=10 β2m ≥ 4 mg/l 31% 56% 32% 60% 47% 80% 50% (ns) 80% (ns) LDH ≥ 190 IU/l 13% 34% 16% 40% 13% 47% 10% 50%
Sixty-five newly-diagnosed patients with MM were separated into two subgroups according to AREG gene expression in myeloma cells assayed with Affymetrix microarrays. The two subgroups represent 50% (n=32), 40% (n=25), 25% (n=15), or 15% (n=10) of the patients with the highest (AREGhigh) or lowest (AREGlow) AREG expression. Data are the percentage of patients within each subgroup with the indicated clinical parameter. The percentages are statistically significantly different between the 2 groups, with the chi square test (P ≤ .05), except when (ns), i.e, “non significant”, is indicated.
Table 2. Percentage of reduction of viable primary myeloma cell number by PD169540 and IRESSA, compared to the control group.
A.
Responder patients
(to PD169540) PD169540 DEX DEX PD169540 + IRESSA DEX IRESSA +
patient 1 90 23 97 0 23 patient 2 38 59 92 0 62 patient 3 48 95 95 8 92 patient 4 65 40 93 64 75 patient 5 58 0 44 95 37 patient 6 90 22 93 45 87 patient 7 19 4 22 1 0 patient 8 21 13 31 0 13 patient 9 19 93 93 0 92 patient 10 21 40 41 21 62 median value 43 * 31 * 92 ** 5 62 Non-responder patients patient 11 4 0 10 0 0 patient 12 12 0 23 31 8 patient 13 0 0 0 5 3 patient 14 10 45 73 4 51 median value 7 0 16 4 5 B.
Responder patients (to
PD169540 and IRESSA) IRESSA DEX DEX IRESSA +
patient 4 64 40 75
patient 5 95 0 37
patient 6 45 22 87
patient 10 21 40 62
median value 55 * 31 * 69 **
Bone marrow mononuclear cells from 14 patients with MM were cultured for 5 days in RPMI 1640 medium, 5% FCS, 1 ng/ml IL-6, with or without the PD169540 ErbB inhibitor (1 µM), or the IRESSA ErbB1-inhibitor (1 µM) or DEX (10-6 M). At day 5 of culture, the viability and cell counts were assessed and the percentage of CD138+ viable myeloma cells was determined by flow cytometry. Results are expressed as the percentage of reduction of the number of viable cells, compared to the control group cultured without inhibitors. All 14 patients are listed in (A). The median values were calculated separately for the 10 responder patients and the four non-responder patients. The four patients responding to IRESSA are listed in (B). * Indicates that the percentage of reduction compared to the control group is statistically significantly different using a Wilcoxon test for pairs (P ≤ .05). ** Indicates that the percentage of reduction compared to the group cultured with DEX alone is statistically significantly different using a Wilcoxon test for pairs (P ≤ .05).
Legends to figures
Figure 1. Gene expression profile of amphiregulin and HB-EGF
Gene expression profiles of amphiregulin (A) and HB-EGF (B) were determined with Affymetrix U133 A+B DNA microarrays in seven polyclonal plasmablastic cell (PPC) samples, seven normal bone marrow plasma cell (BMPC) samples, purified malignant plasma cells of seven patients with MGUS and 65 patients with MM, and 20 myeloma cell lines (HMCLs). MMI, MMII and MMIII indicate data from myeloma cells of patients with stage I, II or III MM. Statistical comparisons were made with a Mann-Whitney test.
Figure 2. AREG or HB-EGF mRNA quantification in myeloma cells, normal plasma cells, or the bone marrow environment of MM patients using real-time RT-PCR
AREG and HB-EGF expression was determined on (A) purified primary myeloma
cells from seven patients, 20 HMCLs, seven PPC samples, three BMPC samples, (B) bone marrow (BM) mononuclear cells depleted of myeloma cells from seven patients with MM and bone marrow stromal cells (BMSCs) isolated from four patients with MM. Real-time RT-PCR analysis was made as described in Materials and Methods. Figure 3. ErbB mRNA quantification in myeloma cells, normal plasma cells, and normal plasmablastic cells using real-time RT-PCR.
Real-time RT-PCR was performed on RNA samples isolated from purified primary myeloma cells, myeloma cell lines, PPCs, and BMPCs. Real-time RT-PCR analysis was made as described in Materials and Methods.
Figure 4. ErbB mRNA quantification in the tumor environment and bone marrow stromal cells.
Real-time RT-PCR was performed on RNA samples isolated from bone marrow mononuclear cells depleted of myeloma cells from seven patients (A) and bone
marrow stromal cells derived from four patients with MM (B). Real-time RT-PCR analysis was made as described in Materials and Methods.
Figure 5. AREG promotes the growth and IL-6 production of bone marrow stromal cells (BMSCs).
A. BMSCs were cultured for 3 weeks in DMEM and 5% FCS in a six-well culture plate, with or without AREG (1 µg/ml), with or without IRESSA (1 µM), at a density of 4×10⁴ cells/ml. At day 5 (BMSC1-2) or 7 (BMSC3), cells were trypsinized and replated at a concentration of 4×10⁴ cells/ml. Results are the mean cell numbers of triplicate cultures and are of one experiment representative of three. B. IL-6 concentrations were measured by ELISA in culture supernatants of BMSCs after stimulation with AREG (1 µg/ml), ± IRESSA (1 µM) for 48 h. Concentrations ofIL-6 are presented as pg/ml corrected for 4×10⁴ cells. Data are means ± SD of the IL-6 secretion determined on triplicate culture wells and are those of one experiment representative of five. C. BMSCs were incubated with AREG, with or without IRESSA for 24 h and analyzed for IL-6 expression using real-time RT-PCR. Each sample was normalized to β2m and compared with the levels of IL-6 expression in
the control groups, which was assigned a relative expression value of 1. Data are the means ± SD of the IL-6 expression determined in five different experiments. * Indicates that the mean value is statistically significantly different from that obtained without AREG, using a Student t-test for pairs (P ≤ .05). ** Indicates that the mean value is statistically significantly different from that obtained with AREG, without IRESSA, using a Student t-test for pairs (P ≤ .05).
Figure 6. Gene expression profile of syndecan 1 and CD9
Gene expression profiles of syndecan 1 (A) and CD9 (B) were determined with Affymetrix U133 A+B microarrays in seven normal BMPC samples, seven PPC
samples, purified malignant plasma cells of seven patients with MGUS and 65 patients with MM, and 20 HMCLs. C. Surface expression of CD9 was determined using FACS with an anti-CD9-PE antibody (solid line) and a PE-isotype control (dotted line).
Figure 7. Sensitivity of myeloma cell lines to AREG.
A. XG-1 and XG-7 cells were IL-6-starved for 3 h and cultured in RPMI1640 culture medium and 5% FCS, with 5 pg/ml IL-6, with or without 1 µg/ml AREG. Cells were cultured for 6 days and pulsed for 12 h with tritiated thymidine at the end of the culture. Data are means ± SD of the tritiated thymidine incorporation determined on sixplicate culture wells and are those of one experiment representative of three. * Indicates that the mean value is statistically significantly different from that obtained without AREG, using a Student t-test (P ≤ .05). B. XG-1 and XG-7 cells were IL-6-starved and cultured with 5 pg/ml IL-6 and 1 µg/ml AREG with or without inhibitors (1 µM). Mean tritiated thymidine incorporations were determined in sixplicate culture wells and results are expressed as percentages of the mean proliferation without ErbB inhibitor. * Indicates that the mean value is statistically significantly different from that obtained without inhibitor, using a Student t-test (P ≤ .05). C. XG-1 cells were incubated with AREG (1 µg/ml) for 2 h, 4 h, 6 h, 24 h and 4 days, and were analyzed for ErbB1 expression using real-time RT-PCR. Each sample was normalized to β2m and compared with the level of ErbB1 expression in XG-7 cells,
which was assigned a relative expression value of 100.
Figure 8. The PD169540 and IRESSA ErbB-inhibitors inhibit the survival of primary myeloma cells.
A. Mononuclear cells from patients with MM were cultured for 5 days at 5 × 10⁵ cells/ml in RPMI 1640 medium and 5% FCS with either the PD169540 ErbB inhibitor
(1 µM), or IRESSA (1 µM) or dexamethasone (DEX, 10–6 M), alone or in combination. As endogenous production of IL-6 is highly variable in short-term culture of patients’ bone marrow, 0.5 ng/ml recombinant IL-6 was added to eliminate this source of variability. In each culture group, cells were stained with an anti-CD138-PE antibody. The percentages indicated are the percentages of CD138+ cells in the culture. B. Concentrations of AREG in bone marrow culture supernatants from 12 patients with MM, bone marrow plasma from 15 patients with MM and myelomatous pleural effusions from four patients were determined by ELISA. The sensitivity of the ELISA was 5 pg/ml.