Publisher’s version / Version de l'éditeur:
Vous avez des questions? Nous pouvons vous aider. Pour communiquer directement avec un auteur, consultez la première page de la revue dans laquelle son article a été publié afin de trouver ses coordonnées. Si vous n’arrivez pas à les repérer, communiquez avec nous à PublicationsArchive-ArchivesPublications@nrc-cnrc.gc.ca.
Questions? Contact the NRC Publications Archive team at
PublicationsArchive-ArchivesPublications@nrc-cnrc.gc.ca. If you wish to email the authors directly, please see the first page of the publication for their contact information.
https://publications-cnrc.canada.ca/fra/droits
L’accès à ce site Web et l’utilisation de son contenu sont assujettis aux conditions présentées dans le site
LISEZ CES CONDITIONS ATTENTIVEMENT AVANT D’UTILISER CE SITE WEB.
Research Paper (National Research Council of Canada. Division of Building
Research); no. DBR-RP-484, 1971-04-01
READ THESE TERMS AND CONDITIONS CAREFULLY BEFORE USING THIS WEBSITE.
https://nrc-publications.canada.ca/eng/copyright
NRC Publications Archive Record / Notice des Archives des publications du CNRC : https://nrc-publications.canada.ca/eng/view/object/?id=61fd55bd-d066-49fe-8dcd-a37e56922c19 https://publications-cnrc.canada.ca/fra/voir/objet/?id=61fd55bd-d066-49fe-8dcd-a37e56922c19
NRC Publications Archive
Archives des publications du CNRC
This publication could be one of several versions: author’s original, accepted manuscript or the publisher’s version. / La version de cette publication peut être l’une des suivantes : la version prépublication de l’auteur, la version acceptée du manuscrit ou la version de l’éditeur.
For the publisher’s version, please access the DOI link below./ Pour consulter la version de l’éditeur, utilisez le lien DOI ci-dessous.
https://doi.org/10.4224/40001742
Access and use of this website and the material on it are subject to the Terms and Conditions set forth at
Experimental verification of the rule of moisture moment
Ser
TH1 ' f,
c
N21r 2 I - -
'
.,'"2
484
NATIONAL RESEARCH COUNCIL OF CANADA
c . 2
~$ONSEIL NATIONAL D E RECHERCHES DU CANADA
3iE&?G
Experimental Verification of
the Rule of Moisture Moment
by
T. Z. H a m a t h y and T. T. Lie
Reprinted from FIRE TECHNOLOGY Vol. 7, No. 1, February 1971
p. 17-24
Research Paper No. 484 of the
Division of Building Research
I
c L C . 7 , ; ,-- iI
- I Y i lI
OTTAWA
i
April 1971 K;'cilOl:.'lL R E S i . 2 , : :I: c-:.:!..!~
1
I
L
-,-.-.-",
Price 25 cents NRCC 11947
4p;Z-j
"
8jSi;,VERIFICATION EXPERIMENTALE D E LA REGLE, DITE DU MOMENT D E L'HUMIDITE
SOMMAIRE
Une rhgle, dite du moment de l'humidit4 a d6jh 6% avanc6e par un des auteurs en s'appuyant sur des consid6rations pure- ment theoriques. Selon cette rhgle un accrojssement de r6- sistance au feu attribuable h l'humidit4 est proportionnel au moment de cette humidit6 par rapport B la surface exposee de 1'6chantillon d'essai. Cette hypothese est maintenant con- firm6e par le resultat des experiences decrites dans le pr6sent m6moire.
FIRE TECHNOLOGY
Experimental Verification
of the Rule of Moisture Moment
T. Z. HARMATHY and T. T. LIE
Division of Building Research
National Research Council of Canada
According to the "rule of moisture moment," the gain in fire en- durance due to moisture is proportional to the moment of moisture about the exposed surface of the test specimen. The experimental results presented here confirm this suggestion.
I
T IS well known that the fire endurance of standard test specimens depends not only on the average moisture content, but also on the dis- tribution of moisture across the thickness of the specimens. Based on a series of computer studies, it has been suggested1r2 that the gain in fire endurance is proportional to the moment of moisture about the exposed surface. The work to be described in this paper was undertaken to supply experimental evidences for this so-called ''rule of moisture moment."T H E O R E T I C A L
If spalling does not occur, the presence of moisture is beneficial for the performance of building elements in fire. The "figure of merit of moisture,"
$, is the measure of the fractional increase in fire endurance in relation to the moisture present:
(1) In the case of symmetrical slab constructions (solid or hollow), the- oretical considerations indicated that $ depends primarily on r d and the
permeability of the solid. The following empirical relation has been suggested1:
$ = b
1
+
0.25 ~ d(2) where
b = 5.5 for normal weight concretes, gun-applied concretes, and brick,
b = 8.0 for lightweight concretes, b = 10.0 for cellular concretes.
Copyright 1971 NATIONAL FIRE PROTECTION ASSOCIATION, 6 0 BATTERYMARCH ST., BOSTON, MASS. 02110 Printed in U.S.A.
18 Fire Technology
I n Equation 1,
Gau
is the effective value of the average moisture con- centration. It is defined as- M
ffau = - Qau
Ma
where a,, is the average moisture concentration on a volume basis, i.e., in ft3/ft3. a is obtained from the moisture concentration, m, expressed conventionally in lb/lb, as3
In Equation 3, M is the "moisture moment" about the exposed surface under actual experimental conditions:
xadx. (5)
0
In practice, the values of moisture concentration a,, a,, a,,
. . .
are measured a t various distances X I , x,, x3,. . .
from the exposed surface by means of a technique described in Reference 4. These values are regarded as prevailing in elementary slabs of thicknesses Axl, Ax2, Ax3,.
. . .
In this case the moisture moment is calculated with the use of the following finite difference form of Equation 5:Examples of such calculations have been given in Reference 2.
The moisture moment can also be expressed with the aid of the average moisture concentration as
M = dLa,, (5b)
where d is the distance of the center of gravity of moisture in the slab from the exposed surface.
M , in Equation 3 is the moisture moment that would prevail if the same amount of moisture were symmetrically distributed about the central plane of the slab. Since for symmetrical distribution d = L/2,
L2
M , = - a,,. 2 Thus from Equations 5b and 6
By combining Equations 1,2, and 3, the following explicit expression is obtained for the fractional gain in fire endurance due to the presence of moisture:
Moisture M o m e n t 19
This equation is the mathematical formulation of the rule of moisture moment.
Figure 1 is an illustration of the rule of moisture moment. Four differ- ent moisture concentration distributions are shown across a slab of thick- ness L. In all four cases the average moisture concentration is the same, i.e., areas ABCD are identical. According to Equation 8 the gain in fire endurance is proportional to the product of areas ABCD and the distances d. Clearly, for the two symmetrical moisture distributions shown in Fig- ures l c and I d identical fire endurance values can be expected; for the distribution shown in Figure l a the fire endurance will be less and for that shown in Figure l b the endurance will be more than in the symmetrical cases.
Figure 1. Moisture concentration distributions according to the rule of moisture moment.
The most common practical problem is that the fire endurance, T,, is known from a standard fire test for particular values for a,, and M, and
its value is sought for other values of a,, and/or M. To solve this problem,
first ~ d , the fire endurance of the construction in "moistureless" condition,
has to be calculated. This can be done by combining Equations 1 and 2 and solving the equation so obtained for .rd
Once rd is known, T, can be calculated for any value of a,, and/or M by
Fire Technology
E X P E R I M E N T A L
The fire tests were carried out on specimens made of three Fiberfrax boards5 of an average density of 25.2 lb/ft3, machined to sizes 31 in. by 34 in. by % in. thick.
As the boards were very porous and adsorbed water very quickly, the simplest way of putting the predetermined amount of water into them was by spraying them separately from both sides with water while they were resting on a scale.
After this operation the boards were bolted together, as shown in Figure 2, to ensure that no major air layers developed between them during the fire test. This assembly was then installed into an opening of an electric
FIBERFRAX BOARDS 1
x L O C A T I O N O F T H E R M O C O U P L E J U N C T I O N U N D E R P A D
Figure 2. Fire test specimen.
fire test furnace described in Reference 6. Three thermocouples were fastened to the unexposed surface (Figure 2) and covered with standard asbestos pads.
The time between the spraying of the boards and the beginning of the fire test was generally not more than 45 min. In some tests the furnace
Moisture M o m e n t 21
was positioned vertically, so that the specimen represented a wall section. I n other tests it was horizontal, and the specimen simulated a floor slab.
The fire tests did no permanent damage to the boards, so that they could be used over and over again.
R E S U L T S
The experimental data are summarized in Table 1. Since the co- efficient of heat transfer for a hot surface facing upwards is slightly higher than for a vertical surface,' one could expect slightly higher fire endurances resulting from the horizontal tests. I n fact, the differences turned out to be very small and were overshadowed by the considerable spread of the
TABLE 1. Information Concerning Experimental and Calculated Data
Test Moisture distri- - 7 (hr)
No. bution in specimen* (fgiit3) M / M 8 (fg7Tt3) e x p . calc.
l v 2 v 3 v 4 v 5 v 6 v 7 v 8 v 9 v 10v l l v 12v
Specimen tested vertically
w - 0.0135 1.0 0.0135 0.556 0.596
3 -
-
0.0202 0.778 0.0157 0.600 0.612 * * 0 1.0 0 0.510 0.500 $5.- 0.0202 1.0 0.0202 0.642 0.644 m 0.0404 1.0 0.0404 0.736 0.787Z-C-
0.0404 0.778 0.0314 0.722 0.723 I - - R 0.0404 1.222 0.0494 0.933 0.8512 -
0.0135 1.0 0.0135 0.592 0.596 W d 0.0202 1.222 0.0247 0.659 0.676 0.0202 1.0 0.0202 0.660 0.644 0.0269 1.333 0.0359 0.819 0.755b
0.0269 0.667 0.0179 0.639 0.627Specimen tested horizontally
w
-
* * 0 1.0 0 0.497 0.500 2 4 0.0202 1.444 0.0292 0.648 0.7082
s
0.0202 0.556 0.0112 0.609 0.580 0.0404 1.222 0.0494 0.809 0.8513
?
E
-
0.0404 0.0269 0.778 1.333 0.0314 0.0359 0.742 0.665 0.723 0.755 0.0269 0.667 0.0179 0.580 0.6278-
0.0336 0.6 0.0202 0.647 0.644 0.0336 1.4 0.0470 0.758 0.834-
0.0202 1.0 0.0202 0.709 0.644*Every means 0.05 Ib/lb moisture. **In "moistureless" condition.
experimental data. For this reason, in evaluating these data, no distinc- tion has been made between vertical and horizontal tests.
According to Equation 8 the constant b can be evaluated from the slope of the - "best" straight line representing the experimental points in a
7 , versus a,, plot. It was found that for Fiberfrax board b = 16. This
relatively high value for b comes as no surprise, as the material is highly permeable, and b is known from theory1 to increase with permeability.
22 Fire Technology
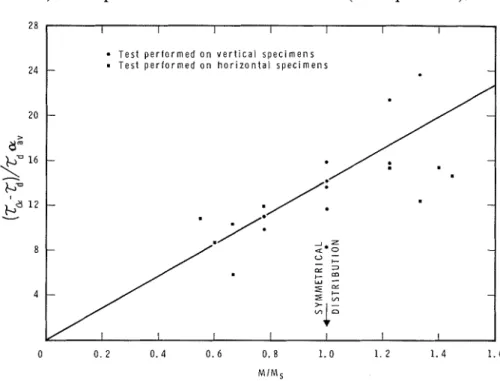
According to Equation 8 the validity of the rule of moisture moment is proved if a plot of (T, - 7 d ) / 7 d a a u versus M/M, is a straight line. Such
a plot is presented in Figure 3. Although the spread of the points is con- siderable, this plot clearly shows that the fire endurance does increase with an increase in the moisture moment. The full line represents the theoretical relationship between (T, - T ~ ) / T ~ ( Y ~ " and M/M,. With b = 16 and T~ = 0.5, the slope of this theoretical line is 14.22 (see Equation 8).
I I I I I I I T e s t p e r l o r m e d o n v e r t i c a l s p e c i m e n s m T e s t p e r f o r m e d o n h o r i z o n t a l s p e c i m e n s - - - - - -
Figure 3. Relationship between fire endurance and moisture moment.
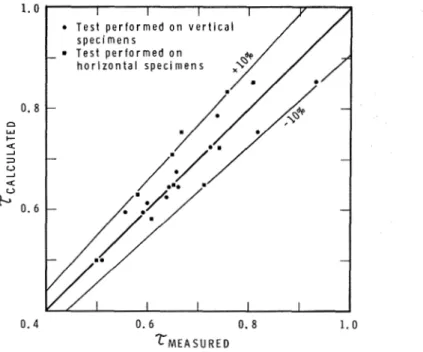
Figure 4 shows a comparison of the experimental values of T with those calculated with the aid of Equation 8. With the above values of ~d and b
the explicit expression for T, is
The agreement between the theoretical and experimental values is, in general, satisfactory. The larger than usual spread of the points is attributable to the following factors:
The relatively short values of the fire endurance in the test series. (The accuracy of the fire test results decreases with decreasing fire endur- ance values.) ;
0 Possible gap formation between various layers of the specimen during
the test; and
Evaporation of some moisture, especially from the two surface layers during the time of installation of the specimen in the furnace.
Moisture Moment 23 T e s t p e r f o r m e d o n v e r t i c a l s p e c i m e n s
-.
T e s t p e r f o r m e d o n 0.8 - n Y + a A 3 - - - - 0.4 0. 6 0. 8 1.0 T M E A S U R E DFigure 4. Comparison of calculated values of fire endurance with measured values.
N O M E N C L A T U R E
b = material constant, h r
d = distance of center of gravity of moisture from exposed surface, f t
L = thickness of slab, ft
m = moisture concentration, lb/lb
M
= moisture moment, ft2x = distance from the exposed surface, ft p = bulk density of specimen material, lb/ft3
P, = density of water, lb/ft3
T = thermal fire endurance, hr
CY = moisture concentration, ft3/ft3
-
CY = effective moisture concentration, ft3/ft3
JI = figure merit of moisture, dimensionless Subscripts
an = average
d = in dry or "moistureless" condition
= for symmetrical moisture distribution = pertaining to
G,,
R E F E R E N C E S
H ~ n n a t h y , T. Z., "Effect of Moisture on the Fire Endurance of Building Ele- ments, ASTM Special Technical Publication No. 385 (1965), p. 74.
24 Fire Technology
2 Harmathy, T . Z., "Determining Moisture Content and I t s Effect on Fire Endur-
ance," NRC No. 9670, National Research Council of Canada, Division of Building Research, Ottawa (1967).
3 Harmathy, T . Z., "Experimental Study of Moisture and Fire Endurance," Fire
Technology, Vol. 2, No. 1 (Feb. 1966), pp. 52-59.
4 Harmathy, T . Z. and Porteous, E. O., "Sampling Method for Measuring the
Moisture Distribution in Fire Test Specimens," Building Research Note 42, National Research Council of Canada, Division of Building Research, Ottawa (1963).
5 "Fibei5-ax Ceramic Fiber Technical Information," The Carborundum Co., Re-
fractories and Electronics Division, Niagara Falls, N. Y.
Blanchard, J. A. and Harmathy, T. Z., "Small-Scale Fire Test Facilities of the National Research Council," NRC No. 8207, National Research Council of Canada, Division of Building Research, Ottawa (1964).
McAdams, W. H., "Heat Transmission," 2nd ed., McGraw-Hill, New York (1942), p. 240.
ACKNOWLEDGMENT: The authors wish t o thank Mr. D. G. Shearer for perfoi-ming the experiments and evaluating the test results. This is a contribution from the Divi- sion of Building Research, National Research Council of Canada and is published with the approval of the Director of the Division.
This publication is being distributed by the Division of Building Research of the National Research Council of Canada. I t should not be reproduced in whole or in part without permission of the original publisher. The Division would be glad to be of assistance in obtaining such per- mission.
Publications of the Division may be obtained by mailing the appropriate remittance, (a Bank, Express, or Post Office Money Order, or a cheque made payable at par in Ottawa, to the Receiver General of Canada, credit NRC) to the National Research Council of Canada, Ottawa. Stamps are not acceptable.
A list of all publications of the Division is available and may be obtained from the Publications Section, Division of Build- ing Research, National Research Council of Canada, Ottawa