Publisher’s version / Version de l'éditeur:
Journal of Testing and Evaluation, 4, 2, pp. 151-156, 1976-03
READ THESE TERMS AND CONDITIONS CAREFULLY BEFORE USING THIS WEBSITE. https://nrc-publications.canada.ca/eng/copyright
Vous avez des questions? Nous pouvons vous aider. Pour communiquer directement avec un auteur, consultez la première page de la revue dans laquelle son article a été publié afin de trouver ses coordonnées. Si vous n’arrivez pas à les repérer, communiquez avec nous à [email protected].
Questions? Contact the NRC Publications Archive team at
[email protected]. If you wish to email the authors directly, please see the first page of the publication for their contact information.
NRC Publications Archive
Archives des publications du CNRC
This publication could be one of several versions: author’s original, accepted manuscript or the publisher’s version. / La version de cette publication peut être l’une des suivantes : la version prépublication de l’auteur, la version acceptée du manuscrit ou la version de l’éditeur.
Access and use of this website and the material on it are subject to the Terms and Conditions set forth at
Joint movement in precast concrete panel cladding
Karpati, K. K.; Sereda, P. J.
https://publications-cnrc.canada.ca/fra/droits
L’accès à ce site Web et l’utilisation de son contenu sont assujettis aux conditions présentées dans le site LISEZ CES CONDITIONS ATTENTIVEMENT AVANT D’UTILISER CE SITE WEB.
NRC Publications Record / Notice d'Archives des publications de CNRC:
https://nrc-publications.canada.ca/eng/view/object/?id=1b5b2943-f220-40cf-90eb-782708ae9beb https://publications-cnrc.canada.ca/fra/voir/objet/?id=1b5b2943-f220-40cf-90eb-782708ae9bebI
Ber
TH1
'
N21d
, ,
o
664
1 Research Council of Canada
c .
2
national de recherches du Canada
BLDG
I
JOINT MOVEMENT
IN PRECAST
CONCRETE PANEL CLADDING
by
K.K. Karpati and
P.J.
Sereda
4
Reprinted from
American Society for Testing
and
Materials Journal of Testing and EvaluationMarch 1979 6 p.
-. d
DBRTPaper
No.
664Division of Building Research
Price 10 cents
j
NATIONAL R E S E A R m COU-%
LE MOUVEMENT DES JOINTS DANS
UN
PAREMENT DE BANNEAUX
DE BETON PREFABRIQUE
SOMMAIRE
On mesure les mouvements de joints entre des panneaux de beton prefabrique
dans un grand immeuble. Les mouvements sont mis en corrklation avec les
changements de temperatuse de l'air et on en fait une evaluation statistique.
Un coefficient de mouvement experimental est calcule
A l'aide de I'inclinaison
de la ligne
de
regression et des dimensions des panneaux, et on le compare au
coefficient linhire publie de la dilatation thermique du beton.
Authorized Reprint from
Journal of Testing and Evaluation, Vol. 4, No. 2 Copyright
American Society for Testing and Materials 1916 Race Street, Philadelphia, Pa. 19103
1976
K. K. Karpati' and
P.
J.
Sereda'
Joint Movement in Precast Concrete Panel Cladding
REFERENCE: Karpati, K. K. and Sereda, P. J., "Joint Movement
in Precast Concrete Panel Claddine." Journal o f test in^ and
to the structure. This results in a wall made of discrete units with numerous joints which must accommodate thermal move- ments and at the same time be sealed to form an integral wall that will exclude rain and serve as an acceptable aesthetic facade to the building.
Clearly the design of the joints between panels is important in the satisfactory performance of the exterior cladding. This study of joint movement in an actual building was prompted by the occurrence of sealant failure in such walls and the lack of available information on the subject.
The study was carried out on precast concrete panels on a building reported to be undergoing severe water leakage. The aim was to determine if the failure of sealed joints was due to joint movement in excess of that calculated from the thermal coefficient of linear expansion of the concrete; that is, the co- efficient (with an added safety factor) that is generally used in the design of such walls.
Experimental
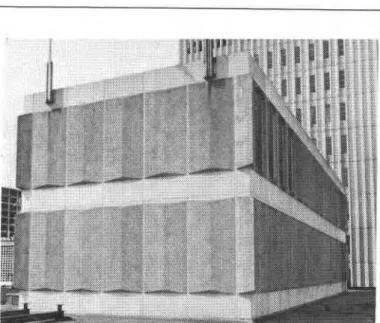
Joint movements between precast concrete panels were measured on the penthouse of a high-rise building in downtown Ottawa. The penthouse was chosen because it was so easy to measure, the panels being the same as on the building itself. Figure 1 shows the penthouse. The panels are 12 by 5 ft (3.6 by 1.5 m) on the bottom row and 14 by 5 ft (4.3 by 1.5 m) on the top row. As can be seen from the picture, the panels have a
Research officer and Head, Building Materials Section, respectively, Division of Building Research, National Research Council of Canada, Ottawa, KIA 0R6. Mr. Sereda is a member of ASTM.
FIG. 1-The penthouse where joint movement measurements were taken.
scalloped shape that increases the total thickness from 3 to 6 in. (76 to 152 mm) at the thickest section.
On the back of the concrete panels there is a 2-in. (51-mm) thick layer of rigid insulation. The insulation is separated from the inside 6-in. (152-mm) concrete block wall by a 6-in. wide cavity. (The location of the insulation in the w d should have been on the other side of the cavity to be more effective.) The panels are fastened to the cross members (spandrel beams) with angle brackets at both top and bottom.
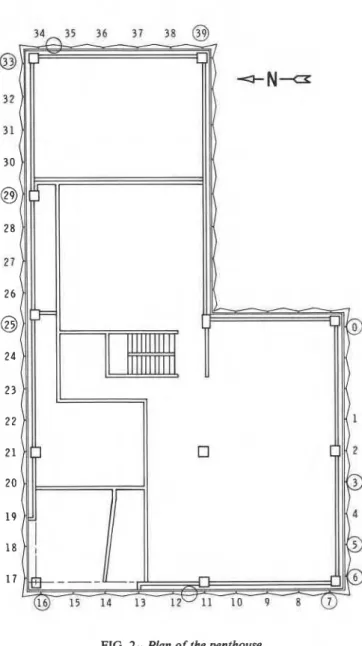
Figure 2 illustrates the plan of the penthouse. The joints accessible from the rooftop are numbered from 0 to 39. A total of twelve joints were measured, and these are marked with a circle on the plan. Most joints selected for measurement showed five to ten failure points of the sealant, although Joints 6 and
39, where the sealant was not cracked, were also included. Joint 0 showed failure only at a corner. Most measuring points were located close to corner columns where one can expect less sagging of the spandrels to which the panels were attached and, therefore, less distortion in the parallelism of the joint. The location of the measuring points included joints exposed to all four cardinal directions. Two of the joints observed were horizontal and ten vertical.
To measure the joint movement a gage was made based on the design of a similar gage developed by the British Building Research Establishment. This gage records the maximum and minimum joint widths during selected time intervals. The maximum and minimum temperature readings were observed for the same periods using a Taylor maximum-minimum
FIG. 2-Plan of the penthouse.
thermometer. This enabled the joint movement to be evaluated as a function of temperature changes.
I Based on previous experiences [ l ] with joint movement re-
cordings, readings were taken at two-week intervals. This frequency of reading provides a sufficient amount of data for accurate statistical analysis.
I
Description of the Joint Movement Gage
I The joint movement gage is schematically illustrated in
Fig. 3. It consists of a stainless steel block (a) containing two pistons which are equipped with a special adjustable friction device (b). The block is rigidly attached to one side of the joint by means of an extension bar and a wall plug (c). On the other side of the joint a reference plug (d) is attached to the wall, carrying a spherical head (e). At the start of an experiment the pistons are pushed in until they touch the spherical head. As the joint opens after a temperature drop, the spherical head pushes the piston, marked I, ahead of it. When the joint movement changes direction and the joint closes,
W A L L \
JOURNAL OF TESTING AND EVALUATION
L E A D A N C H O R F O R R E F E R E N C E P L U G
FIG. 3-Cross section of joint movement gage bridging the joint.
Piston 1 is left behind and Piston I1 is pushed ahead of the sphere. In subsequent daily cycles the pistons are pushed further out, provided the joint width extremes exceed the previously registered ones. At the end of the chosen two-week period the pistons are in the positions corresponding to the maximum and to the minimum joint width occurring during this period.
The position of the pistons is measured at the end of each period with a depth gage at the points indicated by double arrows in Fig. 3. The depth gage measures the distance between the flat surface of the piston and the end face of the stainless
steel block. The reading accuracy is & 0.0005 in. (0.0127 mm).
The depth measurement indicated by A in Fig. 3 gives the
maximum, while B is the minimum joint width occurring during the period observed.
To increase the number of data for the same number of field trips, after the depths of the cylinders were read the pistons were pushed back until they touched the spherical head and the depths were read again at these reset positions. When the joint width is plotted versus the corresponding temperature, the
reset values taken at position A fall on the same plotted line
as the A readings related to the maximum joint width achieved
in the time period just passed. The same is true for the B
readings. The plots of maximum joint width versus temperature and that of minimum joint width versus temperature give two lines with opposite slope. These two lines represent the same result: that the joint movement correlates to temperature and should be combined so that all the readings can be statistically evaluated together as a unit, greatly increasing the accuracy.
The depth reading B can be expressed in terms of A by a
simple calculation. If both cylinders are pushed in until they touch the sphere (AsH, BseS, then the following equation can be written:
where P is the combined length of the cylinders and the spherical
head and L is the total length of the casing. P and L are
constants of the gage and, therefore, for any reading of B a
KARPATI AND SEREDA ON PRECAST CONCRETE PANELS
I
equation. The direct A readings and the calculated A , readings fall on the same plotted line.I A FORTRAN IV program was written for an IBM 360 I computer t o provide the necessary statistical calculations, and a ! tape for plotting the data and the best fitting lines was obtained as a result of the calculations. The plottings were done on an EAI 430 Data-plotter.
Discussion
Readings were taken during a period of a full year (starting in February 1969) to include the coldest and the warmest part of a year and, therefore, to record the maximum and the minimum joint widths that occurred.
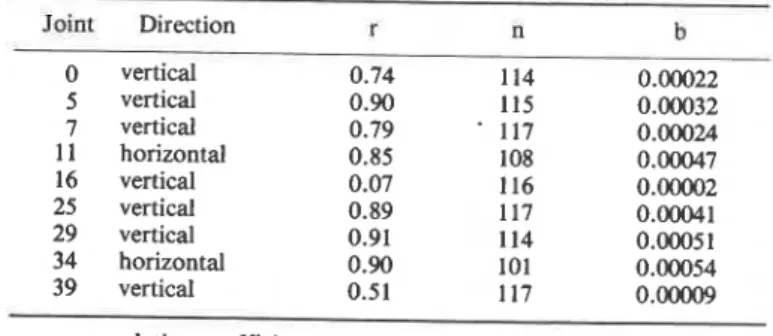
The data were subjected to a statistical analysis in which the depth gage readings, which are in fact the relative joint positions, in inches, at a given time, were correlated to the appropriate temperature readings. In Table 1 it can be seen that two of the
TABLE 1-Statistics indicating joint movements. Joint Direction vertical vertical vertical horizontal vertical vertical vertical horizontal vertical -- r = correlation coefficient
n = number of pairs of observations b = slope of regression line
twelve joints investigated did not move with the temperature changes during a period of observation of a full year. These are Joints 16 and 39, both vertical joints at a corner column, the former on the east and the latter on the west elevation. The criterion that establishes this lack of movement with temperature change is the value obtained for the correlation coefficients given in Table 1. The coefficients are 0.07 and 0.51 for Joints 16 and 39, respectively. Although the latter shows a much higher correlation coefficient than the former, it is still much too low to be considered significant. The table also gives the number of observations (n) and the slope of the regression lines (b). The latter, being the joint movement in inches per degree Fahrenheit change, also indicates if the joint does not move. Indeed, the values obtained, 0.00002 and 0.00009 in./"F, are significantly lower than the mean slope ob- tained for the other joints, that is, 0.00036 in./OF.
The total number of joints investigated was twelve, of which seven showed appreciable movement. All joint movement data were subjected to a statistical analysis after about two months of observation, and the data collection was stopped in three cases, Joints 3, 6, and 33, when the correlation coefficient was found to be very low. Although the coefficient for Joints 16 and 39 was low as well during the initial observation period, read- ings_were taken for the full year to see if the increased number of observations would improve the correlation. The
yearly data merely confirmed the lack of movement at those joints.
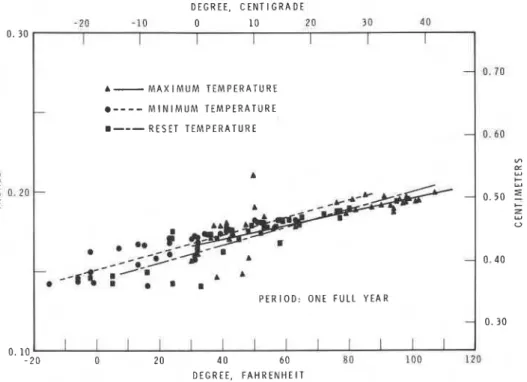
A representative plot obtained with the data collected on a
i
moving joint is shown in Fig. 4. It illustrates Joint 11 that hada correlation coefficient equivalent to the mean of the various joints that showed movement (see Table 1). On the vertical axis the depth gage readings are given in inches and centimeters and on the horizontal one the temperature readings in degrees Fahren-
heit and Celsius. The maximum temperature readings related to I the minimum joint width readings are illustrated by "x" symbols,
the minimum temperature with circles, and the reset temperature readings with "
+
"
symbols. The regression lines are drawn as acontinuous line for maximum temperature, as a dashed line for minimum, and as dotted line for the reset temperature data. The plot shows that there is a fair amount of scatter, which can be attributed partly to the comparatively low accuracy of the readings together with human errors and partly to causes of movement other than temperature variations, such as moisture content changes.
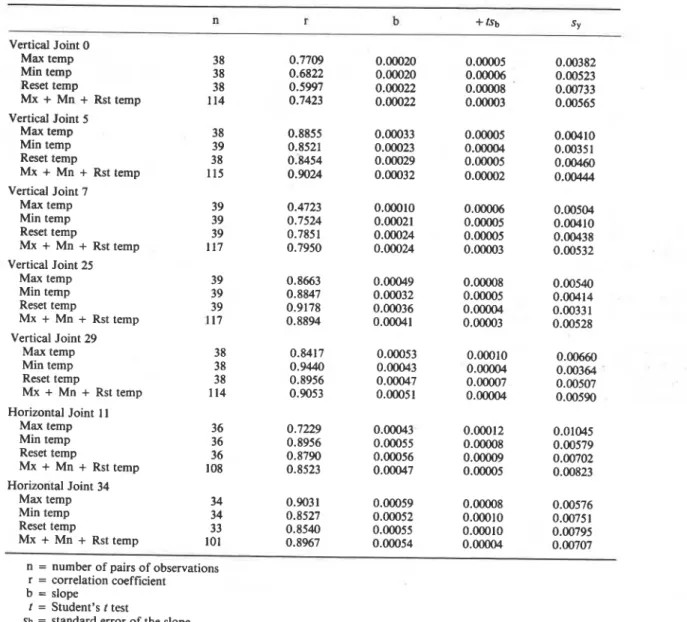
Table 2 presents the results of the detailed statistical analysis obtained with joints that moved with temperature changes. For each joint the maximum, minimum, and reset readings, cor- related to the corresponding depth readings, are analyzed separately as well as together. The confidence limits of the slopes are calculated as follows [I]:
where b is the slope, t is Student's test, and
where s, is the standard error of the data, xi is the ith reading, and n is the number of pairs of data.
The results of the analysis done separately on the various types of temperature readings show that the maximum tempera- ture data have a tendency to give a greater slope (movement per degree Fahrenheit change) than the minimum temperature data, with the reset temperature results intermediate. In the case of Joints 5 and 25, the slopes are distinctly different; the bands delineated by the 90% confidence limits do not overlap when comparing maximum and minimum temperature readings. For the other joints in Table 2, with the exception of Joint 7, there is overlapping of the 90% confidence limits. Therefore, they have to be considered identical within the errors of the experi- ment. Nevertheless when all the slopes of all the joints are compared, there is a definite trend of higher values for the maximum than for the minimum temperature data, with the reset data taking an intermediate position. For Joint 7 the correlation coefficient is so low for the maximum temperature data that this group has to be considered erroneous and dropped from the analysis. The slope of reset and minimum temperature data obtained for the same joint confirms, however, the trend found for the other joints.
This trend of the slopes means in terms of joint behavior that the joint responds with a relatively larger movement to temperature variations at higher temperatures. A possible explanation of this phenomenon is that at decreasing temperatures the importance of the moisture content of the panel increases. A higher moisture content, resulting from higher relative humidity
154 JOURNAL OF TESTING AND EVALUATION DEGREE. C E N T I G R A D E A- M A X I M U M T E M P E R A T U R E
-
a - - - - M I N I M U M T E M P E R A T U R E 8---
R E S E T T E M P E R A T U R E P E R I O D : O N E F U L L Y E A R1
0. 30 FIG. 4-Maximum-minimum gage at horizontal joint I I .0 . 1 0
in the air at lower temperatures, will produce a swelling op- posing the shrinkage induced by the decreasing temperature.
When the data for different temperatures are analyzed together, the correlation coefficient averages out the slight variations of the separate ones. Hence the combined data provide a suitable basis for comparing the behavior of different joints. The results of the calculation of Eq 1 (ktsb as given in Table 2) demonstrate that the slopes of the combined data always differ significantly from zero using the t test at the 90% confidence level. Therefore, joint movement correlates with temperature change. For vertical joints the slopes range from
0.00022
+
0.00003 to 0.00051 2 0.00004 in./"F.From the above slope and the length of the panel contributing to the movement an experimental coefficient of linear expansion can be calculated. The length contributing to the movement of
vertical joints, if the joint is between two panels each 5 ft (1.5
m) wide, is 5 ft, since they both move, theoretically, from the center outwards. However, if the joint is at a corner, the corner panel has only a 1%-ft (0.46-111) width, of which
M
ft (0.23 m) will contribute to the movement and, on theother side of the joint, 2% ft (0.76 m) will be contributed by the
other panel, giving a total of 3
Y
i
ft (0.99 m).Table 3 presents the experimental coefficients obtained by dividing the value obtained for the slope by the width of the
panel. For vertical joints, they range from 6.4 x to
10.2
x
in./"F/ft where the 90% confidence limits of theformer value are 5.8 and 7.0
x
in./"F/ft, while those forthe latter coefficient are 9.4 and 11.0
x
in./"F/ft. The90% confidence limit lies within a fairly narrow range of values, which, when compared to the linear coefficient of thermal
expansion of concrete of 8
x
inJ°F/ft, indicates thatone of the joints (No. 29) moved more than expected, based on the published coefficient. Another joint (No. 25) showed about as much movement as predicted from the published co-
efficient. Both these joints had a southern exposure. The joints
with 6.4 to 7.4
x
in./"F/ft experimental coefficients wereon the northern and western sides.
Two of the seven joints were horizontal, and the results of
their movement are summarized at the bottom part of Table 2.
The movement at the horizontal joints, in absolute value, is in the same order as that of the vertical joints but when the experimental coefficient of the joint movement is calculated, the coefficients are half of those for the vertical joints. This indicates that the panels are restrained in their movements in the vertical direction along the 13-ft (4-m) lengths (average) but not along the shorter 5-ft (1.5-m) widths.
I I I I I I I Conclusion - 2 0 o 2 o 4 0 60 80 1 ao 120 D E G R E E . F A H R E N H E I T I 1
It was established through statistical analysis that seven joints of the twelve observed on a concrete panel wall sewing as cladding showed joint movements that correlated well with the air temperature changes measured at the joint. The remain- ing five joints showed some movement but only within experi- mental error and, therefore, cannot be considered as moving with temperature variations. The slope of the regression lines obtained for the joint movements versus temperature readings is the movement in inches per degree Fahrenheit change and is a characteristic of each joint. From the slope and the dimensions of the panels forming the joint an experimental joint movement coefficient was calculated. A comparison of these experimental coefficients with the published linear coefficient of thermal expansion of concrete demonstrated that most of those vertical joints that moved underwent movement equal to or less than that predicted by the published coefficient. In one case, the movement was about 20% greater. The two horizontal joints, however, moved only half of what was predicted. The possible reason for the variations is the method of fastening the panels
KARPATI AND SEREDA ON PRECAST CONCRETE PANELS
TABLE 2-Statistical analysis of joint movement versus temperature change.
- - Vertical Joint 0 Max temp Min temp Reset temp Mx
+
Mn+
Rst temp Vertical Joint 5 Max temp Min temp Reset temp Mx+
Mn+
Rst temp Vertical Joint 7 Max temp Min temp Reset temp Mx+
Mn+
Rst temp Vertical Joint 25 Max temp Min temp Reset temp Mx+
Mn+
Rst temp Vertical Joint 29 Max temp Min temp Reset temp Mx+
Mn+
Rst temp Horizontal Joint 11 Max temp Min temp Reset temp MX+
Mn+
Rst temp Horizontal Joint 34 Max temp Min temp Reset temp Mx+
Mn+
Rst temp - -n = number of pairs of observations r = correlation coefficient
b = slope
t = Student's t test
sb = standard error of the slope SY = standard error of the data
TABLE 3-Experimental movement coefficients.
Joint b Location Length, ft (m) in./ "F/ft l/OF 1/"C
Vertical Joints
0 0.00022 comer 3% (0.99) 6.8 x lo-' 5.6 x 10.2 x lo-6 5 0.00032
...
5 (1.5) 6.4 x lo-" 5.3 x lo-e 9.6 x 7 0.00024 corner 3% (0.99) 7.4 x lo-' 6.2 x 11.1 x 10- 25 0.00041...
5 (1.5) 8.2 x lo-5 6.8 x 12.3 x 29 0.00051 ,. .
5 (1.5) 10.2 x lo4 8.5 x 1W8' 15.3 x lo-= Horizontal Joints 1 1 0.00047...
13 (3.96) 3.6 x 10'' 3.6 x 5.4 x lo-E 34 0.00054 comer 13 (3.96) 4.2 x lo-5 3.5 x lo-E 6.2 xb = slope
that allowed horizontal movement but partly restrained vertical joints can be attributed to the panels yielding along one line of
JOURNAL OF TESTING AND EVALUATION
The necessary joint width for the 5-ft (1.5-m) wide panels can be
calculated as described in Ref 2 from the movement anticipated,
5 ft x 125 OF (52' C)
x
8x
in. /"F/ft = 0.05 in. (1.27mm), and from the movement capability of a sealant, where 125
deg is the estimated yearly temperature change. Assuming the use of a good quality sealant with *25% movement capability,
the width W should be:
W,, = [0.5 in./(2)(25)](100) = 0.1 in.
If a sealant of
+
5% movement capability were used, the requiredjoint width would be
W , = [0.05/(2)(5)](100) = 0.5 in.
The joint widths derived do not include a safety factor and should therefore be increased by 50070, as is standard practice in the industry. The actual width of the observed joints varied between
L/z and 5/, in. (12.7 and 15.875 mm). When compared to the
calculated width it is evident that an upgrading of the movement capability of the sealant used would ensure a fail-free system.
It was observed that the joint movement was relatively larger at increasing temperatures than at decreasing ones. The possible reason is that for decreasing temperatures there is moisture con- densation in the pores of the panels that causes expansion which acts to reduce the shrinkage induced by the temperature drop.
Although the two joints that moved most were both on the southern exposure, one cannot draw the conclusion that this would generally be the case because of the small number of joints observed and because there were joints for all of the cardinal exposures that did not move. Further investigation is needed to clarify this point.
This work indicates that prediction of joint movement based on the published coefficient of thermal expansion for concrete should be acceptable because the actual movement is not likely to be greater due to restraints and moisture content increases during the cooling cycle. The exception may occur in the first year of the life of the building when drying shrinkage of concrete panels may be an additional factor.
Acknowledgment
The authors wish to thank Mr. S. W. Raymond and Mr. C. C.
Barrett for collecting the experimental data.
References
[ I ] K. K. Karpati and E. V. Gibbons, "Experimental Prediction of Joint Movements in Buildings," Materials Research and Standards, Vol. 10, No. 4, April 1970, p. 16, or, National Research Council of Canada 11311.