HAL Id: hal-01806852
https://hal.archives-ouvertes.fr/hal-01806852
Submitted on 16 Sep 2020
HAL is a multi-disciplinary open access
archive for the deposit and dissemination of
sci-entific research documents, whether they are
pub-lished or not. The documents may come from
teaching and research institutions in France or
abroad, or from public or private research centers.
L’archive ouverte pluridisciplinaire HAL, est
destinée au dépôt et à la diffusion de documents
scientifiques de niveau recherche, publiés ou non,
émanant des établissements d’enseignement et de
recherche français ou étrangers, des laboratoires
publics ou privés.
phosphate deposition from desert dust and combustion
sources to the Mediterranean Sea
Camille Richon, Jean-Claude Dutay, François Dulac, Rong Wang, Yves
Balkanski
To cite this version:
Camille Richon, Jean-Claude Dutay, François Dulac, Rong Wang, Yves Balkanski. Modeling the
biogeochemical impact of atmospheric phosphate deposition from desert dust and combustion sources
to the Mediterranean Sea. Biogeosciences, European Geosciences Union, 2018, 15 (8), pp.2499 - 2524.
�10.5194/bg-15-2499-2018�. �hal-01806852�
https://doi.org/10.5194/bg-15-2499-2018 © Author(s) 2018. This work is distributed under the Creative Commons Attribution 4.0 License.
Modeling the biogeochemical impact of atmospheric phosphate
deposition from desert dust and combustion sources to the
Mediterranean Sea
Camille Richon1,a, Jean-Claude Dutay1, François Dulac1, Rong Wang1,b, and Yves Balkanski1
1LSCE/IPSL, Laboratoire des Sciences du Climat et de l’Environnement, CEA-CNRS-UVSQ, Gif-sur-Yvette, France anow at: Department of Earth, Ocean and Ecological Sciences, School of Environmental Sciences, University of Liverpool,
Liverpool L69 3GP, UK
bnow at: Department of Environmental Science and Engineering, Fudan University, Shanghai 200433, China
Correspondence:Camille Richon ([email protected]) Received: 9 June 2017 – Discussion started: 21 June 2017
Revised: 6 March 2018 – Accepted: 21 March 2018 – Published: 25 April 2018
Abstract. Daily modeled fields of phosphate deposition to the Mediterranean from natural dust, anthropogenic com-bustion and wildfires were used to assess the effect of this external nutrient on marine biogeochemistry. The ocean model used is a high-resolution (1/12◦) regional coupled
dynamical–biogeochemical model of the Mediterranean Sea (NEMO-MED12/PISCES). The input fields of phosphorus are for 2005, which are the only available daily resolved de-position fields from the global atmospheric chemical trans-port model LMDz-INCA. Traditionally, dust has been sug-gested to be the main atmospheric source of phosphorus, but the LMDz-INCA model suggests that combustion is dom-inant over natural dust as an atmospheric source of phos-phate (PO4, the bioavailable form of phosphorus in
seawa-ter) for the Mediterranean Sea. According to the atmospheric transport model, phosphate deposition from combustion (Pcomb) brings on average 40.5 × 10⁻⁶mol PO
4m−2 yr−1
over the entire Mediterranean Sea for the year 2005 and is the primary source over the northern part (e.g., 101 × 10−6mol PO
4m−2yr−1from combustion deposited in 2005
over the north Adriatic against 12.4 × 10⁻⁶ from dust).
Lithogenic dust brings 17.2 × 10⁻⁶mol PO
4m−2 yr−1 on
average over the Mediterranean Sea in 2005 and is the primary source of atmospheric phosphate to the south-ern Mediterranean Basin in our simulations (e.g., 31.8 × 10⁻⁶mol PO
4m−2yr−1from dust deposited in 2005 on
av-erage over the south Ionian basin against 12.4 × 10⁻⁶from
combustion). The evaluation of monthly averaged deposition flux variability of Pdust and Pcomb for the 1997–2012
pe-riod indicates that these conclusions may hold true for differ-ent years. We examine separately the two atmospheric phos-phate sources and their respective flux variability and evalu-ate their impacts on marine surface biogeochemistry (phos-phate concentration, chlorophyll a, primary production). The impacts of the different phosphate deposition sources on the biogeochemistry of the Mediterranean are found localized, seasonally varying and small, but yet statistically significant. Differences in the geographical deposition patterns between phosphate from dust and from combustion will cause con-trasted and significant changes in the biogeochemistry of the basin. We contrast the effects of combustion in the north-ern basin (Pcomb deposition effects are found to be 10 times more important in the northern Adriatic, close to the main source region) to the effects of dust in the southern basin. These different phosphorus sources should therefore be ac-counted for in modeling studies.
1 Introduction
Atmospheric deposition is an important source of bioavail-able nutrients for the remote oceanic waters (e.g., Jickells, 2005; Mahowald et al., 2009). Aerosols not only include nutritive elements such as nitrogen and phosphorus, which are the main limiting nutrients for marine primary produc-tivity, but also trace metals (Dulac et al., 1989; Heimburger et al., 2012), among which copper has toxic effects on some
phytoplankton species (Paytan et al., 2009). Aerosols can even be associated with living organisms such as viruses, fungi and bacteria (Mayol et al., 2014). The most important aerosol mass deposition fluxes to the global ocean are in-duced by sea salt and natural desert dust (Goudie, 2006; Al-bani et al., 2015) respectively, corresponding to material re-cycling and external inputs. In terms of nutrient fluxes, silica, nitrogen, iron and phosphorus are most abundant among the deposited nutrients (Guerzoni et al., 1999). Nitrogen, phos-phate and iron are the three most important deposited ele-ments measured in the Gulf of Aqaba, which is under the influence of both natural and anthropogenic aerosols (Chen et al., 2007). It is especially important to better character-ize external sources of phosphorus because it limits produc-tivity (either as a primary or secondary limiting nutrient) in many regions of the oceans (Moore et al., 2013). The main sources of atmospheric phosphorus for the surface waters of the global ocean are desert dust and combustion from anthro-pogenic activities (Graham and Duce, 1979; Mahowald et al., 2008).
The Mediterranean Sea is highly oligotrophic and the in-tense summer vertical stratification leads to rapid nutrient de-pletion in surface waters (Bosc et al., 2004). During that sea-son, the atmosphere is the only nutrient source for most of the Mediterranean surface waters (Markaki et al., 2003). Many studies discuss the impacts of atmospheric nutrient deposi-tion to the oligotrophic Mediterranean Sea surface waters (Guerzoni et al., 1999; Markaki et al., 2003; Gallisai et al., 2014). Monitoring and experimental studies have shown that deposition of great amounts of aerosols significantly impacts surface biogeochemistry over this basin (see Herut et al., 2005; Guieu et al., 2014). Ridame et al. (2014) showed that extreme events of Saharan dust deposition can double pri-mary production and chlorophyll a concentration. In partic-ular, the soluble fraction of this aerosol provides the main limiting nutrient to the Mediterranean: inorganic phosphorus (Bergametti et al., 1992; Krom et al., 2010; Tanaka et al., 2011).
Until now, Saharan dust was believed to be the most im-portant atmospheric source of nutrients for the oligotrophic Mediterranean (e.g., Guerzoni et al., 1999). But the Mediter-ranean region is one of the most densely populated areas of the world and many of the surrounding countries historically developed their capital cities along its coasts. The recent de-velopment of many of the Mediterranean countries has led to high anthropogenic footprint over ecosystems and climate through increased population and industrial activities emit-ting aerosols (Kanakidou et al., 2011). Moreover, aerosols are deposited to the Mediterranean Sea from a variety of dif-ferent geographical sources. The impacts of aerosol depo-sition on the Mediterranean region are not fully understood and they may change in the future as a result of climate change impacts on land and sea (e.g., Peñuelas et al., 2013). The Sahara and Middle East are important sources of natural lithogenic dust (e.g., Ganor and Mamane, 1982; Bergametti
et al., 1989; Al-Momani et al., 1995; Vincent et al., 2016), whereas the surrounding cities and highly industrialized ar-eas are sources of atmospheric pollutants emitted by biofuels for heating and fossil fuel burning (Migon et al., 2001; Piaz-zola et al., 2016). The 85 million hectares of forests around the basin associated with the Mediterranean dry summer cli-mate are also an occasional intense aerosol source due to wildfire emissions (Kaskaoutis et al., 2011; Poupkou et al., 2014; Turquety et al., 2014), providing for instance soluble iron to the Mediterranean (Guieu et al., 2005).
Modeling represents an interesting approach to investigat-ing the impact of atmospheric nutrient deposition on oceanic biogeochemical cycles. Richon et al. (2017) use a regional coupled dynamical–biogeochemical high-resolution model of the Mediterranean Sea to study the impacts of N de-position from natural and anthropogenic sources and phos-phate from dust on the biogeochemistry of the Mediterranean Sea. Their results showed important impacts of N deposi-tion on biological productivity (primary producdeposi-tion, chloro-phyll a production, plankton and bacterial concentrations) in the northern Ionian and Levantine basins and limited, yet significant, impact of P deposition in the southern Mediter-ranean regions. In the present study, we extend this investi-gation of phosphate deposition effects by further considering the contribution of P from combustion sources in addition to that from anthropogenic activities and wildfires, and com-paring the effects of desert dust and combustion inputs of phosphate on the marine surface nutrient and biogeochemi-cal budgets.
2 Methods
We use mass deposition outputs from the global atmospheric model LMDz-INCA (Hauglustaine et al., 2014; Wang et al., 2015a) as external sources of phosphate in the regional high-resolution coupled NEMO-MED12/PISCES model. We con-sider separately phosphorus from desert dust and from com-bustion in order to isolate their respective effects as nutrient sources.
2.1 The oceanic model
We use the regional oceanic model NEMO (Madec, 2008) at a high spatial resolution of 1/12◦over the Mediterranean
(MED12). The 1/12◦grid resolution is stretched in latitude
and ranges between 6 km at 46◦N and 8 km at 30◦N. This
fine-scale resolution enables us to represent important fea-tures of the Mediterranean circulation that are small eddies. This grid has 75 unevenly spaced vertical layers, with depth ranging from 1 to 134 m from the surface to the bottom, and 10 levels in the first 100 m. The oceanic domain covers all the Mediterranean and a part of the Atlantic between the Strait of Gibraltar and 11◦W called the buffer zone. The
to force the PISCES model is NM12-FREE, evaluated in Ha-mon et al. (2015). Atmospheric forcing conditions are pre-scribed from the ALDERA data set (Hamon et al., 2015). Temperature and salinity are relaxed monthly to climatolo-gies in the buffer zone (Fichaut et al., 2003). This simulation reproduces the general circulation and variability of the water masses’ characteristics well. However, Hamon et al. (2015) identify some shortcomings: transports through the Strait of Gibraltar are underestimated by about 0.1 Sv, the circulation and mesoscale activity in the western basin (Algerian cur-rent, Northern current) are underestimated, and positive tem-poral drifts in the heat and salt content occur in the inter-mediate layer all over the Mediterranean Sea. This may lead to overestimation in temperature and salinity in intermedi-ate wintermedi-aters after long simulation periods (hundreds of years). The ability of the model to reproduce the general circulation of the water masses was also evaluated in a similar configura-tion with CFCs (chlorofluorocarbons) (Palmiéri et al., 2015), neodymium (Ayache et al., 2016), tritium–helium-3 (Ayache et al., 2015) and14C (Ayache et al., 2017). These evaluations showed that the NEMO model is able to produce satisfying results when studying characteristics such as calculation of the age of water masses using tracers such as CFCs.
The biogeochemical model PISCES (Aumont et al., 2015) is coupled to the physical model. The regional coupled configuration NEMO-MED12/PISCES was developed by Palmiéri (2014) and Richon et al. (2017). Only two trophic levels are explicitly represented in PISCES: phytoplankton (autotrophic) and zooplankton (heterotrophic). Each plank-ton type is composed of two size classes: nanophytoplank-ton and diatoms; microzooplanknanophytoplank-ton and mesozooplanknanophytoplank-ton. PISCES is a Redfieldian model: the C : N : P ratio used for plankton growth is fixed to 122 : 16 : 1. In PISCES, nutrient uptake (nitrate, ammonium, silicate, iron and phosphate) is governed by a Monod-type model (Monod, 1958). The con-centration of nutrients is linked to phytoplankton productiv-ity and chlorophyll a production according to the equations described in Aumont et al. (2015). Phytoplankton growth rate is dependent on nutrient concentrations via the growth-limiting factors (see Aumont et al., 2015, for detailed equa-tions). We prescribe riverine nutrients’ input fluxes from the estimation of (Ludwig et al., 2009) that accounts for the nu-trient fluxes from 239 rivers around the Mediterranean and Black Sea obtained from measurements and model data. The estimations of riverine fluxes are not available after 2000. Therefore, we use the riverine fluxes from the year 2000 in our study. Nutrient concentrations in the buffer zone are re-laxed to the monthly climatology of the World Ocean Atlas (WOA) (Locarnini et al., 2006). Nutrient fluxes from the At-lantic are computed in the model as the product of the nutri-ent concnutri-entrations in the buffer zone times the water fluxes through the Strait of Gibraltar.
The model is run in offline mode like in the studies per-formed by Palmiéri et al. (2015), Guyennon et al. (2015), Ayache et al. (2015), Ayache et al. (2016), Ayache et al.
(2017) and Richon et al. (2017). PISCES biogeochemical tracers are transported using an advection–diffusion scheme driven by dynamical variables (velocities, pressure, mix-ing coefficients) previously calculated by the oceanic model NEMO. Biogeochemical characteristics of the latest version of the NEMO-MED12/PISCES model are evaluated in Ri-chon et al. (2017). In particular, NEMO-MED12/PISCES produces well the west-to-east gradient of productivity when compared to satellite chlorophyll a estimates and simulates the main productive zones located in the Alboran Sea, the Gulf of Lion and most coastal areas but with a lower ampli-tude (see Fig. 1 and Table 1). We filtered out chlorophyll a values in coastal areas (Bosc et al., 2004). The vertical distri-bution of nutrients is well simulated on a global scale, despite a too-sharp nutricline in the intermediate waters in some sub-basins (e.g., Alboran, south Ionian).
Additional statistical indicators provided in Appendix A show a good reproduction of the nutrients and the chloro-phyll a vertical concentrations in different Mediterranean re-gions. However, the model fails to reproduce surface and in-termediate phosphate concentrations in some regions such as the south Levantine. It is important to note that the nu-trient concentrations in surface waters, especially phosphate concentrations in the ultra-oligotrophic eastern basin, are of-ten below the detection limit of measuring devices. There-fore, the negative bias in model surface concentration es-timates may be linked with measurement uncertainties. Ri-chon et al. (2017) calculated the average and SD of chloro-phyll a values measured and modeled at the DYFAMED station (Ligurian Sea) for the 1997–2005 period and found that the average measured chlorophyll a in the top 200 m is 0.290 ± 0.177 × 10⁻³g m−3and the average model value is
0.205 ± 0.111 × 10⁻³g m−3. For PO
4, the average measured
value is 0.234±0.085×10⁻³mol m−3and the modeled
aver-age is 0.167±0.179×10⁻³mol m−3. We report in Appendix
A additional figures on the comparison of modeled and mea-sured PO4and NO3concentrations. Despite some
unavoid-able shortcomings, the performances of the model are rea-sonable for conducting our scientific investigation.
2.2 Atmospheric deposition of phosphate
The objective of this study is to use consistent atmospheric phosphate inputs from contrasted sources simulated by the same atmospheric model. Hence, we selected daily atmo-spheric deposition fields of total phosphorus (P) from nat-ural dust and combustion both simulated with the LMDz-INCA chemistry–climate global model (Wang et al., 2015b). This global model has a rather low spatial resolution of 0.94◦
in latitude × 1.28◦in longitude. The daily deposition fluxes
from these two sources have been simulated globally solely for a 1-year period (2005). The form of deposited phospho-rus in the model is the same for all sources and is considered to be soluble phosphate (PO3−4 ), which is the bioavailable form of phosphorus in PISCES (Aumont and Bopp, 2006).
Figure 1.Satellite map of average surface chlorophyll a concentration from Bosc et al. (2004) (1997–2004, a) and modeled average surface chlorophyll a concentration (b). Model and satellite data are filtered for coastal waters (white areas). Additional white areas on the satellite maps represent a lack of data.
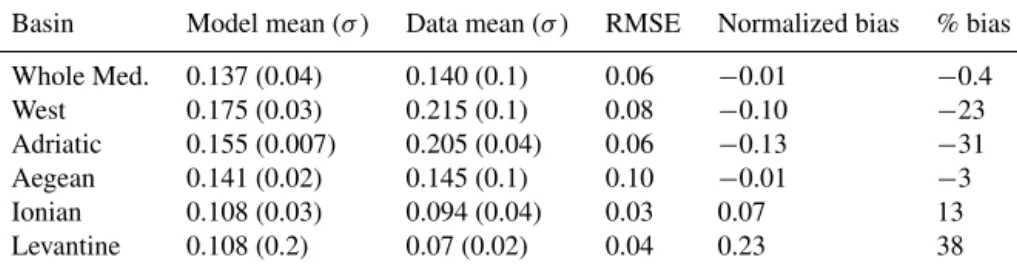
Table 1.Average chlorophyll a concentration (spatial SD in brackets) and statistical indicators (spatial RMSE, normalized and relative bias) for different Mediterranean sub-basins (see Fig. 5 for the sub-basin limits). Values are calculated from Fig. 1. Coastal areas are filtered out as in Fig. 1.
Basin Model mean (σ ) Data mean (σ ) RMSE Normalized bias % bias
Whole Med. 0.137 (0.04) 0.140 (0.1) 0.06 −0.01 −0.4 West 0.175 (0.03) 0.215 (0.1) 0.08 −0.10 −23 Adriatic 0.155 (0.007) 0.205 (0.04) 0.06 −0.13 −31 Aegean 0.141 (0.02) 0.145 (0.1) 0.10 −0.01 −3 Ionian 0.108 (0.03) 0.094 (0.04) 0.03 0.07 13 Levantine 0.108 (0.2) 0.07 (0.02) 0.04 0.23 38
We considered that given the high spatial and temporal vari-ability of atmospheric deposition fluxes, a monthly resolu-tion of deposiresolu-tion, as available for other years (Wang et al., 2017), would be a too-strong and unnecessary limitation in simulating the biogeochemical response.
In this study, we first include natural desert dust as a source of phosphorus. In the atmospheric model, desert dust emis-sions are computed every 6 h using the European Centre for Medium-Range Weather Forecasts (ECMWF) wind data in-terpolated to the LMDz grid. Following Mahowald et al. (2008), we consider that only 10 % of phosphorus from desert dust is bioavailable PO4(hereafter named Pdust). This
solubility value has also been used by other authors (see also Anderson et al., 2010). Izquierdo et al. (2012) report an aver-age solubility of phosphorus of about 11 % in African dust-loaded rains in northeast Spain. In addition, the daily total dust deposition simulated with similar forcings on a 1.27◦in
latitude by 2.5◦ in longitude grid is available for the period
1997–2012. We used this time series of total dust deposition to compare the year 2005 with the average inter-annual de-position flux. We found that the yearly average dede-position of dust from 2005 is close to the multi-year depositional aver-age (not shown).
The second source of atmospheric phosphorus is combus-tion. Here, the term combustion entails anthropogenic
com-bustion from energy production, biofuels, and wildfires emis-sions (hereafter named Pcomb). The Pcomb deposition fields used here were obtained from a different simulation per-formed with the same model LMDz-INCA on a coarser grid resolution than those for Pdust of 1.27◦in latitude by 2.5◦in
longitude. In the atmospheric model, phosphorus emissions from combustion due to anthropogenic activities are assumed constant throughout the year 2005; only wildfire emissions vary monthly based on the GFED 4.1 data set for biomass burning (van der Werf et al., 2010). According to this data set, wildfire emissions around the Mediterranean for 2005 are close to the inter-annual average for the period 1997–2009. Wang et al. (2015a) estimated global Pcomb emissions based on the consumption of different fuels (including wildfires) and the P content in all types of fuels for more than 222 coun-tries and territories. We consider that 54 % of the total emit-ted P from combustion is bioavailable phosphate (Pcomb) (Longo et al., 2014). Up to now, there are at least two ma-jor model-based data sets of Pcomb deposition. Mahowald et al. (2008) had published the first map of P deposition from combustion sources based on a bottom-up P emission inven-tory, which leads to a general agreement of their globally modeled surface P concentrations with measurements with a large underestimation in the modeled P deposition. Wang et al. (2015a, 2017) revised the emission factors from all
Figure 2. Plot of yearly average Pcomb deposition over the Mediterranean for the 1997–2012 period.
fuel types burned during combustion to come up with a new global inventory of phosphorus emitted from coal, biofuels and biomass burning. This inventory amounts to an emission of P from these three sources of 1.96 Tg P yr−1for the year
1996 (Wang et al., 2015a), which is 28 times the inventory of 0.070 Tg P yr−1compiled by Mahowald et al. (2008) for
the same year. The same authors (Wang et al., 2015a) eval-uated both P surface concentrations and P deposition from LMDz-INCA and showed no systematic bias against mea-surements taken at the global scale. In general, the LMDz-INCA modeled atmospheric P deposition fluxes have been evaluated globally by comparing time series of deposition measurements showing a significantly reduced model bias relative to observations when considering the contribution of P emissions from combustion than when considering only P from dust (Fig. 4 in Wang et al., 2015a). However, it should be noted that there were only three sites with time series of P deposition over the Mediterranean region.
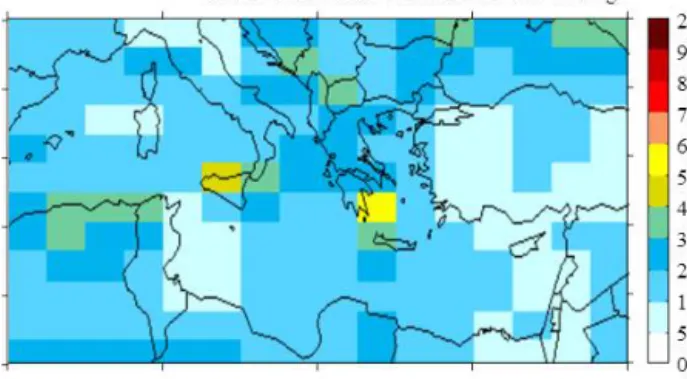
In order to assess inter-annual variability of the Pcomb de-position, Fig. 2 shows the annual average Pcomb deposition over the Mediterranean for the 1997–2012 period. Figure 3 shows the SD to average ratio of Pcomb deposition over the Mediterranean computed from LMDz-INCA for the 1997– 2012 period. These figures show that Pcomb deposition has low inter-annual variability. Therefore, 2005 can be consid-ered as a study year because both Pcomb and Pdust deposi-tion are close to the inter-annual average for the 1997–2012 period.
Another important input of P aerosols in this region is from sea spray (Querol et al., 2009; Grythe et al., 2014; Schwier et al., 2015). Sea spray aerosols over the Mediter-ranean mainly come from the MediterMediter-ranean itself with little contribution from the Atlantic Ocean. Therefore, the net con-tribution of P from sea spray is considered negligible in our simulations.
Active volcanoes around the Mediterranean such as the Etna or the Stromboli are another potential source for
Figure 3.Map of the SD to average ratio of Pcomb deposition over the Mediterranean for the 1997–2012 period.
aerosols. Phosphorus mass in volcanic aerosols is very low (P. Allard, personal communication) although it is consid-ered to be almost entirely soluble (Mahowald et al., 2008). Finally, the 85 million hectares of forest around the Mediter-ranean are a potential source of biogenic particles such as pollen and vegetal debris (Minero et al., 1998) that contain phosphorus. The total mass flux of phosphorus from biogenic particles seems to be important on the global atmospheric phosphorus budget (Wang et al., 2015a). It is not included in our study, which can be seen as a potential limitation. How-ever, biogenic particles have very low solubility in seawater (Mahowald et al., 2008). The LMDz-INCA model provides the summed bulk deposition of both phosphorus from volca-noes and biogenic particles (named PBAP, primary biogenic aerosol particles). We chose to discard PBAP as a source of P since these 2 contrasted sources have very different solu-bilities but cannot be apportioned within PBAP.
2.3 Simulation setup
We ran NEMO-MED12/PISCES for 1 year with the 2005 physical and biogeochemical forcings. Initial conditions at the end of 2004 are taken from the 1997–2012 simulation described in Richon et al. (2017) including anthropogenic ni-trogen deposition (“N” simulation). The reference simulation (REF) is a simulation performed with no atmospheric depo-sition of phosphate as described in Richon et al. (2017).
We investigate the impacts of each source of PO4
by performing two different simulations: “PDUST” and “PCOMB”; they include, respectively, natural dust only and combustion-generated aerosol only as atmospheric sources of PO4. We also performed a “total P” simulation with the
two sources included. From now on, we use total P to indicate the sum of bioavailable phosphate from dust and combus-tion (Pdust + Pcomb). The results presented in this study are based on the relative differences between the simulations. For instance, the impacts of Pdust are calculated as the difference between PDUST and REF simulations (PDUST − REF).
3 Results
3.1 Evaluation of P deposition fluxes
Very few measurements of atmospheric phosphorus deposi-tion exist over the Mediterranean region. Moreover, it is dif-ficult to apportion between different sources when analyzing bulk deposition samples. We did not find any available time series of total phosphorus deposition in the Mediterranean covering our simulation period. Therefore, we compare the monthly P deposition flux from LMDz-INCA with the non-time-consistent monthly fluxes over years as close as possi-ble to 2005. Estimates of Turquety et al. (2014) indicate that 2005 is not an exceptional year for fires and the time series of natural dust deposition modeled with LMDz-INCA indicate that the deposition flux of 2005 is close to the inter-annual average (not shown). We used the time series of phosphorus measured at nine different stations over the Mediterranean from the ADIOS campaign (Guieu et al., 2010) and the sol-uble phosphate from deposition measurements at two sta-tions in the south of France from the MOOSE campaign (de Fommervault et al., 2015). The ADIOS time series cover June 2001 to May 2002 and the sampling sites cover almost all regions of the basin. The MOOSE time series cover 2007 to 2012. We use the time series of average monthly flux in 10−6g PO
4m−2month−1and compare it with our model
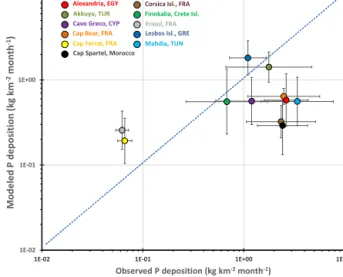
av-erage monthly fluxes in the grid cells corresponding to the stations. Figure 4 shows the comparison between modeled and measured fluxes in terms of geometric means and SDs of monthly values of each time series. The fluxes are highly variable according to the station and the season (variability spans over several orders of magnitudes). Our comparison must be taken with caution since we compare different years in the model and the observations.
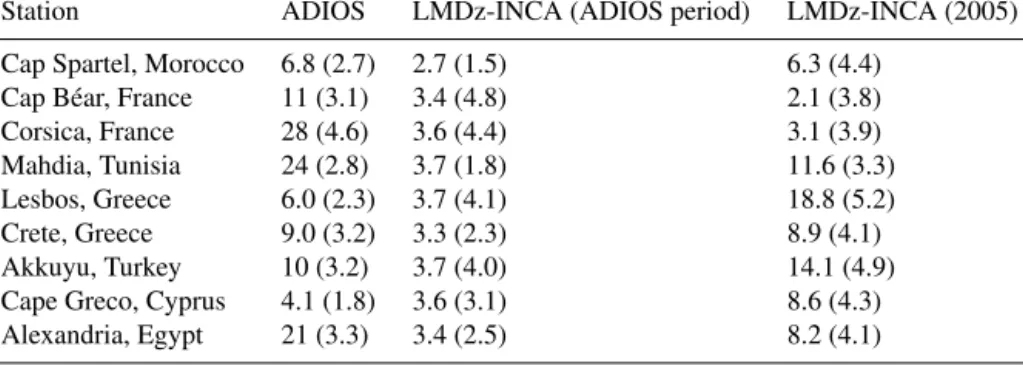
We were able to compare the dust deposition flux modeled with LMDz-INCA used to derive Pdust deposition over the ADIOS sampling period with the measurements. The com-parison is shown in Table 2. The dust fluxes produced by the model at several stations are realistic, in spite of the low spa-tial variability from the dust fluxes produced by the global model LMDz-INCA even though the geometric SDs of the fluxes can be regionally very high. In Table 2 the dust depo-sition fluxes for the period 2001–2002, corresponding to the ADIOS campaign, are based on model outputs with a lower resolution (1.27◦in latitude by 2.5◦in longitude) than those
for the year 2005 (0.94◦in latitude by 1.28◦ in longitude).
As stated by Bouet et al. (2012), dust emission (and hence its deposition) is highly sensitive to model resolution. The coarse resolution of LMDz may significantly reduce the total dust emission in the model but also reduce surface winds and aerosol transport (see the Discussion section). Therefore, the coarse resolution of the dust model used in Table 2 for 2001– 2002 may explain the underestimation and the lack of spa-tial variability from the model. We also noted a better
agree-Corsica Isl., FRA
Cap Spartel, Morocco
Cap Bear, FRA
Mahdia, TUN
Finokalia, Crete Isl.
Lesbos Isl., GRE Akkuyu, TUR
Cavo Greco, CYP Alexandria, EGY
Cap Ferrat, FRA
Frioul, FRA
1E-02 1E-01 1E+00 1E+01
1E-02 1E-01 1E+00 1E+01
Mod e le d P d e p os itio n (kg km -2 month -1)
Observed P deposition (kg km-2 month-1)
Figure 4.Comparison of modeled and observed monthly geomet-ric mean of total P (Pdust + Pcomb) deposition fluxes at the nine ADIOS stations (Guieu et al., 2010) and soluble PO4 at Frioul and Cap Ferrat stations (de Fommervault et al., 2015). Each point is the geometric mean of monthly observed and modeled values at the given station over 1 year, namely 2005 for the model and June 2001–May 2002 for the ADIOS observations (only 6 values are available at Alexandria to compute the observed mean and SD, 10 at Mahdia, and 11 at Finokalia) and between 2007 and 2012 for the observations at Frioul and Cap Ferrat stations. Error bars repre-sent the geometric SD on model (y axis) and measurements (x axis).
ment (within a factor of 2) at the four stations of the eastern Mediterranean (Cyprus, the Greek islands and Turkey).
In order to assess properly the performance of the atmo-spheric model in reproducing deposition fluxes, we would need continuous times series of deposition in different sta-tions over the Mediterranean and simulasta-tions covering the measurement periods. Our comparison is at the moment the most feasible evaluation with the existing data over the Mediterranean. This diagnostic reveals that the model prob-ably tends to underestimate the P deposition from both dust and anthropogenic sources. These results are consistent with Wang et al. (2015a). The underestimation of total P deposi-tion is also likely due in part to our omission of P from other potential sources such as PBAP and sea salt.
3.2 Characterization of phosphate deposition from the different sources
The 2005 seasonal spatial distribution of the Pdust deposi-tion is shown in Fig. 5. Pdust deposideposi-tion is highly variable in space and time. It is maximal in spring (MAM). In this sea-son, the main dust source is the Sahara and it affects mostly the eastern basin (Moulin et al., 1998). In winter (DJF), the influence of dust from the Middle East is observed (Basart et al., 2012). In summer (JJA) and autumn (SON), the de-position is at its minimum and located close to the
south-Table 2.Dust deposition fluxes (g m−2yr−1) measured during the ADIOS campaign (derived from Al-measured deposition fluxes consid-ering that dust contains 7 % of Al), simulated by the LMDz-INCA model on the ADIOS period (June 2001–May 2002) and the simulation period (2005). Values in brackets indicate the geometric SDs of monthly fluxes (same restrictions on the number of values as in Fig. 4).
Station ADIOS LMDz-INCA (ADIOS period) LMDz-INCA (2005)
Cap Spartel, Morocco 6.8 (2.7) 2.7 (1.5) 6.3 (4.4)
Cap Béar, France 11 (3.1) 3.4 (4.8) 2.1 (3.8)
Corsica, France 28 (4.6) 3.6 (4.4) 3.1 (3.9)
Mahdia, Tunisia 24 (2.8) 3.7 (1.8) 11.6 (3.3)
Lesbos, Greece 6.0 (2.3) 3.7 (4.1) 18.8 (5.2)
Crete, Greece 9.0 (3.2) 3.3 (2.3) 8.9 (4.1)
Akkuyu, Turkey 10 (3.2) 3.7 (4.0) 14.1 (4.9)
Cape Greco, Cyprus 4.1 (1.8) 3.6 (3.1) 8.6 (4.3)
Alexandria, Egypt 21 (3.3) 3.4 (2.5) 8.2 (4.1)
ern Ionian coasts. Average deposition flux over the basin is 0.122 × 10⁹g PO
4 month−1 with notable monthly
variabil-ity (SD = 0.102 × 10⁹g PO
4month−1). This seasonal cycle
of dust deposition is similar to the one simulated by the re-gional model ALADIN-Climat (Nabat et al., 2012) used in Richon et al. (2017), but LMDz Pdust deposition flux is sig-nificantly lower than that from ALADIN (see “Discussion” section).
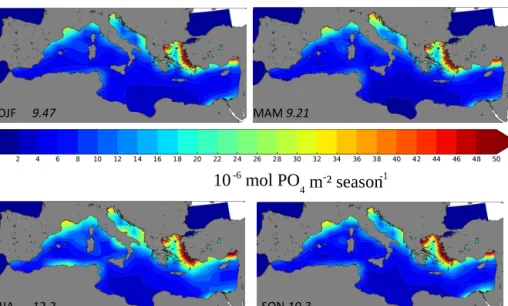
The seasonal spatial distribution of the Pcomb deposition is shown in Fig. 6. Atmospheric deposition of phosphate from combustion is on average 0.258 × 10⁹g PO4month−1
over the entire basin. It amounts to twice the atmo-spheric deposition of phosphate from desert dust (0.122 × 10⁹g PO
4month−1). The seasonal variability of Pcomb
de-position is lower than for Pdust (SD of Pcomb = 0.046 × 10⁹g PO
4month−1). This is linked to the anthropogenic
na-ture of Pcomb emissions and the low contribution of atmo-spheric transport to seasonal variability. Maximal deposition occurs in summer, likely due to the forest fires around the Mediterranean. In particular, we observe higher deposition close to the Algerian, Spanish and Italian coasts in sum-mer. These countries are particularly subject to dry and hot summer conditions that favor forest fires (Turquety et al., 2014). We observe a high spatial variability in the deposi-tion field with a north-to-south decreasing gradient in depo-sition, the major part of total mass being deposited close to the coasts, especially in the Aegean Sea. The presence of many industrial areas around the Adriatic and Aegean ex-plains the high deposition fluxes observed in these regions. In the Aegean Sea, Pcomb deposition constitutes a more than four times greater phosphate source than desert dust (respectively 0.0529 × 10⁹and 0.0118 × 10⁹g PO
4month−1
for Pcomb and Pdust average deposition). According to our model forcings, for which uncertainties are still large, the riverine inputs would constitute the main phosphate source to the Mediterranean Basin (3.16×10⁹g PO4month−1at the
basin scale). These inputs alone account for over 85 % of the total (atmospheric + riverine input + Strait of Gibraltar) as documented in Table 3.
Figure 7a illustrates that combustion is the dominant source of atmospheric phosphate to the Mediterranean Basin for the year 2005. This map shows the average proportion of Pdust in total phosphorus deposition (Pdust + Pcomb). The results indicate that Pdust accounts for 30 % of phospho-rus deposition on average in 2005 at the basin scale and is only dominant along the southern Mediterranean coast, in the Gulf of Libya. This map highlights the contrasted ar-eas influenced by the different atmospheric P sources. The north of the basin is primarily under the influence of combus-tion aerosol sources, and the south of the basin is under the influence of dust aerosol sources. Evaluation of deposition fluxes for the period 1997–2012 (for which monthly deposi-tion fluxes are available) shows a continuous dominance of Pcomb fluxes at the basin scale (see Fig. 7b). These results agree with the ones of Desboeufs et al. (2018) who noted that combustion aerosols are responsible for 85 % of P de-position in the northwestern coast of Corsica over a 3-year period (2008–2011) vs. 15 % of P from dust.
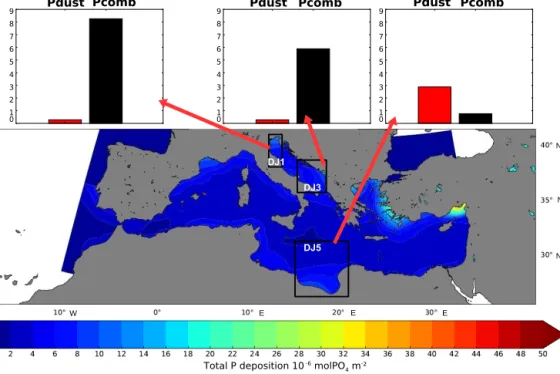
Figure 8 shows the contrasted contribution of the respec-tive fluxes for the month of June 2005. Our previous study showed that June is the period of most important impacts from aerosol deposition on surface marine productivity in spite of the low fluxes, due to thermal stratification (Richon et al., 2017). The relative contribution of Pdust and Pcomb deposition fluxes are compared over three regions: the north Adriatic, the south Adriatic and the south Ionian (See Fig. 5). We defined these regions as in Manca et al. (2004). They were selected as they highlight three contrasted conditions. The north Adriatic is under strong influence of both river-ine inputs and atmospheric deposition of P from combustion (Fig. 8); the south Adriatic encompasses atmospheric coastal deposition but is distant from major riverine inputs; and the south Ionian is a deep, highly oligotrophic area. The depo-sition flux of Pcomb is maximal in the northern Adriatic. In this basin, the Pcomb flux is five times higher than Pdust. However, Pdust deposition flux increases towards the south to reach a value 3 times higher than the Pcomb flux upon
10
-6mol PO
4m
-² season
-1 DJF 5.28 JJA 1.41 MAM 9.28 SON 2.04 West Ionian Adriatic Aegean Levantine DJ1 DJ3 DJ5Figure 5.Total seasonal desert-dust-derived soluble phosphorus deposition (Pdust, in 10−6mol PO4m−2season−1) over each season of the year 2005 (molar flux is calculated as mass flux/phosphorus molar weight) from the LMDz-INCA model. Numbers on the maps are the average seasonal deposition fluxes over the whole basin in 10−6mol PO
4m−2season−1. In the Summer (JJA) deposition map, we display the different subregions referred to in the text. In the autumn (SON) map, we display subregions as defined in Manca et al. (2004): DJ1 is the north Adriatic region, DJ3 is the south Adriatic region and DJ5 is the south Ionian region.
10
-6mol PO
4m
-² season
-1 MAM 9.21 DJF 9.47 JJA 12.2 SON 10.3Figure 6.Total seasonal combustion-derived soluble phosphorus deposition (Pcomb in 10−6mol PO4m−2season−1) over each season of the year 2005 (molar flux is calculated as mass flux/phosphorus molar weight) from the LMDz-INCA model. Numbers on the maps are the average seasonal deposition fluxes over the basin in 10−6mol PO
4m−2season−1.
reaching the southern Ionian coasts. This spatial distribution of deposition is also found by Myriokefalitakis et al. (2016). By including different sources of atmospheric phosphate from the same model, we can compare the relative contri-bution of each atmospheric source with the other external nutrient suppliers (rivers and Gibraltar). Table 3 shows the relative contribution simulated by the model of atmospheric
phosphate sources in total external phosphate supply to the Mediterranean basins. Our estimations of total aerosol con-tribution to PO4supply are slightly lower than the literature
values. Table 3 shows that, in the model, Pcomb is dominant over Pdust as a source of atmospheric phosphate at the basin scale for the year 2005. This dominance is found in all re-gions of the Mediterranean, except in the Ionian Sea where
Table 3. Relative atmospheric contribution (%) to total PO4 supply in different sub-basins (atmospheric inputs / (atmospheric in-puts + riverine inin-puts + Gibraltar inin-puts)) according to the model. The values in parentheses show the minimum and maximum monthly contributions over the year when variability is more than 3 %. The sub-basins are described in Fig. 5. Values from Krom et al. (2010) also include river inputs.
Basin Total P Pdust Pcomb Reference
East 28 Krom et al. (2010)
Whole Med. 11 (9–21) 3.6 (1–10) 7.5 (5–11) This work
West 9 (6–15) 1.7 (0–5) 7.3 (5–11) This work
Adriatic 6 (4–16) 0.97 (0–5) 5.1 This work
Aegean 11 2.0 (0–5) 9.0 (6–11) This work
Ionian 40 (27–71) 20 (5–60) 20 (10–33) This work
Levantine 11 (7–18) 4.3 (1–14) 7 (4–10) This work
(a) 2005 average (b) 1997–2012 average
Figure 7.Map of average Pdust proportion in total P deposition for 2005 (a) and 1997–2012 (b). The black line on the right map represents the 50 % Pdust proportion limit on the average of 1997–2012.
Pdust and Pcomb contributions are equivalent. We note that the estimates from Krom et al. (2010) were calculated by ex-trapolating to the eastern basin measurements from very few locations in Turkey and Greece. Vincent et al. (2016) report that recent desert dust deposition fluxes have decreased in the 2010s by an order of magnitude compared to the 1980s that Krom et al. (2010) refer in part to. This may explain that we find combustion to be a more important source of atmospheric phosphate at the basin scale in 2005 in com-parison to natural dust. In the pelagic Ionian basin, Pdust and Pcomb contributions are comparable on a yearly aver-age (20 %). However, combustion represents at most a third of the contribution whereas dust-derived phosphate deposi-tion is more seasonally variable and can be the major source of PO4for this basin during spring (contribution of Pdust to
PO4supply up to 60 %).
3.3 Impacts of atmospheric deposition on marine surface phosphate
Atmospheric deposition of phosphate aerosol has different impacts in the model on PO4concentration depending on the
source, the location and the period of the year. The impacts
of deposition depend on the flux and the underlying biogeo-chemical conditions in the water column. Even though the deposition fluxes are very low during the stratified season, their relative impacts are maximal because the major part of the Mediterranean is highly limited in nutrients (Richon et al., 2017).
Figure 9 shows the relative impacts of phosphate depo-sition from the two sources (combustion and dust) on sur-face PO4concentration for the month of June 2005. We can
distinguish three different responses to nutrient deposition: two non-responsive zones that are either not nutrient lim-ited or limlim-ited in more than one nutrient and a responsive zone limited in the deposited nutrient. In the regions under riverine input influence such as the north Adriatic, relative impacts of atmospheric deposition are low even though the fluxes of Pcomb are maximal because the Po river delivers high amounts of nutrients in this area. In very unproductive regions such as the south Ionian basin, we observe very low impacts of deposition on PO4concentrations (between 5 and
12 % enhancement close to the Libyan coast). This basin is highly depleted in nutrients, especially in summer. But the deposition fluxes are very low (90 × 10−6mol m−2 of total
Total P deposition 10 -6 molPO4 m-² 0 1 2 3 4 5 6 7 8 9 0 1 2 3 4 5 6 7 8 9 0 1 2 3 4 5 6 7 8 9
Pdust Pcomb Pdust Pcomb Pdust Pcomb
DJ1 DJ3 DJ5 N N N E E E W
Figure 8.Map of total PO4deposition from both Pdust and Pcomb (10−6mol PO4m−2) for June 2005. Red and black bars represent average PO4deposition (in 10−6mol PO
4m−2) from the two sources in each framed area. The limits of the areas are described in Manca et al. (2004) and Fig. 5. There is no atmospheric deposition modeled in the Marmara and Black seas.
very fast and do not yield a strong concentration enhance-ment. Finally, some areas respond strongly to phosphate de-position. We observe PO4 surface enhancement over 40 %
in the south Adriatic, Tyrrhenian and north Aegean basins. These regions are under some nutrient sources’ influence; they are not fully pelagic and receive nutrients from coasts or upwelling (Strait of Sicily front). The high response to phosphate deposition indicates that these regions are primar-ily P-depleted.
These contrasted results indicate that the relative impacts of atmospheric deposition from different sources are depen-dent on both the underlying phosphate concentration and the bioavailable phosphate deposition flux. The relative biogeo-chemical impacts of PO4deposition are variable due to the
biogeochemical state of the region.
3.4 Biogeochemical impacts of P deposition
In the PISCES model, atmospheric deposition of nutrient is treated as an external forcing. The effects of the different aerosols on the Mediterranean biogeochemistry are consid-ered simply additive. Fluxes of nutrients are added to the total pool of dissolved nutrients according to their deposition flux and chemical properties (fixed solubility and chemical com-position). The effects of total P deposition on marine biogeo-chemistry are a combination of effects of the two P sources in this model version (Table 3).
We focus here on the month of June which shows the maximum impacts of deposition because of surface water
stratification. Figure 10 shows the average relative effects of P deposition on surface chlorophyll a. The relative effects of total P deposition on surface chlorophyll a concentration are modest. The majority of Pdust effects on surface chloro-phyll a are in the southwestern basin along the Algerian coasts. Pcomb has maximal impacts in the north of the basin, in areas of high deposition. However, Pcomb also affects the area influenced by Pdust in the south. In this Redfieldian ver-sion of PISCES, chlorophyll a production is linked with nu-trient uptake that is constrained by the Redfield ratio. There-fore, the addition of excess nutrients will enhance chloro-phyll a production as long as other nutrients are bioavailable in the Redfield proportions.
Figure 11 shows the relative impacts of phosphate depo-sition from the two sources on surface total primary produc-tivity for the month of June. We observe that combustion-derived phosphate has the greatest impacts on surface biolog-ical production: averaged regionally over the framed areas, the enhancement in daily primary productivity is between 1 and 10 % but local maxima are up to 30 %.
The effects of atmospheric phosphate deposition are vari-able according to the source type. As for chlorophyll a, dust-derived phosphate deposition has maximal impacts in the southern part of the basin close to the Algerian and Tunisian coasts. The relative impacts of Pdust deposition in the south Ionian basin are very low (about 1.7 %). This region of the Mediterranean is highly oligotrophic and lacks all major nu-trients, especially in summer. Nutrient co-limitations
associ-30° N 35° N 40° N 10° W 5° W 0° 5° E 10° E 15° E 20° E 25° E 30° E 35° E 0 2 4 6 8 10 12 14 16 18 20 22 24 26 28 30 32 34 36 38 40 % 0 5 10 15 20 25 % 0 5 10 15 20 25 % 0 5 10 15 20 25 %
Pdust Pcomb Pdust Pcomb Pdust Pcomb
DJ1 DJ3
DJ5
Figure 9.Map of maximal relative effects of total (Pdust + Pcomb) deposition in June 2005 (on a daily basis) on the surface phosphate con-centration (0–10 m). The reference PO4concentration values are taken from the REF simulation without atmospheric phosphate deposition. Red and black bars represent average relative effects (%) within the framed areas for each P source. The limits of the areas are described in Manca et al. (2004) and Fig. 5. There is no atmospheric deposition modeled in the Marmara and Black seas.
Figure 10.Average relative effects of total P, Pdust and Pcomb deposition on surface (0–10 m) chlorophyll a concentration for June 2005. There is no atmospheric deposition modeled in the Marmara and Black seas.
ated with minimal Pdust deposition flux in summer explain
0 2 4 6 8 10 12 % 0 1 2 3 4 5 6 7 8 9 10 11 12 13 14 15 16 17 18 19 20 21 22 23 24 25 26 27 28 29 30 % 0 4 6 8 10 12 % 0 2 4 6 8 10 12 %
Pdust Pcomb Pdust Pcomb Pdust Pcomb
DJ1 DJ3 DJ5 30° N 35° N 40° N 10° W 5° W 0° 5° E 10° E 15° E 20° E 25° E 30° E 35° E
Figure 11.Map of maximal relative effects of total (Pdust + Pcomb) deposition on primary production in the surface Mediterranean (0– 10 m) in June 2005 (on a daily basis). The reference primary production concentration values are taken from the REF simulation without atmospheric phosphate deposition. Bar plots represent average relative effects of each source (%) within the framed areas excluding land. The limits of the areas are described in Manca et al. (2004). There is no atmospheric deposition modeled in the Marmara and Black seas.
atic, the relative impacts of Pcomb deposition are lower than in the southern Adriatic because the proximity of riverine in-puts in the north reduces the relative importance of atmo-spheric deposition in nutrient supply. The north of the Adri-atic is generally productive all year long. We can identify in Fig. 11 the area in the Adriatic influenced by riverine in-puts. This zone encompasses the north of the Adriatic and the western coast down to the region of Bari (40◦N, 17◦E).
In this area, atmospheric deposition has low influence on pri-mary productivity (below 15 %). This is in contrast with the southeastern part of the Adriatic under low riverine input in-fluence. There, we observe high impacts of atmospheric de-position and especially of Pcomb on primary productivity (11 % on average but up to 50 % daily enhancement at some points). Pcomb and Pdust have similar influences over the south of the basin.
In general, we can identify three different biogeochemi-cal responses in the three areas indicated in Fig. 11. Our hy-pothesis is that the different responses are linked to nutrient limitations. In the north Adriatic, the influence of coastal nu-trient inputs leads to low nunu-trient limitation and high produc-tivity. In the south Adriatic, the high impact of atmospheric phosphate deposition may be the sign of important phosphate limitation. Finally, the lack of response in the south Ionian in spite of the atmospheric phosphate deposition probably indi-cates that the region is co-limited in P and N.
As for the effects on PO4concentration, we observe
differ-ent impacts of P deposition on primary production according to the nutrient status of the region. We find very low depo-sition impacts in nutrient-replete areas (e.g., north Adriatic), very low to no response in highly nutrient limited areas such as the south Ionian and high response in areas limited by phosphorus only (e.g., south Adriatic).
4 Discussion
In contrast to the global ocean, combustion appears as an im-portant source of atmospheric bioavailable phosphorus to the surface waters of the Mediterranean Sea due to the proxim-ity of populated and forested areas. Based on our large-scale LMDz-INCA model, we estimate that combustion is respon-sible for 7 % on average of total PO4 supply. In
compari-son, the average contribution of Pdust to PO4supply is 4 %
(Table 3). These estimates are based on our modeling val-ues and take into account only the sources of phosphate that are included in the simulations (namely rivers, Atlantic in-puts, and natural and combustion-derived atmospheric phos-phate). This provides an estimation of the relative importance of the two atmospheric sources under the specific conditions of the year 2005, but the restriction to only this particular year limits our conclusions. For this reason, the purpose of this study is to raise questions on the relative importance of
the various aerosol sources that border the Mediterranean and their potential impacts on the nutrient supply and bi-ological productivity of the basin. Saharan dust is a major source of particles in the Mediterranean (D’Almedia, 1986; Loÿe-Pilot et al., 1986) and does have an impact on the re-gional climate system (Nabat et al., 2012, 2015). The liter-ature on Mediterranean aerosols is often centered on Saha-ran dust deposition, which is believed to have the largest im-pact on the basin’s biogeochemistry (e.g., Bergametti et al., 1992; Migon and Sandroni, 1999; Aghnatios et al., 2014). This study provides the first Mediterranean assessment of the contribution of another source of atmospheric phosphate than dust. It highlights that other sources, namely combus-tion, might be a dominant source of bioavailable phosphorus to Mediterranean surface waters.
The relative dominance of combustion over dust as a source of phosphate for the Mediterranean is confirmed by the analysis of monthly modeled deposition fluxes of Pdust and Pcomb over the 1997–2012 period (see Fig. 7). Pcomb dominates Pdust contribution to PO4supply over the
north-ern basin (Adriatic and Aegean seas in particular). For these regions in the vicinity of anthropogenic sources, Pcomb de-position has a low variability, whereas Pdust dede-position oc-curs during transient events and is therefore highly variable on a monthly basis. This was already noticed by Bergametti et al. (1989) and Gkikas et al. (2016), who describe the majority of dust as occurring in a few episodic deposition events, whereas anthropogenic aerosols have a more constant flux. These results are also coherent with Rea et al. (2015), who estimate anthropogenic emissions to be the main com-ponent of PM2.5(particulate matter with diameter < 2.5 µm)
and dust to be the main component of PM10 (particulate
matter with diameter < 10 µm) over the Mediterranean. The maximal contribution of atmospheric deposition to PO4
bud-gets is observed in spring, when the deposition fluxes are maximal. In summer, the relative contribution in each sub-basin is very small because the flux of Pdust is very low. The high, nearly constant fluxes of Pcomb deposited close to the coasts, especially in semi-closed sub-basins such as the Adriatic and Aegean, constitute the major source of soluble atmospheric phosphate to the surface of the Mediterranean Sea. Although total mass deposition of particulate phospho-rus from desert dust exceeds that of combustion aerosols, the latter are much more soluble than lithogenic dust. This ex-plains in our results the yearly predominance of Pcomb as a source of bioavailable phosphate. However, the underes-timation of deposition fluxes indicated by Fig. 4 limits the conclusions we can draw from our results on the relative con-tributions of the different phosphate external sources. More measurements and developments of the atmospheric model must be undertaken to make more precise assessments of the importance of atmospheric deposition as a source of nutrients for the oligotrophic Mediterranean.
The LMDz-INCA model version used in this study in-tegrates constant emissions of Pcomb from anthropogenic
sources. The variability of this deposition flux is only due to variability of atmospheric transport and deposition processes such as winds and rain or dry sedimentation. The atmo-spheric model LMDz-INCA has a low resolution given the regional Mediterranean scale: Pdust deposition forcing has 280 × 193 grid points globally and ∼500 grid points cover-ing the Mediterranean, and Pcomb forccover-ing has 144×143 grid points in total and ∼200 grid points covering the Mediter-ranean. These forcings reproduce realistic deposition pat-terns at the global scale, in spite of generally underestimat-ing the measured fluxes (Wang et al., 2017), but may not be reliable when analyzing small-scale deposition patterns. There is to our knowledge no regional Mediterranean model available that represents phosphorus deposition from both natural and anthropogenic sources. Investigating these atmo-spheric deposition fluxes from a higher-resolution regional model is a perspective that should be considered in order to strengthen our conclusions on the spatial distribution of Pdust and Pcomb influences.
Concerning the dust deposition component for which products from the resolution model exist (see the high-resolution model ALADIN-Climat used in Richon et al., 2017), the overall average deposition estimation from the global model we use in this study appears to be much lower (0.122±0.102×10⁹g month−1over the Mediterranean
in 2005 simulated with LMDz-INCA and 0.568 ± 0.322 × 10⁹g month−1simulated with ALADIN-Climat). Table 3 in
Richon et al. (2017) shows the same comparison between measured dust fluxes and the dust fluxes from the ALADIN-Climat regional model as Table 2. The fluxes reproduced by this 1/12◦resolution regional model are generally closer to
the measurements. The coarse resolution of LMDz may lead to a global underestimation of the dust emission fluxes, as shown by Bouet et al. (2012). Moreover, the higher spatial resolution of ALADIN-Climat allows one to better repro-duce intense regional winds (Lebeaupin Brossier et al., 2011) that can favor transport of continental aerosols to the remote sea. Natural dust emissions, transport and deposition to the Mediterranean are shown to be highly variable from a year to the next (e.g., Moulin et al., 1997; Laurent et al., 2008; Vin-cent et al., 2016) so that the relative contributions of Pcomb and Pdust may also vary. However, dust deposition fluxes available between 1997 and 2012 from the LMDz-INCA model indicate that 2005 is not an exceptional year (see also Fig. 7). Similarly, the inter-annual time series of dust depo-sition analyzed in Richon et al. (2017) showed that 2005 is also not an exceptional year in the ALADIN-Climat model. The recent estimate of burnt areas in the Euro-Mediterranean countries over 2003–2011 by Turquety et al. (2014) indicates a ±50 % annual variability, but it is impossible to separate anthropogenic combustion and wildfires in Pcomb deposi-tion at present. Simulating separately atmospheric deposideposi-tion from anthropogenic combustion and wildfires would give in-teresting perspectives on combustion aerosol deposition.
The reproduction of small-scale atmospheric patterns such as coastal breezes that can transport aerosols far from the coasts above the marine atmospheric boundary layer is also limited at the low spatial resolution of LMDz (Ethé et al., 2002; Lebeaupin Brossier et al., 2011). This leads to low day-to-day variability in total Pcomb deposition flux together with much larger modeled fluxes in coastal areas. Pcomb deposition is limited in the model to coastal areas. How-ever, our results indicate that Pcomb is dominant over Pdust in this instance as an atmospheric source of phosphate at the basin scale. Moreover, the atmospheric deposition model seems to underestimate phosphate deposition in most of the stations we found (see Fig. 4). Constant emission of phos-phate from anthropogenic combustion is, however, a satis-fying first approach because it permits the highlighting of the high concentration contributed from industries and major urban centers around the Mediterranean. However, more re-fined emission scenarios would be interesting to consider in future modeling studies.
Some areas receive phosphate with different contributions from different sources (Figs. 5 and 6). In particular, islands in the eastern basin such as the Greek islands, Crete and Cyprus receive phosphate from the two sources, sometimes in a sin-gle deposition event (Koulouri et al., 2008; D’Alessandro et al., 2013). Atmospheric processing of different aerosols will alter the nutrient composition and solubility of this de-position (Migon and Sandroni, 1999; Desboeufs et al., 2001; Anderson et al., 2010; Nenes et al., 2011; D’Alessandro et al., 2013). However, our study does not account for such mixing.
The atmospheric model used in our study does not pro-vide biogenic and volcanic phosphorus deposition separately. The model of Myriokefalitakis et al. (2016) allows the rep-resentation of a more complex atmospheric chemistry. This work showed that many different atmospheric P sources ex-ist. In particular, they estimate 0.195 and 0.006 Tg P yr−1
of global emissions from biogenic and volcanic sources re-spectively. In the Mediterranean region that is surrounded by many forested areas, biogenic emissions may be an impor-tant source of atmospheric phosphorus in the form of organic matter. Moreover, Kanakidou et al. (2012) show that an im-portant fraction of organic phosphorus can be emitted from combustion. In particular, the numerous forest fires occur-ring every summer in the Mediterranean region may consti-tute an important source of organic phosphorus. However, the PISCES version used in this study does not include or-ganic phosphorus. In the ocean, oror-ganic phosphorus can be recycled by bacterial activity into inorganic phosphate that is bioavailable for plankton growth. Therefore, the inclusion of organic phosphorus in PISCES along with an estimation of organic phosphorus from atmospheric fluxes is a perspective to consider.
The PISCES version used in this study is based on the Redfield hypothesis that C : N : P ratios in organic cells are fixed. This fixed value determines the nutrient ratio for
up-take and has the advantage of simplifying calculations in the 3-D high-resolution coupled model and is supported by some observations (Pujo-Pay et al., 2011). However, because the Mediterranean is highly oligotrophic, this Redfieldian hy-pothesis is questioned and the biogeochemical cycles may be determined by Redfieldian nutrient use. This non-Redfieldian behavior may imply complex nutrient limitations and co-limitations processes (Geider and La Roche, 2002) that can not be studied with the present PISCES version. As of today, there is no version of PISCES that includes the non-Redfieldian biogeochemistry in the Mediterranean. The de-velopment and use of such a version of PISCES is a perspec-tive of this work that may help to fully understand nutrient dynamics and the growth limitation process in the Mediter-ranean (Saito et al., 2008; Krom et al., 2010). However, this study provides interesting first results on the potential im-pacts of phosphate atmospheric deposition on the Mediter-ranean nutrient pool and potential implications on biologi-cal productivity. Moreover, the development and qualifica-tion of a non-Redfieldian version of the PISCES model may take several years. Plus, even if non-Redfieldian regional Mediterranean biogeochemical models such as ECO3M exist (Baklouti et al., 2006), their higher complexity leads also to a hard task, since the sensitivity of such models to parameter values is a delicate question that requires important comput-ing time and data to solve before revisitcomput-ing our conclusions.
5 Conclusions
This study is a first approach to quantify the effects of dif-ferent atmospheric sources of phosphorus to the Mediter-ranean Sea surface. Our results indicate that, contrary to the global ocean, combustion may be dominant over natural dust as an atmospheric source of phosphate for the Mediter-ranean Basin. This study is the first to examine separately the effects of atmospheric deposition of phosphate from dif-ferent sources that have difdif-ferent seasonal cycles and de-position patterns over the Mediterranean Sea. According to our low-resolution atmospheric model, phosphate deposition from combustion (which includes forest fires and anthro-pogenic activities) is mainly located close to the coasts and has low variability, whereas phosphate deposition from dust is episodic and more widespread. The results indicate that combustion sources are dominant in the north of the basin close to the emission sources, whereas natural dust deposi-tion is dominant in the south of the basin and is strongly dom-inant in pelagic areas such as the middle Ionian and Levan-tine basins. The study of atmospheric model low-resolution deposition fluxes over the period 1997–2012 indicates that the dominance of Pcomb over Pdust in the Mediterranean Basin is consistently observed over this time period. The yearly-averaged deposition patterns are constant over the pe-riod. The relative effects of each source are maximal in their areas of maximal deposition and can induce an enhancement
of up to 30 % in biological productivity in the top 10 m dur-ing the period of surface water stratification.
In the coastal Adriatic and Aegean seas that are under strong influence of anthropogenic emissions, we showed that combustion-derived phosphorus deposition may have effects on the biological productivity. It seems that only dust trans-ported through large events can reach and fertilize pelagic waters. However, the pelagic zones far from coastal influ-ence are often highly oligotrophic and co-limited in nutrients. Then, the deposition of one type of nutrient cannot relieve all the nutrient limitations to have a strong fertilizing effect.
In spite of the limitations of our study linked to the avail-ability of atmospheric P emission and the limited knowledge on atmospheric mixing processes’ impacts on bioavailability of deposited PO4, we showed that atmospheric P deposition
is an important source of bioavailable nutrients and has low but significant impacts on marine productivity. Combustion and soil dust sources display contrasted deposition patterns. Therefore, none should be neglected when accounting for atmospheric sources of nutrients in land and ocean biogeo-chemical models.
Our study highlights the difficulty in constraining atmo-spheric deposition in models because very few estimates of the deposition fluxes over the Mediterranean are avail-able. The existing time series cover only very limited ar-eas of the basin and short time periods. Plus, there is, to our knowledge, only one experimental study addressing the source apportionment of phosphate deposition. Longo et al. (2014) measured the solubility of P aerosols coming from the south and north regions of the Mediterranean and showed that aerosols from Europe deliver more soluble P. Also, Des-boeufs et al. (2018) showed that more than 85 % of P de-position is brought by combustion aerosols in northern Cor-sica over the 2008–2011 period. We underline here the need for more deposition measurements in order to better con-strain the modeling of such important nutrient sources for the Mediterranean.
Further development of atmospheric and oceanic models should be undertaken in order to account for the mixing and chemical processing of the different aerosol sources in the atmosphere and their effect on nutrient solubility in seawa-ter and for possible deviations from Redfield ratios in the marine biological compartments. Moreover, oceanic simu-lations taking into account daily atmospheric deposition of nutrients from dust and combustion over larger time periods would be necessary to assess the variability of the impacts of these sources on marine biogeochemistry.
Data availability. The NEMO/PISCES model is freely available at http://www.nemo-ocean.eu/. The model outputs produced in this study are available upon request to the corresponding author. The data used in this study were published as cited in the article.
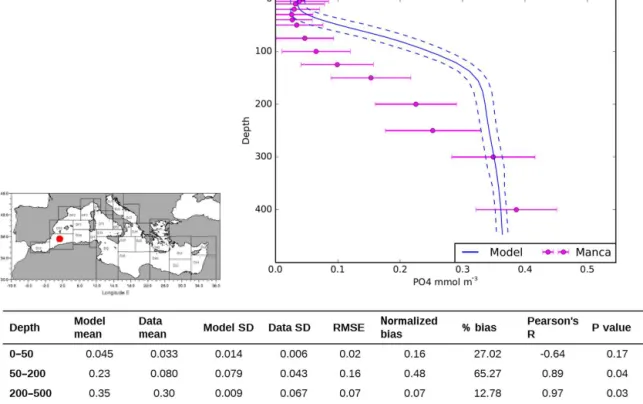
Appendix A: Statistical evaluation of PISCES vertical profiles
The following Tables and Figures provide an evaluation of the model performances against measurements in different Mediterranean regions obtained from Manca et al. (2004). We provide observed and modeled annually averaged vertical profiles over the year 2005 of phosphate and nitrate and sta-tistical indicators (annual vertical mean and SD, RMSE, nor-malized and relative bias, Pearson’s correlation coefficient R and associated p value). We point out that the different indi-cators provide different information. For instance, bias eval-uates how mathematically close the modeled and measured values are, whereas Pearson’s R indicates whether the model reproduces the evolution of PO4concentration with depth.
These figures (Fig. A1 to A10) show that the model re-produces on average the vertical distribution of phosphate. In some regions, such as the Algerian basin, surface concen-tration is closer to measurements than deep concenconcen-trations (Fig. A1). In the south Adriatic and in the Gulf of Lion, phos-phate concentration below 200 m is close to the measure-ments (Figures A4 and A5 show normalized bias of −0.09 and 0.0 respectively). On the other hand, very low bias in the south Adriatic region is paired with low Pearson’s R (0.30 in the deep layer), whereas PO4 concentration evolution with
depth is well reproduced in the Algerian basin (R = 0.89 and R = 0.97 in the intermediate and deep layers) in spite of a mismatch between measured and modeled values.
Figure A1.Annually averaged PO4vertical profile in the Algerian sub-basin (see map and Manca et al., 2004) and statistical indicators over different depths. Model values are shown with the blue line (2005 average, Ntot simulation from Richon et al., 2017) and measured values from Manca et al. (2004) are in pink. Horizontal bars and dashed lines indicate the spatial SD of observations and model results respectively.
Figure A2.Annually averaged PO4vertical profile in the south Levantine sub-basin (see map and Manca et al., 2004) and statistical indicators over different depths. Model values are shown with the blue line (2005 average, Ntot simulation from Richon et al., 2017) and measured values from Manca et al. (2004) are in pink. Horizontal bars and dashed lines indicate the spatial SD of observations and model results respectively.
Figure A3.Annually averaged PO4vertical profile in the south Ionian sub-basin (see map and Manca et al., 2004) and statistical indicators over different depths. Model values are shown with the blue line (2005 average, Ntot simulation from Richon et al., 2017) and measured values from Manca et al. (2004) are in pink. Horizontal bars and dashed lines indicate the spatial SD of observations and model results respectively.
Figure A4.Annually averaged PO4vertical profile in the south Adriatic sub-basin (see map and Manca et al., 2004) and statistical indicators over different depth. Model values are shown with the blue line (2005 average, Ntot simulation from Richon et al., 2017) and measured values from Manca et al. (2004) are in pink. Horizontal bars and dashed lines indicate the spatial SD of observations and model results respectively.
Figure A5.Annually averaged PO4vertical profile in the Gulf of Lion sub-basin (see map and Manca et al., 2004) and statistical indicators over different depth. Model values are shown with the blue line (2005 average, Ntot simulation from Richon et al., 2017) and measured values from Manca et al. (2004) are in pink. Horizontal bars and dashed lines indicate the spatial SD of observations and model results respectively.
Figure A6.Annually averaged NO3vertical profile in the Algerian sub-basin (see map and Manca et al., 2004) and statistical indicators over different depths. Model values are shown with the blue line (2005 average, Ntot simulation from Richon et al., 2017) and measured values from Manca et al. (2004) are in pink. Horizontal bars and dashed lines indicate the spatial SD of observations and model results respectively.
Figure A7. Annually averaged NO3 vertical profile in the south Levantine sub-basin (see map and Manca et al., 2004) and statistical indicators over different depths. Model values are shown with the blue line (2005 average, Ntot simulation from Richon et al., 2017) and measured values from Manca et al. (2004) are in pink. Horizontal bars and dashed lines indicate the spatial SD of observations and model results respectively.
Figure A8.Annually averaged NO3vertical profile in the south Ionian sub-basin (see map and Manca et al., 2004) and statistical indicators over different depths. Model values are shown with the blue line (2005 average, Ntot simulation from Richon et al., 2017) and measured values from Manca et al. (2004) are in pink. Horizontal bars and dashed lines indicate the spatial SD of observations and model results respectively.
Figure A9.Annually averaged NO3vertical profile in the south Adriatic sub-basin (see map and Manca et al., 2004) and statistical indicators over different depth. Model values are shown with the blue line (2005 average, Ntot simulation from Richon et al., 2017) and measured values from Manca et al. (2004) are in pink. Horizontal bars and dashed lines indicate the spatial SD of observations and model results respectively.
Figure A10.Annually averaged NO3vertical profile in the Gulf of Lion sub-basin (see map and Manca et al., 2004) and statistical indicators over different depth. Model values are shown with the blue line (2005 average, Ntot simulation from Richon et al., 2017) and measured values from Manca et al. (2004) are in pink. Horizontal bars and dashed lines indicate the spatial SD of observations and model results respectively.