HAL Id: hal-02271620
https://hal.archives-ouvertes.fr/hal-02271620
Submitted on 27 Aug 2019
HAL is a multi-disciplinary open access
archive for the deposit and dissemination of
sci-entific research documents, whether they are
pub-lished or not. The documents may come from
teaching and research institutions in France or
abroad, or from public or private research centers.
L’archive ouverte pluridisciplinaire HAL, est
destinée au dépôt et à la diffusion de documents
scientifiques de niveau recherche, publiés ou non,
émanant des établissements d’enseignement et de
recherche français ou étrangers, des laboratoires
publics ou privés.
Dynamic fragmentation of graphite under laser-driven
shocks: Identification of four damage regimes
Gabriel Seisson, Gabriel Prudhomme, Pierre Antoine Frugier, David Hébert,
Emilien Lescoute, Arnaud Sollier, Laurent Videau, Patrick Mercier, Michel
Boustié, Laurent Berthe
To cite this version:
Gabriel Seisson, Gabriel Prudhomme, Pierre Antoine Frugier, David Hébert, Emilien Lescoute,
et al..
Dynamic fragmentation of graphite under laser-driven shocks:
Identification of four
damage regimes.
International Journal of Impact Engineering, Elsevier, 2016, 91, pp.68-79.
Dynamic fragmentation of graphite under laser-driven shocks:
Identification of four damage regimes
G. Seisson
a,*
, G. Prudhomme
a, P.-A. Frugier
a, D. Hébert
b, E. Lescoute
a, A. Sollier
a,
L. Videau
a, P. Mercier
a, M. Boustie
c, L. Berthe
d aCEA DIF, Bruyères-le-Châtel, 91297 Arpajon Cedex, FrancebCEA CESTA, 15 avenue des Sablières CS60001, 33116 Le Barp Cedex, France
cInstitut P’ – UPR3346 CNRS-ENSMA-Université de Poitiers, 1 avenue Clément Ader, 86961 Futuroscope Cedex, France dLaboratoire PIMM – UPR8006 CNRS-Arts et Métiers ParisTech, 151 boulevard de l’Hôpital, 75013 Paris, France
Keywords: Carbon Damage PDV VISAR Strength A B S T R A C T
This study presents the results of a large experimental campaign conducted on the Luli2000 laser facil-ity. Thin targets of a commercial grade of porous graphite were submitted to high-power laser-driven shocks leading to their fragmentation. Many diagnostics were used such as high-speed time- and space-resolved imaging systems (shadowgraphy and photography), laser velocimetry (PDV and VISAR), debris collection and post-mortem X-ray tomography. They provided the loading levels into the targets, the spall strength of the material, the shape and size of debris and the localization of the subsurface cracks. The crossed data reduction of all the records showed their reliability and allowed to get a better insight into the damage phenomena at play in graphite. Thereby, four damage regimes, ranked according to their severity and loading level, were identified. It confirms that laser shocks are very complementary to clas-sical impact tests (plates and spheres) since they ally two-dimensional loadings to the possibility of using both, in-situ and post-mortem diagnostics. Finally, the campaign shall be able to provide large and con-sistent data to develop and adjust reliable models for shock wave propagation and damage into porous graphite.
1. Introduction
From the beginning of their development, high-power laser fa-cilities have always been considered as potential calibrated-shock generators[1]. Indeed, the interaction between the laser and the front face of a solid target generates a plasma whose expansion creates a shock wave into the matter that may lead to its failure. Thus, simi-larities with plate impact experiments[2–5]or hypervelocity impacts [6,7]have been pointed out. Many efforts have been done to un-derstand and predict the mechanical effects of the laser–matter interaction through the development of empirical laws[8–11]and specific hydrocodes[12,13]. As a consequence, high-power lasers are now commonly used in a large scope of shock studies[14–21]. The present authors have recently studied the dynamic behav-ior of porous graphite under high or hypervelocity impacts of metallic plates and spheres[22–27]. On the one hand, for plate impact ex-periments, all the phenomena are one-dimensional. Data, exclusively particle velocities (free-surface or interface), are collected during
the experiment and samples cannot be recovered for further post-mortem analysis. On the other hand, hypervelocity impacts of spheres generate two-dimensional phenomena and allow sample recovering for fine post-mortem analysis such as micrography and tomography. However, in-situ dynamic observations are less reach-able because of time and space uncertainties about the impact.
Hence, the purpose of this paper is to show how a better insight into the two-dimensional damage phenomena of porous graphite can be obtained with well-calibrated and repeatable laser-driven shocks using crossed data reduction from various in-situ and post-mortem diagnostics. InSection 2, we present the experimental set-up. Then, inSection 3, we discuss the free-surface velocity records in order to estimate the loading levels and the spall strength of our graphite. And finally, inSection 4, we confront, correlate and discuss all the experimental results in order to better understand the damage mechanisms, leading to the identification of four different damage regimes.
2. Experimental set-up
Shock experiments have been conducted with a high-power laser facility onto thin graphite targets leading to their fragmentation and/ or perforation. Various diagnostics have been used in order to
* Corresponding author. CEA DIF, Bruyères-le-Châtel, 91297 Arpajon Cedex, France. Tel.:+331 69 26 40 00.
measure the laser spot and pulse, to capture time- and space-resolved images of the fragmentation and to record the particle velocities. In the same time, reference shots have been done onto well-known materials such as aluminum and tantalum.
2.1. Facility and diagnostics
Luli2000 is a high-power laser facility of the Laboratoire pour
l’Utilisation des Lasers Intenses (LULI) based at the École Polytechnique
(Palaiseau, France)[28]. This laser generates square temporal pulses tunable from 0.5 to 5 ns and can reach energies up to 1 kJ at the wavelength of 1064 ns.
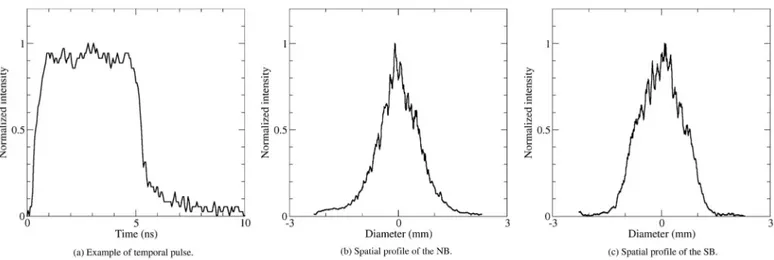
Fig. 1gives a simplified scheme of the experimental set-up. During this campaign, the laser was used at the wavelength of 532 ns with energies between 35 and 700 J, of which about 90% were deliv-ered in 5 ns as shown inFig. 2(a). The targets were placed at the center of the experimental chamber under high-vacuum where two different beams (called SB and NB, i.e. South beam and North beam) were alternatively focused. They formed a negligible angle of 5.5 degrees with the horizontal x-axis. They shared the same laser source but had their own amplification chain which allowed larger quan-tity of shots per day. The focal spot of each beam was spatially shaped just before the experiment chamber by means of phase plates that made the beams axisymmetrical and pseudo-Gaussian (seeFig. 2(b) and 2(c)).
The particle velocities of the rear face of the targets were mea-sured by VISAR[29]which has a good temporal resolution. However, its need of a strong return signal can be an issue when the mea-sured surface gets highly deformed and loses its reflectivity. Hence, we also used photonic Doppler velocimetry (PDV)[30–32]that has a lower temporal resolution but is capable to record multiple ve-locities despite weak return signals (around a few percents of the original one). Two PDV probes with 1-mm-diameter beams were placed in the x-y plan, each forming an angle with the x-axis (α1
and α2respectively). They were pointed to the back face of the targets
measuring its velocity and then the velocity of the ejected fragments. For some shots, VISAR was replaced by an open cube filled with varagel, a gel derivated from paraffin with a density close to the water one. Placed at a few centimeters from the back face, this collector captured debris without damaging them in order to measure and analyze them by means of tomography[33].
The time- and space-resolved laser shadowgraphy recorded frag-ments ejected from the targets back face[34]. A 527-nm continuous laser enlightened two amplified cameras that took pictures of the shadow of the ejecta according to the x-z plan. Each camera made two images at different times with an exposure time of 5 ns. The exact instant of the capture was known thanks to a synchroniza-tion system between the laser facility and all the diagnostics.
High-speed photography was obtained by pulsed-laser illumi-nation[35]: two 10-ns pulses of second harmonic YAG laser
lightened the scene, hence freezing the movement of the rear surface. The apparatus delivered two high-resolution frames, even when frag-ment velocities exceeded several hundreds of meters per second. Light was fed through bundles of multimode optical fibers provid-ing flexibility in its positionprovid-ing and, as a side effect, operatprovid-ing a significant smoothing of both objective and subjective speckles. Its residual contrast was estimated at only 14%. Each frame was cap-tured by a CCD camera with sampling 2048× 2048 pixels and 500 ns framing for spurious light rejection; an interferometric filter could also be implemented to further reject unwanted light signals (plasma, PDV probes, etc.).
2.2. Targets and shot configurations
The shots of the campaign are summarized inTable 1giving the characteristics of the targets as well as the laser and diagnostic pa-rameters. As mentioned above, reference shots were performed onto 6061-T6 aluminum and tantalum targets whose respective thick-nesses were 250 and 125 μm. But most of the shots were done onto 18-mm square plates of EDM3 graphite whose thickness varied from 0.75 to 2.5 mm.
EDM3 is a macroscopically isotropic commercial grade of graph-ite made by POCO[36,37]and has been extensively investigated by the present authors[22,38]in the context of understanding the dynamic behavior of matrices from carbon–carbon composites. It is about 22% porous with a density of 1.754 g/cm3. A binarised optical
micrography of a healthy sample of EDM3 (after cutting and pol-ishing) is displayed inFig. 3. It shows that the side of the cubic Representative Volume Element (RVE) is of the order of 50 μm, i.e. from 15 to 50 times less than the target thickness and around 40 times less than the laser spot diameter. The main features of EDM3 that may be useful to the reader and to the discussions are re-called inTable 2.
Finally, the back face of the targets were covered of a 1-μm alu-minum layer in order to better reflect laser diagnostics.
3. Velocimetry analysis
In this section, we present and analyze the VISAR and the PDV records in order to evaluate the difference between South and North beams, the spall strength of EDM3 and the mechanical loading endured by the targets.
Fig. 2. Temporal and spatial characteristics of the laser pulses of South and North beams. For the record, the temporal profile has been measured by a photodiode for every
shot. Very stable, the spatial profiles have been gauged at regular intervals with a CCD camera.
Table 1
Summary of the shots on aliminum, tantalum and EDM3 graphite. Only α2is given since α1= 13° never changed. The laser energy is the one that has been measured and not the one that has been adjusted by calibration (cf.Section 3.1). The reference time is set to be the arrival time of the high-power laser onto the front face of the target.
Shot number Target Laser Velocimetry Shadowgraphy (μs) Photography (μs) Debris
Material Thick (μm) Beam Energy (J) VISAR α2 IMG1 IMG2 IMG3 IMG4 IMG1 IMG2 collector
3 Al 250 S 116 × 15° 1.5 2 3 4 0.46 0.54 – 4 Al 250 N 572 – 15° 0.6 1 1.4 1.8 – 0.48 – 5 EDM3 2500 S 215 × 15° 5 16 30 50 10.44 16.44 – 6 EDM3 2500 N 715 × 15° 5 16 30 50 10.44 16.44 – 7 EDM3 750 S 121 × 15° 5 16 30 50 10.44 – – 8 EDM3 750 N 652 × 15° 4 7 10 13 3.36 9.36 – 9 EDM3 1000 N 636 × 42° 3 5 8 10 2.36 8.36 – 10 EDM3 1000 S 235 × 42° 3 8 15 20 4.36 10.34 – 11 EDM3 1500 N 608 × 42° 4 10 15 20 4.36 10.34 – 12 EDM3 1500 S 189 × 42° 10 20 30 50 – – – 13 EDM3 2000 N 564 × 42° 10 30 50 100 10.34 30.34 – 14 EDM3 750 S 35 × 42° 5 10 30 50 10.34 30.34 – 15 EDM3 750 S 259 – 42° 5 16 30 50 10.34 30.44 × 16 EDM3 750 N 167 × 42° 5 10 20 30 10.34 30.34 – 17 EDM3 750 S 547 × 42° 2 4 8 10 2.4 8.4 – 18 EDM3 1000 N 342 × 42° 3 9 15 20 3.4 9.4 – 20 Ta 125 N 644 × 42° 1 2 4 7 1.44 7.36 – 26 EDM3 1000 N 415 – 42° – – – – – 9.4 × 27 EDM3 1000 S 467 – 42° – – – – 3.4 9.4 ×
3.1. North beam vs. South beam
Before presenting all the VISAR records, the difference between NB and SB has to be pointed out. The shots conducted on both beams must be considered as two distinct series. This is demonstated byFig. 4 that presents VISAR signals for three couples of shots with identical thicknesses. For each couple, the energy of NB is slightly higher than the one of the SB but this is not the case of the free surface velocity. For example, the energy of shot #8 is 20% higher than shot #17 but its velocity is 15% lower. For clarity and consistency we specify in the following the laser beam used for each shot adding the letter S or N before the shot number, e.g. S17 and N8.
The most obvious reason of such a discrepancy between NB and SB in spite of similar energies is the shape of their respective focal spots that are rather different. A significant part of the announced energy can be spent in the wings of the Gaussian spot at very low intensities but over a large area. Thus, it is necessary to know the exact amount of energy contained in the useful part of the spot, i.e. the central part where the intensity is high enough to generate a shock wave into the target. Therefore, reference shots onto well-known materials that are aluminum and tantalum have been performed. A calibration process consisting in computations of laser– matter interaction and shock wave propagation (not presented here) revealed that the useful part of the focal spot contains 45% of the measured energy for NB and 80% for SB which is consistent with the VISAR records plotted inFig. 4.
3.2. Loading levels
Fig. 5gathers the VISAR records obtained for the shots onto EDM3. Note that the time uncertainty is of± 2 ns. The set of shots covered a large field of loading since the free surface velocities range from 50 to 560 m/s.
Using the acoustic approximation, one can roughly evaluate the maximum pressure Pmof the shock wave breaking out of the target
back face by means of the following expression:
Pm= C Um 1
2
ρ
0 0 (1)where ρ0and C0are the initial density and the bulk sound velocity
of the target material and Umis the maximum free surface
veloc-ity. The pressure Pmof each shot on graphite is given inTable 3,
ranging from 0.1 to 1.1 GPa. But this must be considered with caution, because if the acoustic approximation is quite well adapted to dense materials where the sound velocity does not vary so much with the pressure, this is not the case for porous materials such as EDM3 where the sound velocity decreases first and then increases because of the compaction phenomenon. However, it gives good orders of magnitude.
Fig. 3. Binarized optical micrography of a healthy sample of EDM3 after cutting and
polishing. Material matrix appears in black whereas voids are in white. The Repre-sentative Volume Element (RVE) is about 50× 50 × 50 μm.
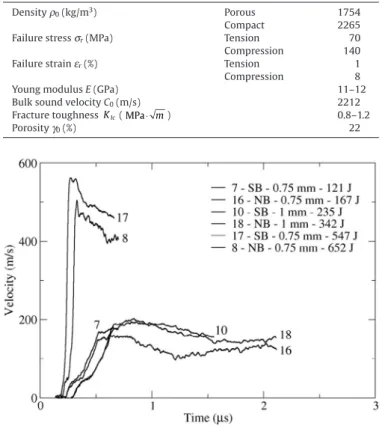
Table 2
Main characteristics of the EDM3 graphite according to references22 and 38. The Young modulus was exctracted from tensile and compression tests and confirmed by ultrasonic analysis that also gave the sound velocities.
Density ρ0(kg/m3) Porous 1754
Compact 2265
Failure stress σr(MPa) Tension 70
Compression 140
Failure strain εr(%) Tension 1
Compression 8
Young modulus E (GPa) 11–12
Bulk sound velocity C0(m/s) 2212
Fracture toughnessKIc(MPa⋅ m) 0.8–1.2
Porosity γ0(%) 22
Fig. 4. Free surface velocities for three couples of similar shots performed with
dif-ferent beams. It clearly points out the difference between NB and SB. For clarity, noise has been reduced.
It is interesting to compare Pmto the ablation pressure
gener-ated on the front face by the plasma expansion. In the case of aluminum, the Grün formula[9]gives good results:
Pab I m =1440 0 8⎛⎝⎜ ⎞⎠⎟ 105 0 8 . . (2)
with Pabthe ablation pressure in GPa and Imthe maximum laser
in-tensity expressed in GW/cm2
. There is no such empirical law for graphite but we have shown that the Grün formula gives good order of magnitude for graphite at intensities around 1 TW/cm2[25]. The
intensity used here is an equivalent one calculated after the cali-bration process in the case of a homogeneous top-hat spot whose diameter has been ajusted to conserve the power.Table 3gives the ablation pressure of each shot deduced from equation2.
The immense difference (two orders of magnitude) between Pab
and Pmmust be noticed. It shows a strong attenuation of the shock
wave during its propagation through the graphite target. This phe-nomenon is linked to the target thickness, to the very short laser pulse and to the fact that the velocities of the release waves in porous materials are much higher than the shock wave one.
3.3. Spall strength
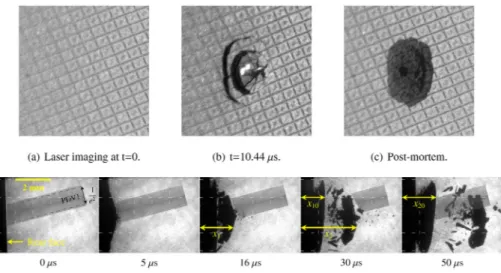
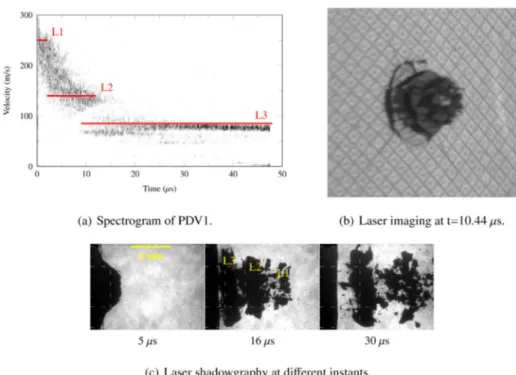
Fig. 6shows the back face of shot S27 captured by the laser imaging at 3.4 μs after the laser pulse begining. The Gaussian shape of the beam leads to a strong bulge of the surface degrading its reflectivity. It certainly happened right after the shock break-out instant that can explain the fact that VISAR signal is lost before any pull-back. Thus, VISAR is very useful for recording the shock front but for spall phenomenon, PDV must take over.
Remind that the PDV probes use a collimated beam whose di-ameter is above 1 mm. It means they record all the velocities over a surface equal to the beam area. As a result, we get a spectrum of velocities whose maximum values are theoritically related to the center of the stressed area. Nevertheless, a correction is needed in order to take into account the angles αidividing the velocities by
the their respective cosine (in the hypothesis of colinearity between the x-axis and the surface and/or debris motion).
The spectrogram of S7-PDV1 plotted inFig. 7confirms the maximum free surface velocity of 170 m/s recorded by VISAR, which is the case (± 10%) for every shots with both PDV and VISAR. Then, after 4 μs, it clearly shows a spall flight with a constant velocity signal around 75–80 m/s.
Averaging the velocities before 10 μs gives a unique velocity signal where a pull-back is clearly visible with a ΔU ~ 70 m/s. One can estimate the spall strength by:
σ
sp= −ρ
C U1
2 0 0Δ (3)
It gives σsp= −135 MPa a value sensibly higher than the static tensile strength of−70 MPa given inTable 2. However, given the po-rosity of EDM3, the acoustic approximation must be considered with caution. Anyway, the existence of a planar spall is uncertain because of the Gaussian shape of the focal spot that complexifies the phe-nomenon. In fact, after 20 μs, the signal lose its intensity and a new trail progressively begins around 20–25 m/s. The joint use of PDV and imaging systems will help to understand this phenomenon.
4. Correlation of the experimental results
Many in-situ diagnostics have been simultaneously used during the campaign. Each of them gives partial information about the shock propagation into the target or about its fragmentation. They were
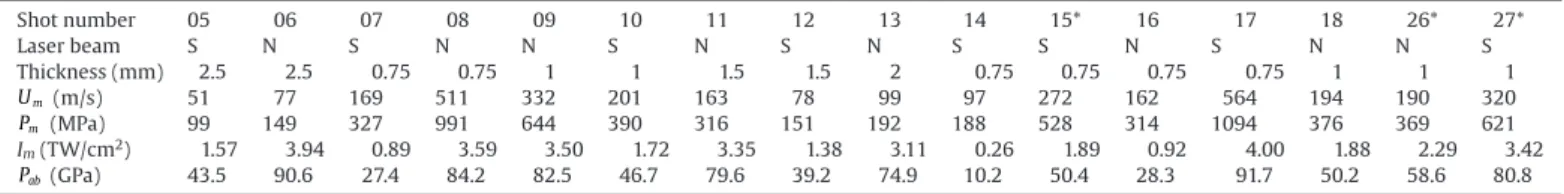
Table 3
The maximum pressure seen by the back face Pmis estimated from the maximum free surface velocity Umand from equation1. For shots without VISAR (starred numbers),
Umis exctracted from PDV signals. The ablation pressure Pabis calculated thanks to the maximum calibrated laser intensity Imand to equation2.
Shot number 05 06 07 08 09 10 11 12 13 14 15* 16 17 18 26* 27* Laser beam S N S N N S N S N S S N S N N S Thickness (mm) 2.5 2.5 0.75 0.75 1 1 1.5 1.5 2 0.75 0.75 0.75 0.75 1 1 1 Um(m/s) 51 77 169 511 332 201 163 78 99 97 272 162 564 194 190 320 Pm (MPa) 99 149 327 991 644 390 316 151 192 188 528 314 1094 376 369 621 Im(TW/cm2) 1.57 3.94 0.89 3.59 3.50 1.72 3.35 1.38 3.11 0.26 1.89 0.92 4.00 1.88 2.29 3.42 Pab(GPa) 43.5 90.6 27.4 84.2 82.5 46.7 79.6 39.2 74.9 10.2 50.4 28.3 91.7 50.2 58.6 80.8
Fig. 6. Tilted view of the back face of shot S27, 3.4 μs after the laser pulse. The surface
is strongly deformed under the effect of the shock. The black area in the right-hand-side bottom corner is due to the sensor damage. White trails are a residue of the PDV pumping laser.
Fig. 7. Spectrogram S7-PDV1. The second constant velocity signal around 20 m/s after
20 μs is hardly understandable without the help of the imaging systems. Velocities are corrected by the cosine of α1.
completed by post-mortem tomographies of the recovered targets and debris, informing about damage. The purpose of the follow-ing is to correlate all these results in order to better understand the damage phenomenology of graphite under laser-induced shock.
4.1. Representative shots
A first data reduction allowed us to visually identify four differ-ent damage regimes to which almost all the shots can be linked to. Each of the four shots discussed in this section is representative of a particular damage regime.
4.1.1. Shot S7 – 0.75 mm – 0.89 TW/cm2
Fig. 8gives the results of the two time-resolved imaging systems used during shot S7. Surprisingly, they evidence two spall levels: the one that is ejected first looks like an Asian conical hat and is constituted of multiple debris; it is followed by a unique spall shaped like a cymbal or a saucer recessed of the first stage of debris. The distance between those two stages is increasing with time which indicates the first one is moving faster.
We drew the position and the size of the PDV1 beam onto the shadowgraphy images. In reality, probes were placed in the x-y plan instead of the x-z plan as suggested here but this is not much in-accurate because of the axisymmetry of the experiment. In this manner, one sees that the Asian hat goes first through the PDV beam. Then, between 16 and 50 μs, the cymbal progressively intercepts the beam. Thus, the velocity signal around 75–80 m/s seen onFig. 9 should correspond to the first spall level whereas the one around 20–25 m/s should belong to the second stage. It is easily verifiable thanks to the time- and space-resolved shadowgraphy which enables to know the average speed of an objectVav between two images,
using the simple formula:
V x x
t
av= −
2 1
Δ (4)
According toFig. 8(a), it leads to 88 m/s for the first level and 28 m/s for the second one. The order of magnitude is rather good even if a slight discrepancy exists. It probably comes from the fact that the two methods do not consider the velocity of the same points, those pos-sibly varying despite the almost axisymmetry of the experiment.
4.1.2. Shot S15 – 0.75 mm – 1.89 TW/cm2
The same analysis is feasible for totally different shots shuch as shot S15, conducted at higher energy and whose results are given inFig. 9. With shadowgraphy, one identifies three successive debris levels whose velocities are around 250 m/s for the first one (L1), 140 m/s (L2) and 85 m/s (L3). They are represented on the spec-trogram of PDV1 by means of three horizontal lines. The identification of the slower level is the easiest because it is the one that stays the longest in the PDV beam (from 10 μs).
4.1.3. Shot S17 – 0.75 mm – 4 TW/cm2
Until now, we followed the assumption that the motion of the ejecta was exclusively along the x-axis and thus, the velocity mea-sured by PDV1 could simply be corrected by the cosine of α1. It was
rather accurate for shots S7 and S15. but it is less obvious in the case of shot S17 conducted at even higher energy whose results are outlined inFig. 10.
Beyond the first instants, one cannot know the exact velocity along the x-axis because the debris cloud takes the shape of an ex-pending sphere, also moving along this axis. Hence, the record is only a projection of the particle velocity along the probe axis. This is an incomplete measure whose bias depends not only on the time but also on the observed particle. When the PDV beam skims over the sphere periphery, it records in the same time particle veloci-ties with strongly different directions. That is why no angle correction has been done on the PDV spectrogram ofFig. 10(a). Nonetheless, at late instants one observes a constant velocity signal around 100 m/s that according to shadowgraphy seems to be the one of the cone following the sphere.
4.1.4. Shot N13 – 2 mm – 3.11 TW/cm2
The reading of shot N13 is much more simple as shown inFig. 11. Except small central debris due to overintensities of the focal spot observable inFig. 2(b), imaging systems evidence the creation and the flight of a single spall at very low velocity in the order of 15 m/s. This fact is confirmed by the sole constant velocity signal ap-peared on PDV1. Moreover, one notes that the pull-back observed on the spectrogram (ΔU ~ 70 m/s) corroborates the one recorded for shot S7 (seeSection 3.3).
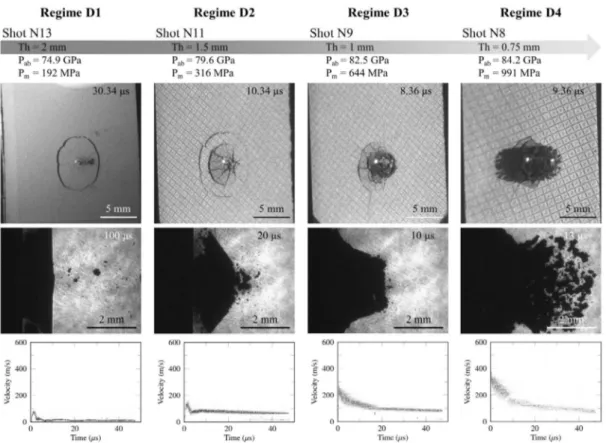
4.2. Damage regimes
As said previously, shots N13, S7, S15 and S17 were not randomly selected. They are representative of four different damage regimes identified, proceeding from the data reduction of the campaign. Name them D1 to D4 according to their physical aspect and severity:
Regime D1: formation of a single conical spall;
Regime D2: apparition of a double spall with a multi-fragmented
first stage and a one-piece second one;
Regime D3: multiple fragmentation of the target into few debris
levels;
Regime D4: explosion of the target with a sphere-shaped cloud
constitued of numerous debris of small size.
4.2.1. Identification and origins
The data reduction of the other shots allows to identify those linked to one or the other regime based on the damage aspect as ranked inTable 4. Because damage necessarily depends on loading
Fig. 9. Shot S15 – 0.75 mm – 1.89 TW/cm2. Laser imaging and shadowgraphy at different instants and debris velocity recorded by PDV.
Fig. 10. Shot S17 – 0.75 mm – 4 TW/cm2. Laser imaging and shadowgraphy at different instants and debris velocity recorded by PDV. Velocity has not been corrected by the cosine of α1.
conditions, the maximum intensity, the maximum pressure seen by the back face and the maximum free surface velocity are recalled. Shots S5, N6, S10, S12, S14 and N16 are not ranked, either because there is no apparent damage or because the latter does not look like the one of any other shot. It clearly appears that the belong-ing of a shot to a regime is not directly related to the laser intensity, i.e. to the ablation pressure. For example, in D2 the laser intensi-ties are varying from simple to double; and the unique intensity of D1 (N13 – 3.11 TW/cm2) is higher than the lowest one of D3
(S15 – 1.89 TW/cm2). Nevertheless, the back face velocities are very
close to each other for shots from a same regime. This phenome-non is illustrated byFig. 12that gives an overview of the four regimes for each beam. In the case of NB, the ablation pressure is constant and the target thickness is varying whereas it is the opposite for SB. The only common point between the shots of one regime is the free surface velocity, hence the loading level seen by the sample rear face. Note that the existence of different and identical thick-nesses in a same regime (cf. regimes D2, D3 and D4 inTable 4) indicates the statistical homogeneity of all the targets in spite of
the fact that the thinnest one represents only 15 times the RVE (seeSection 2.2).
We thereby obtained thresholds for the four damage regimes ac-cording to the stress endured by the target back face (seeTable 4). However, they were estimated by means of the acoustic approxi-mation, which cannot be totally trusted in the case of porous materials, and they should be refined thanks to further reliable simulations.
4.2.2. Other shots analysis
Apparently, six shots do not match with the four-damage-regime ranking because their fragmentation does not look like any other. However, some of them have free surfaces velocities close to those of ranked shots. Post-mortem tomographies have been performed in order to detect eventual subsurface damage capable to clarify our analysis.
According to Um, S10 and N16 should belong to D2 but imaging
given inFig. 13does not show any typical double spall correspond-ing to this regime. Nevertheless, the tomographic slices on the same
Fig. 11. Shot N13 – 2 mm – 3.11 TW/cm2. Laser imaging and shadowgraphy at different instants and debris velocity recorded by PDV.
Table 4
Ranking of the shots according to the damage regime they belong to, thanks to imaging systems results. Six shots are not classifiable a priori: S5, N6, S10, S12, S14 and N16.
Regime D1 D2 D3 D4 Shot N13 S7 N11 N18 N26 N9 S15 S27 N8 S17 Thick. (mm) 2 0.75 1.5 1 1 1 0.75 1 0.75 0.75 Im(TW/cm2) 3.11 0.89 3.35 1.88 2.29 3.50 1.89 3.42 3.59 4.00 Um(m/s) 99 169 163 194 190 332 272 320 511 564 Pm (MPa) 192 327 316 376 369 644 528 621 991 1094
figure reveals subsurface cracks that have not completely or not at all reached the back face. Their shape suggests that a second spall was appearing but did not detach itself. Therefore, those two shots are at the threshold between D1 and D2, between a single and a double spall.
Given the velocities of shots S5, N6, S12 and S14, they could be logically linked to regime D1 but no damage was visible with the imaging systems.Fig. 14presents tomographies of these targets.
The laser shock of shot S5 produced an important crater on the target front face but did not generate cracks nor crack initiations in the direction of the back face as shown inFig. 14(a). S5 does not belong to any damage regime. Moreover, its free surface velocity is sensibly lower than the observed one for D1, i.e. 51 m/s instead of around 100 m/s.
The tomography of shot S14 evidences a conical crack under-lined in yellow inFig. 14(d). If it had propagated up to the rear face, a conical spall would have been formed and ejected. Hence, S14 is probably at the threshold between no damage and regime D1.
It is harder to interpret shots N6 and S12. In both cases, tomog-raphies reveal conical cracks facing the back surface. There are few hypotheses. First, if cracks had reached the back face, double or triple spall would have occurred and these two shots could not be ranked
in regime D1. Second, if only the crack that is the closest to the front face had reached the back face, there would be a single spall. This is likely since it would lead to the perforation of both targets which has been noted for N13 (the unique confirmed shot of D1). More-over, as the spall of this shot has not been recovered, we cannot know if it held in other crack initiations. In that case, N6 and S12 ranked somewhere between no damage and D2. Third and last, the cre-ation of a large crater on the front face of the two shots may have strongly influenced the crack initiation and propagation in the deeper volumes. Damage regimes would thus not only be linked to the rear surface velocity but also to the target thickness, since large craters are formed onto the thickest ones.
4.3. Damage characterization 4.3.1. Targets
Tomographies presented inFigs. 13 and 14show that, when it exists, the subsurface damage into the targets mainly takes the form of long conical cracks. It is the case of all shots up to the regime D2 included. Sadly, for shots of regimes D3 and D4, the belated strong flexions caused by the laser loading broke the targets into unre-covered multiple parts.
Shot S12 is of particular interest as it allows to learn how front face craters are formed thanks toFig. 14(c). A crack propagates from the depth to the surface apparently leading to the ejection of a not or barely fragmented block of matter despite the fact that the front face endured pressures around 40 GPa.
All these post-mortem observations should be very helpful for a precise adjustment of the thresholds of further numerical failure models.
Finally, note that, even though the graphite–diamond phase tran-sition pressure (18–28 GPa according to the SESAME 7832 table) has been widely exceeded for almost all the shots, no diamond phase has been observed on the tomography.
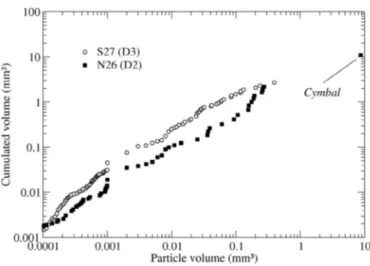
4.3.2. Debris
For shots N26 (D2) and S27 (D3), debris have been recovered thanks to varagel collectors. Tomographies have been performed in order to analyze their population.Fig. 15plots for both shots the cumulated debris volume according to the particle volume. The two targets have the same thickness, i.e. 1 mm. To allow the compari-son, we neglect the potential shape effect of the laser beam on the ejected particles volume.
Fig. 13. Shots S10 and N16 belong to the threshold between regimes D1 and D2. Imaging systems do not show double spall but post-mortem tomographies reveal a second
spall almost formed under the back surface. Left-hand side of tomographies: front face. Right-hand side: rear face. The white dots on tomographies are inclusions of va-nadium and titanium from the graphite manufacturing process.
Fig. 14. Tomographies of shots S5, N6, S12, and S14. The target fronts are left. The
white dots are inclusions of vanadium and titanium from the graphite manufactur-ing process. For clarity, crack of S14 has been underlined in yellow.
Unlike we could have anticipated, the volume of the ejected matter during the lowest shot (N26) is almost four times greater than for the highest shot (S27). The difference entirely comes from the cymbal-like debris observed in regime D2 since it accounts for three quarters of total volume of the debris. Once excluded, volumes become equivalent.
Differences in terms of debris population have to be noticed. Par-ticles of volume between 0.0001 and 0.001 mm3are more numerous
for shot S27 (D3) than for shot N26 (D2) since the slope of the first one is steeper. The slopes are then equivalent for particles between 0.001 and 0.1 mm3which indicates a similarity between the debris
populations. Finally, beyond 0.1 mm3, the slope of shot N26 is the
steepest which reveals its debris of this size are more numerous than for S27. These measures are consistent with our visual observa-tions that show the size of debris is decreasing when the loading level increases. According to Grady’s theory[39], it confirms that the strain rate is higher in D3 than in D2.
5. Summary and future work
Previous studies showed the shortcomings of classical impact tests (plates and spheres) in helping to understand the two-dimensional damage phenomena of a commercial grade of porous graphite. This paper has demonstrated that a better insight can be obtained using well-calibrated and repeatable laser-driven shocks along with various in-situ and post-mortem diagnostics:
– Spall strength has been estimated thanks to PDV data; – Precise VISAR records allowed to value the stress level seen by
the rear face of the targets;
– High-speed imaging systems provided a dynamic visualization of damage and fragments and helped to understand unfamiliar long-time PDV spectrograms;
– Time- and space-resolved shadowgraphy confirmed velocity measurements;
– Fragment analysis and subsurface crack localization became avail-able thanks to post-mortem tomography;
– Identification and comprehension of four damage regimes were possible because of a large crossed data reduction.
Given all the collected data, associated numerical works are cur-rently being conducted and will be the subject of a further publication. Free-surface and fragment velocity, back-face deformations, crack
localizations and fragment sizes, in conjunction with the space and time characterization of the laser pulse, will help to develop and adjust reliable models for shock wave propagation and damage into graphite. Then, the stress thresholds of the four damage regimes could be refined. Finally, similar experimental and numerical ap-proaches could be conducted for other materials.
Acknowledgments
The authors would like to thank Yannick Pannier (Institut P’ – UPR3346) for his help conducting the tomographies and all the LULI staff members for their technical and administrative support during the campaign. The access to the Luli2000 facility was granted by the French Lasers and Plasmas Institute (ILP – FR2707).
References
[1] DeMichelis C. Laser interaction with solids – a bibliographical review. IEEE J Quant Electron 1970;6(10):630–41.
[2] Veeser LR, Solem JC. Studies of laser-driven shock waves in aluminum. Phys Rev Lett 1978;40:1391–4. doi:10.1103/PhysRevLett.40.1391.<http://link.aps.org/ doi/10.1103/PhysRevLett.40.1391>.
[3] Ng A, Parfeniuk D, DaSilva L. Hugoniot measurements for laser-generated shock waves in aluminum. Phys Rev Lett 1985;54:2604–7. doi:10.1103/PhysRevLett .54.2604.<http://link.aps.org/doi/10.1103/PhysRevLett.54.2604>.
[4] Eliezer S, Gilath I, Bar-Noy T. Laser-induced spall in metals: experiment and simulation. J Appl Phys 1990;67(2):715–24.<http://dx.doi.org/10.1063/ 1.345777>, <http://scitation.aip.org/content/aip/journal/jap/67/2/10.1063/ 1.345777>.
[5] Boustie M, Cottet F. Experimental and numerical study of laser induced spallation into aluminum and copper targets. J Appl Phys 1991;69(11):7533–8. <http://dx.doi.org/10.1063/1.347570>, <http://scitation.aip.org/content/aip/ journal/jap/69/11/10.1063/1.347570>.
[6] Pirri AN. Theory for laser simulation of hypervelocity impact. Phys Fluids 1977;20(2):221–8. doi:10.1063/1.861859.<http://link.aip.org/link/?PFL/ 20/221/1>.
[7] Nebolsine PE. Laser simulation of hypervelocity impact. In: AIAA 14th Aerospace Sciences Meeting; 1976.
[8] Phipps CR, Turner TP, Harrison RF, York GW, Osborne WZ, Anderson GK, et al. Impulse coupling to targets in vacuum by KrF, HF, and CO2 single-pulse lasers. J Appl Phys 1988;64(3):1083–96. doi:10.1063/1.341867.
[9] Grün J, Decoste R, Ripin BH, Gardner J. Characteristics of ablation plasma from planar, laser-driven targets. Appl Phys Lett 1981;39(7):545–7.<http://dx.doi.org/ 10.1063/1.92788>, <http://scitation.aip.org/content/aip/journal/apl/39/7/ 10.1063/1.92788>.
[10] Fabbro R, Fournier J, Ballard P, Devaux D, Virmont J. Physical study of laser-produced plasma in confined geometry. J Appl Phys 1990;68(2):775–84. doi:10.1063/1.346783.<http://link.aip.org/link/?JAP/68/775/1>.
[11] Berthe L, Fabbro R, Peyre P, Tollier L, Bartnicki E. Shock waves from a water-confined laser-generated plasma. J Appl Phys 1997;82(6):2826–32. doi:10.1063/ 1.366113.<http://link.aip.org/link/?JAP/82/2826/1>.
[12] Buresi E, Coutant J, Dautray R, Decroisette M, Duborgel B, Guillaneux P, et al. Laser program development at CEL-V: overview of recent experimental results. Laser Part Beams 1986;4:531–44. doi:10.1017/S0263034600002214. <http://journals.cambridge.org/article-S0263034600002214>.
[13] Ramis R, Meyer-ter-Vehn J, Ramírez J. MULTI2D – a computer code for two-dimensional radiation hydrodynamics. Comput Phys Commun 2009; 180(6):977–94.<http://dx.doi.org/10.1016/j.cpc.2008.12.033>, <http://www .sciencedirect.com/science/article/pii/S0010465508004505>.
[14] Batani D, Strati F, Stabile H, Tomasini M, Lucchini G, Ravasio A, et al. Hugoniot data for carbon at megabar pressures. Phys Rev Lett 2004;92:1–4. doi:10.1103/ PhysRevLett.92.065503.<http://link.aps.org/doi/10.1103/PhysRevLett.92 .065503>.
[15] Laporte D. Analyse de la réponse d’assemblages collés sous des sollicitations en dynamique rapide. Essais et modélisations [Ph.D. thesis]. École Nationale Supérieure de Mécanique et d’Aérotechnique de Poitiers; 2011.
[16] Loison D, de Rességuier T, Dragon A, Mercier P, Benier J, Deloison G, et al. Skew photonic Doppler velocimetry to investigate the expansion of a cloud of droplets created by micro-spalling of laser shock-melted metal foils. J Appl Phys 2012;112:1–8.
[17] Bolis C. Étude numérique et expérimentale de la séparation par chocs brefs d’interface de revêtements multicouches. Application au test d’adhérence par chocs laser [Ph.D. thesis]. Université de Poitiers; 2004.
[18] Ecault R, Boustie M, Touchard F, Pons F, Berthe L, Chocinski-Arnault L, et al. A study of composite material damage induced by laser shock waves. Compos Part A Appl Sci Manuf 2013;53(0):54–64.<http://dx.doi.org/10.1016/ j.compositesa.2013.05.015>, <http://www.sciencedirect.com/science/article/ pii/S1359835X13001589>.
[19] Cuq-Lelandais JP. Étude du comportement dynamique de matériaux sous choc laser sub-picoseconde [Ph.D. thesis]. École Nationale Supérieure de Mécanique et d’Aérotechnique de Poitiers; 2010.
Fig. 15. Cumulated debris volume according to particle volume. The volume of ejected
matter is greater for the lowest damage regime (D2). Particles are smaller for the highest regime (D3).
[20]Holmquist TJ, Wereszczak AA. Laser-induced spall in silicon carbide. In: 23rd International Symposium on Ballistics; 2007.
[21]Holmquist TJ, Wereszczak AA. The internal tensile strength of a borosilicate glass determined from laser shock experiments and computational analysis. Int J Appl Glass Sci 2014;5(4):345–52. doi:10.1111/ijag.12097.<http://dx.doi.org/ 10.1111/ijag.12097>.
[22]Hébert D, Seisson G, Bertron I, Chevalier JM, Thessieux C, Quessada JH, et al. Plate impact experiments and simulation on porous graphite. J Phys Conf Ser 2014;500(18):1–6.<http://stacks.iop.org/1742-6596/500/i=18/a=182016>.
[23]Hébert D, Seisson G, Bertron I, Hallo L, Chevalier JM, Thessieux C, et al. Simulations of hypervelocity impacts into graphite. Procedia Eng 2015;103: 159–64.<http://dx.doi.org/10.1016/j.proeng.2015.04.022>, <http://www .sciencedirect.com/science/article/pii/S1877705815006967>; Proceedings of the 2015 Hypervelocity Impact Symposium (HVIS 2015).
[24]Seisson G, Hébert D, Bertron I, Chevalier JM, Lescoute E, Videau L, et al. Dynamic behavior of a porous brittle material: experiments and modeling. In: Sorensen B, Chhabildas L, editors. Procedia Eng 2013;58:715–23.<http://dx.doi.org/ 10.1016/j.proeng.2013.05.083>; Proceedings of the 12th Hypervelocity Impact Symposium.
[25]Seisson G, Hébert D, Bertron I, Chevalier JM, Hallo L, Lescoute E, et al. Dynamic cratering of graphite: experimental results and simulations. Int J Impact Eng 2014;63(0):18–28. <http://dx.doi.org/10.1016/j.ijimpeng.2013.08.001>, <http://www.sciencedirect.com/science/article/pii/S0734743X13001565>.
[26]Seisson G, Hébert D, Hallo L, Chevalier JM, Guillet F, Berthe L, et al. Penetration and cratering experiments of graphite by 0.5-mm diameter steel spheres at various impact velocities. Int J Impact Eng 2014;70(0):14–20.<http://dx.doi.org/ 10.1016/j.ijimpeng.2014.03.004>, <http://www.sciencedirect.com/science/ article/pii/S0734743X14000724>.
[27]Jodar B, Seisson G, Hébert D, Bertron I, Boustie M, Berthe L. Enhancement of a dynamic porous model considering compression-release hysteresis behavior: application to graphite. Int J Impact Eng 2015;Submitted.
[28]Luli. Luli200.<www.luli.polytechnique.fr/accueil/les-installations/luli2000>; 2014 [accessed 09.15].
[29]Barker LM, Hollenbach RE. Laser interferometer for measuring high velocities of any reflecting surface. J Appl Phys 1972;43(11):4669–75.<http://dx.doi.org/
10.1063/1.1660986>, <http://scitation.aip.org/content/aip/journal/jap/43/ 11/10.1063/1.1660986>.
[30]Strand OT, Goosman DR, Martinez C, Whitworth TL, Kuhlow WW. Compact system for high-speed velocimetry using heterodyne techniques. Rev Sci Instrum 2006;77(8):1–8. doi:10.1063/1.2336749.
[31]Mercier P, Bénier J, Frugier PA, Sollier A, Le Gloahec Rabec M, Lescoute E, et al. PDV measurements of ns and fs laser driven shock experiments on solid targets. AIP Conf Proc 2009;1195(1):581–4.<http://dx.doi.org/10.1063/1 .3295205>, <http://scitation.aip.org/content/aip/proceeding/aipcp/10.1063/1 .3295205>.
[32]Hébert D, Hallo L, Voisin L, Desanlis T, Galtié A, Bicrel B, et al. A KDP equation of state for laser-induced damage applications. J Appl Phys 2011;109(12): 123527.<http://dx.doi.org/10.1063/1.3600210>, <http://scitation.aip.org/ content/aip/journal/jap/109/12/10.1063/1.3600210>.
[33]Loison D, de Rességuier T, Dragon A. Ballistic properties of debris produced by laser shock-induced micro-spallation of tin samples. J Phys Conf Ser 2014;500(11):1–6.<http://stacks.iop.org/1742-6596/500/i=11/a=112041>.
[34]Lescoute E, De Rességuier T, Chevalier JM, Boustie M, Berthe L, Cuq-Lelandais JP. Transverse shadowgraphy and new recovery technique to investigate dynamic fragmentation of laser shock-loaded metals. AIP Conf Proc 2009; 1195(1):1043–6.<http://dx.doi.org/10.1063/1.3294979>, <http://scitation.aip .org/content/aip/proceeding/aipcp/10.1063/1.3294979>.
[35]Frugier PA. Quantification 3D d’une surface dynamique par lumière laser structurée en impulsion nanoseconde. Application à la physique des chocs, du millimètre au décimètre [Ph.D. thesis]. Université Paris Sud; 2015.
[36]Poco. Poco website.<www.poco.com>; 2014 [accessed 12.15].
[37]Sheppard RG, Morgan D, Mathes DM, Bray DJ, editors. Properties and characteristics of graphite for the EDM industry. 5th ed. Poco Graphite, Inc.; 2002.
[38]Seisson G. Étude expérimentale et théorique de l’endommagement du graphite sous sollicitation dynamique – Application aux impacts hypervéloces [Ph.D. thesis]. École Nationale Supérieure de Mécanique et d’Aérotechnique; 2014.
[39]Grady DE. Local inertial effects in dynamic fragmentation. J Appl Phys 1982;53:322–5.