HAL Id: lirmm-01959343
https://hal-lirmm.ccsd.cnrs.fr/lirmm-01959343
Submitted on 18 Dec 2018
HAL is a multi-disciplinary open access
archive for the deposit and dissemination of
sci-entific research documents, whether they are
pub-lished or not. The documents may come from
teaching and research institutions in France or
abroad, or from public or private research centers.
L’archive ouverte pluridisciplinaire HAL, est
destinée au dépôt et à la diffusion de documents
scientifiques de niveau recherche, publiés ou non,
émanant des établissements d’enseignement et de
recherche français ou étrangers, des laboratoires
publics ou privés.
To cite this version:
Alexis Joly, Stefanos Vrochidis, Kostas Karatzas, Ari Karppinen, Pierre Bonnet. Multimedia Tools
and Applications for Environmental & Biodiversity Informatics. Springer International Publishing,
2018, 978-3-319-76445-0. �10.1007/978-3-319-76445-0�. �lirmm-01959343�
the citizen scientists all around the world,
who invest their time, capacity and
knowledge, to develop research projects with
scientific community. Several research results
presented in this book could not have been
reached, without a large and massive
investment of citizens, this is why authors
would like to thank in the broad sense, the
citizen scientist community.
The recent and rapid advancements of digital technologies have resulted in a great increase of multimedia data production worldwide. This is also the case for multimedia data that characterize our environment and the earth biodiversity and reflect their status, behavior, change as well as human interests and concerns. Such data becomes more and more crucial for understanding environmental issues and phenomena. Therefore, there is an increasing need for the development of advanced methods, techniques and tools for collecting, managing, analysing, understanding and modeling environmental biodiversity data. This edited volume focuses on the last and most impactful advancements of this field. It provides important recommendations for the implementation of computational platforms dedicated to environmental monitoring or citizen science observatories. It gives innovative and detailed architectures and specifications for the development of real-time, highly scalable, detection systems. Finally, it demonstrates the effectiveness of Computational Intelligence approaches in the analysis and modeling of relevant data. Alexis Joly Pierre Bonnet Stefanos Vrochidis Kostas Karatzas Ari Karppinen vii
1 Introduction . . . 1
Alexis Joly, Pierre Bonnet, Stefanos Vrochidis, Kostas Karatzas, and Ari Karppinen 1.1 From field studies to multimedia data flows . . . 1
1.2 Book content overview . . . 5
References . . . 7
2 Developing mobile applications for environmental and biodiversity citizen science: considerations and recommendations . . . 10
Soledad Luna, Margaret Gold, Alexandra Albert, Luigi Ceccaroni, Bernat Claramunt, Olha Danylo, Muki Haklay, Renzo Kottmann, Christopher Kyba, Jaume Piera, Antonella Radicchi, Sven Schade, and Ulrike Sturm 2.1 Introduction . . . 10
2.2 Interoperability . . . 11
2.2.1 Data and Metadata Standards . . . 12
2.2.2 Data Sharing and Access . . . 12
2.2.3 Data Sharing with Participants . . . 13
2.2.4 Open Data and Licensing . . . 14
2.2.5 Software Reuse . . . 14
2.2.6 Software Reusability . . . 15
2.2.7 Data Management and Data Privacy . . . 15
2.2.8 Data Quality . . . 16
2.2.9 Data Policy Transparency . . . 17
2.3 Participant Centered Design and Agile Development . . . 17
2.4 User Interface and User Experience Design . . . 18
2.4.1 Mobile Applications and Websites . . . 18
2.4.2 UI/UX Best Practice in the Software Development and Design Literature . . . 19
2.4.3 UI/UX Considerations Specific to Citizen Science Projects . . . 20
2.5.4 Reward-based Motivations - Sustaining Long-term
Engagement . . . 24
2.6 Discussion and Conclusions . . . 25
References . . . 26
3 A toolbox for understanding and implementing a citizens’ observatory on air monitoring . . . 31
Hai-Ying Liu, Mike Kobernus, Mirjam Fredriksen, Yaela Golumbic, and Johanna Robinson 3.1 Introduction . . . 32
3.2 Overview of the Citizens’ Observatories Toolbox . . . 33
3.3 Citizens’ Observatories Toolbox Users’ and developers’ perspective . . . 34
3.3.1 Users’ perspective . . . 35
3.3.2 Developers’ perspective . . . 37
3.4 Examples for using Citizens’ Observatories Toolbox . . . 45
3.4.1 Example 1 Raising students’ awareness to air quality concepts in Haifa . . . 45
3.4.2 Example 2 Citizens’ observatories with users being parents with Children and regular citizens in Oslo . . . 46
3.4.3 Example 3 Organizing Nature Days for Children . . . 47
3.5 Conclusion . . . 47
References . . . 49
4 A Real-Time Streaming and Detection System for Bio-acoustic Ecological Studies after the Fukushima Accident . . . 51
Hill Hiroki Kobayashi, Hiromi Kudo, Herv´e Glotin, Vincent Roger, Marion Poupard, Daisuk´e Shimotoku, Akio Fujiwara, Kazuhiko Nakamura, Kaoru Saito, and Kaoru Sezaki 4.1 Introduction . . . 51 4.2 Background . . . 52 4.3 Developed system . . . 54 4.4 Data Processing . . . 56 4.5 Results . . . 58 4.6 Discussion . . . 59 4.7 Conclusion . . . 62 References . . . 63
5 Towards improved air quality monitoring using publicly available
sky images . . . 65
Eleftherios Spyromitros-Xioufis, Anastasia Moumtzidou, Symeon Papadopoulos, Stefanos Vrochidis, Yiannis Kompatsiaris, Aristeidis K. Georgoulias, Georgia Alexandri, and Konstantinos Kourtidis 5.1 Introduction . . . 65
5.2 Related Work . . . 66
5.3 Overall air quality monitoring framework . . . 69
5.4 Public image collection . . . 70
5.4.1 Social media platforms . . . 70
5.4.2 Webcam image collector . . . 71
5.4.3 Image collection statistics . . . 73
5.5 Image analysis for sky detection and localization . . . 73
5.5.1 Sky detection . . . 74
5.5.2 Sky localization . . . 75
5.6 Air quality estimation based on sky color statistics . . . 80
5.7 Conclusions and future work . . . 85
References . . . 86
6 Traits: Structuring species information for discoverability, navigation and identification . . . 89
Thomas Vattakaven, Prabhakar Rajagopal, Balasubramanian Dhandapani, Pierre Grard, and Thomas Le Bourgeois 6.1 Introduction . . . 90
6.2 Our implementation of the traits infrastructure . . . 91
6.3 Applications of a trait based infrastructure . . . 93
6.3.1 Structuring information . . . 93
6.3.2 Bridging species with non-taxonomical linkages . . . 97
6.3.3 Using traits for species Identification . . . 98
6.3.4 Querying by traits . . . 99
6.3.5 Traits for organizing multimedia on species . . . 100
6.4 Summary and scope for expansion . . . 101
6.4.1 Traits and Ontology . . . 101
6.4.2 Traits for machine learning and image analysis . . . 102
References . . . 104
7 Unsupervised Bioacoustic Segmentation by Hierarchical Dirichlet Process Hidden Markov Model . . . 109
Vincent Roger, Marius Bartcus, Faicel Chamroukhi, and Herv´e Glotin 7.1 Introduction . . . 110
7.1.1 Related work . . . 111
7.2 Data and Methods . . . 112
7.2.1 Humpback whale data . . . 112
7.2.2 Multi-species bird data . . . 112
7.2.3 Method: Unsupervised learning for signal representation . 113 7.3 Bayesian non-parametric alternative for Hidden Markov Model . . . 113
7.5 Conclusions . . . 119
References . . . 121
8 Plant Identification: Experts vs. Machines in the Era of Deep Learning . . . 127
Pierre Bonnet, Herv´e Go¨eau, Siang Thye Hang, Mario Lasseck, Milan ˇSulc, Val´ery Mal´ecot, Philippe Jauzein, Jean-Claude Melet, Christian You, and Alexis Joly 8.1 Introduction . . . 128
8.2 Understanding the plant identification process by botanists . . . 129
8.3 State-of-the-art of automated plant identification . . . 131
8.3.1 Dataset and evaluation protocol . . . 132
8.3.2 Evaluated systems . . . 133
8.3.3 Results . . . 134
8.4 Human vs. Machine experiment . . . 135
8.4.1 Progress made since 2014 . . . 136
8.4.2 Experts vs. Machines experiment (2017) . . . 138
8.5 Conclusion and perspectives . . . 142
References . . . 143
9 Automated identification of herbarium specimens at different taxonomic levels . . . 145
Jose Carranza-Rojas, Alexis Joly, Herve Goeau, Erick Mata-Montero, and Pierre Bonnet 9.1 Introduction . . . 146 9.2 Related Work . . . 147 9.3 Methodology . . . 148 9.3.1 Datasets . . . 148 9.3.2 Unbalanced dataset . . . 149 9.3.3 Architectures . . . 149 9.4 Experiments . . . 154
9.4.1 Baseline Experiments: Flat Classification Model (FCM) . 154 9.4.2 Architecture Comparison Experiment . . . 154
9.5 Results . . . 155
9.5.1 Flat Classification Model (FCM) Baseline Results . . . 155
9.5.2 Architecture Comparison Results . . . 155
9.6 Conclusions . . . 158
9.7 Future Work . . . 159
10 A deep learning approach to species distribution modelling . . . 161
Christophe Botella, Alexis Joly, Pierre Bonnet, Pascal Monestiez, and Franc¸ois Munoz 10.1 Introduction . . . 162
10.1.1 Context on species distribution models . . . 162
10.1.2 Interest of deep and convolutional neural networks for SDM . . . 163
10.1.3 Contribution . . . 165
10.2 A Deep learning model for SDM . . . 165
10.2.1 A large-scale Poisson count model . . . 165
10.2.2 Links with MAXENT . . . 168
10.2.3 SDM based on a fully-connected NN model . . . 169
10.2.4 SDM based on a convolutional NN model . . . 171
10.3 Data and methods . . . 173
10.3.1 Observations data of INPN . . . 173
10.3.2 Species selection . . . 173
10.3.3 Environnemental data . . . 175
10.3.4 Detailed models architectures and learning protocol . . . 179
10.3.5 Evaluation metrics . . . 181
10.4 Results . . . 182
10.4.1 Quantitative results analysis. . . 183
10.4.2 Qualitative results analysis . . . 185
10.5 Discussion . . . 187
10.6 Conclusion . . . 189
References . . . 189
A Existing Data and Metadata Standards and Schemas related to Citizen Science . . . 193
B Creative Commons (CC) and Open Data Commons (ODC) Licenses . 197 C List of Apps, Platforms and their Functionalities in Citizen Science Projects . . . 199
D Examples of Symbolic and Non-symbolic Rewards in Citizen Science Projects . . . 209 E List of Apps for Sonic Environment and Noise Pollution Monitoring . 211
Alexandra Albert
University of Manchester, UK, e-mail: [email protected] Georgia Alexandri
Democritus University of Thrace, Xanthi, Greece, e-mail: [email protected] Marius Bartcus
DYNI team, LIS UMR CNRS 7020, AMU, University of Toulon, France, e-mail: [email protected]
Pierre Bonnet
CIRAD, UMR AMAP, France,
AMAP, Univ Montpellier, CIRAD, CNRS, INRA, IRD, Montpellier, France, e-mail: [email protected]
Christophe Botella
INRIA Sophia-Antipolis - ZENITH team, LIRMM - UMR 5506 - CC 477, 161 rue Ada, 34095 Montpellier Cedex 5, France
INRA, UMR AMAP, F-34398 Montpellier, France
AMAP, Univ Montpellier, CIRAD, CNRS, INRA, IRD, Montpellier, France BioSP, INRA, Site Agroparc, 84914 Avignon, France, e-mail:
[email protected] Jose Carranza-Rojas
Costa Rica Institute of Technology, Cartago, Costa Rica e-mail: [email protected] Luigi Ceccaroni
1000001 Labs, Barcelona, Spain, e-mail: [email protected]
Catalonia,
Ecology Unit (BABVE), Autonomous University of Barcelona (UAB), Bellaterra, Catalonia e-mail: [email protected]
Olha Danylo
International Institute for Applied Systems Analysis (IIASA), Laxenburg, Austria, e-mail: [email protected]
Balasubramanian Dhandapani
French Institute of Pondicherry UMIFRE 21 CNRS-MAEE, Pondicherry, India, e-mail: [email protected]
Mirjam Fredriksen
NILU – Norwegian Institute for Air Research, Kjeller 2027, Norway, Akio Fujiwara
CSIS, GSFS, GSALS, The University of Tokyo, 7-3-1 Hongo, Bunkyo-ku, Tokyo 113-8654, Japan, e-mail: [email protected]
Aristeidis K. Georgoulias
Democritus University of Thrace, Xanthi, Greece, e-mail: [email protected] Herv´e Glotin
DYNI team, LIS UMR CNRS 7020, AMU, University of Toulon, France, e-mail: [email protected]
Herv´e Go¨eau
CIRAD, UMR AMAP, France,
AMAP, Univ Montpellier, CIRAD, CNRS, INRA, IRD, Montpellier, France, e-mail: [email protected]
Margaret Gold
National History Museum London, London, UK, e-mail: [email protected] Yaela Golumbic
Pierre Grard
CIRAD, Nairobi, Kenya, e-mail: [email protected] Muki Haklay
Extreme Citizen Science (ExCiteS), University College London, UK, e-mail: [email protected]
Siang Thye Hang
Toyohashi University of Technology, Japan, e-mail: [email protected] Philippe Jauzein
AgroParisTech UFR Ecologie Adaptations Interactions, Thiverval-Grignon, France, e-mail: [email protected]
Alexis Joly
Inria ZENITH team, France, e-mail: [email protected] Kostas Karatzas
Aristotle University of Thessaloniki, Thessaloniki, Greece, e-mail: [email protected]
Ari Karppinen
Finnish Meteorological Institute, Helsinki, Finland, e-mail: [email protected] Hill Hiroki Kobayashi
CSIS, GSFS, GSALS, The University of Tokyo, 7-3-1 Hongo, Bunkyo-ku, Tokyo 113-8654, Japan, e-mail: [email protected]
Mike Kobernus
NILU - Norwegian Institute for Air Research, Kjeller 2027, Norway, Yiannis Kompatsiaris
Centre for Research & Technology Hellas - Information Technologies Institute, Thessalonki, Greece, e-mail: [email protected]
Renzo Kottmann
Max Planck Institute for marine Microbiology, Celsiusstr, Bremen, Germany, e-mail: [email protected]
Konstantinos Kourtidis
Democritus University of Thrace, Xanthi, Greece, e-mail: [email protected] Hiromi Kudo
Mario Lasseck
Museum fuer Naturkunde Berlin, Leibniz Institute for Evolution and Biodiversity Science, Germany, e-mail: [email protected]
Thomas Le Bourgeois
CIRAD, UMR AMAP, Montpellier, France, e-mail: thomas.le [email protected] Hai-Ying Liu
NILU - Norwegian Institute for Air Research, Kjeller 2027, Norway, e-mail: [email protected]
Soledad Luna
European Citizen Science Association (ECSA) Institute of Forest Growth and Computer Science, Technische Universit¨at, Dresden, Germany,
Nazca Institute for Marine Research, e-mail: [email protected] Val´ery Mal´ecot
IRHS, Agrocampus-Ouest, INRA, Universit´e d’Angers, Angers, France, e-mail: [email protected]
Erick Mata-Montero
Costa Rica Institute of Technology, Cartago, Costa Rica e-mail: [email protected] Jean-Claude Melet,
France, e-mail: [email protected] Pascal Monestiez
BioSP, INRA, Site Agroparc, 84914 Avignon, France e-mail: [email protected]
Anastasia Moumtzidou
Centre for Research & Technology Hellas - Information Technologies Institute, Thessalonki, Greece, e-mail: [email protected]
Franc¸ois Munoz
Universit´e Grenoble Alpes, 621 avenue Centrale, 38400 Saint-Martin-d’Hres, France, e-mail: [email protected]
Kazuhiko Nakamura
CSIS, GSFS, GSALS, The University of Tokyo, 7-3-1 Hongo, Bunkyo-ku, Tokyo 113-8654, Japan, e-mail: k [email protected]
Symeon Papadopoulos
Centre for Research & Technology Hellas - Information Technologies Institute, Thessalonki, Greece, e-mail: [email protected]
Jaume Piera
Institute of Marine Sciences (ICM-CSIC), Barcelona, Spain, e-mail: [email protected]
Marion Poupard
DYNI team, LIS UMR CNRS 7020, AMU, University of Toulon, France, e-mail: [email protected]
Antonella Radicchi
Technical University Berlin, Germany, e-mail: [email protected] Prabhakar Rajagopal
Strand Life Sciences, Bangalore, India, e-mail: [email protected] Johanna Robinson
JSI - Joˇzef Stefan Institute, Jamova cesta 39, 1000, Ljubljana, Slovenia, Vincent Roger
DYNI team, LIS UMR CNRS 7020, AMU, University of Toulon, France, e-mail: [email protected]
Kaoru Saito
CSIS, GSFS, GSALS, The University of Tokyo, 7-3-1 Hongo, Bunkyo-ku, Tokyo 113-8654, Japan, e-mail: [email protected]
Sven Schade
European Commission, Joint Research Centre (JRC), Unit B06-Digital Economy, Via Enrico Fermi, 2749 I-21027 Ispra (VA), Italy, e-mail: [email protected] Kaoru Sezaki
CSIS, GSFS, GSALS, The University of Tokyo, 7-3-1 Hongo, Bunkyo-ku, Tokyo 113-8654, Japan, e-mail: [email protected]
Daisuk´e Shimotoku
CSIS, GSFS, GSALS, The University of Tokyo, 7-3-1 Hongo, Bunkyo-ku, Tokyo 113-8654, Japan, e-mail: [email protected]
Science, Germany, e-mail: [email protected] Milan ˇSulc
Czech Technical University in Prague, Czech Republic, e-mail: [email protected]
Thomas Vattakaven
Strand Life Sciences, Bangalore, India, e-mail: [email protected] Stefanos Vrochidis
Centre for Research & Technology Hellas - Information Technologies Institute, Thessaloniki, Greece, e-mail: [email protected]
Christian You
Introduction
Alexis Joly, Pierre Bonnet, Stefanos Vrochidis, Kostas Karatzas, and Ari Karppinen
Abstract The recent and rapid advancements of digital technologies, as well as the progress of digital cameras and other various connected objects have resulted in a great increase of multimedia data production worldwide. Such data becomes more and more crucial for understanding environmental issues and phenomena, such as the greenhouse effect, global warming and biodiversity loss. Therefore, there is an increasing need for the development of advanced methods, techniques and tools for collecting, managing, analyzing and understanding environmental & biodiversity data. The goal of this introductory chapter is to give a global picture of that domain and to overview the research works presented in this book.
1.1 From field studies to multimedia data flows
During centuries, the study of earth biodiversity and environment mostly relied on field studies conducted by highly skilled experts from museums and universities who travelled the world to collect samples. Only recently did we see the emergence of alternative observation practices. First of all, the success of social networks and A. Joly,
Inria ZENITH team, France, e-mail: [email protected] P. Bonnet
CIRAD, UMR AMAP, F-34398 Montpellier, France — AMAP, Univ Montpellier, CIRAD, CNRS, INRA, IRD, Montpellier, France, e-mail: [email protected],
S. Vrochidis
Centre for Research & Technology Hellas - Information Technologies Institute, Thessaloniki, Greece e-mail: [email protected],
K. Karatzas
Aristotle University of Thessaloniki, Thessaloniki, Greece, e-mail: [email protected], A. Karppinen
Finnish Meteorological Institute, Helsinki, Finland e-mail: [email protected]
izen science projects have been launched all over the world during the last decade. To inventor them and facilitate experience sharing, dedicated portals have been de-veloped at the international and national level (such as SciStarter1, EU BON2, or NatureFrance3).
In parallel to the increased engagement of human observers, the development of new acquisition devices also boosted the emergence of alternative observation practices. Indeed, the quality, capacity and diversity of connected objects have progressed dra-matically during the last decade. These new devices can produce, store and transmit large volumes of data acquired automatically or semi-automatically. Smart phones in particular allow to dramatically increase the number of people in capacity to pro-duce simple but very useful information for environmental and biodiversity moni-toring. Besides, fully autonomous audio-visual sensors start to be installed all over the world such as underwater cameras [4], camera traps [6], fish-eye cameras [5], bio-acoustic recorders[1] or hydrophones [2]). All these devices produce huge data streams that are clearly under exploited today because of the lack of efficient tools to process them. A last important source of data that has emerged recently is the
digiti-Fig. 1.1 Biodiversity and Environment Monitoring Dataflow
1https://scistarter.com/finder
2http://biodiversity.eubon.eu/web/citizen-science/view-all 3http://www.naturefrance.fr/sciences-participatives
zation of old materials such as natural history collections. This digitization process has been largely accelerated these last years thanks to newly developed equipment and consistent dedicated funding. For instance, biological specimens have been mas-sively digitized in recent years [3] resulting in millions of digital records.
Based on the study of various initiatives that produce and exploit such multimedia data flows for biodiversity and environment monitoring, we can draw some stable patterns, as illustrated in Figure 6.1. As a first necessary step, environmental records or biodiversity observations have to be integrated in accessible databases. To facil-itate this step, common formats and international standards are being developed by the scientific community. For instance, the Taxonomic Databases Working Group (also known as Biodiversity Information Standards), is in charge of the develop-ment of standard formats for the exchange of biological/biodiversity data. As an other example, the Unidata Program Center is a diverse community of education and research institutions with the common goal of sharing geoscience data and the tools to access and visualize that data. Once made accessible, raw observation data often needs to be cleaned/or and enriched before being exploited. For instance, degraded, inconsistent or duplicated data samples might need to be filtered out. Or some mea-surements/properties might need to be extracted from raw audio-visual content (e.g. categorical names, objects count, color attributes, visible surfaces, etc.). Once made exploitable, observation data can be used for modelling and simulation. More and more often, this is done by combining several observation data sources (e.g. envi-ronmental data and species occurrences are combined for estimating species distri-bution models in ecology). The resulting models and simulation data can then be integrated in publicly available visualization tools. This allows different communi-ties of end users (experts and non experts) to appropriate the knowledge produced and to act accordingly. Then, the conclusions drawn from that knowledge might be used for the planning of new observation campaigns.
Fig . 1.2 Biodi v ersity and En vironment Monitoring W orkflo w
1.2 Book content overview
Figure 1.2 presents an overview of the typical processing pipeline to be implemented when setting up an end-to-end environmental monitoring system. As illustrated by the Gantt chart below, the chapters of this book relate to one or several steps of this pipeline and were sorted based on their location within this pipeline.
Accordingly, the two first chapters are focused on data acquisition, in the specific context of citizen science and participatory sensing. Chapter 2 first highlights that the ubiquity of powerful mobile devices has brought about a proliferation of mobile phone based citizen science projects and suggests that there is a lack of systematic knowledge exchange on the development of mobile apps and web platforms for cit-izen science. The authors aim at filling this gap, specifically by surveying the key considerations for the effective development of mobile applications and web plat-forms. As a concrete illustration of this research field, chapter 3 presents an existing platform that was developed within a European project for the understanding and implementing of citizens observatory on air monitoring. It presents a number of tools from the user and the developer perspective that together provide the founda-tion of a citizens observatory.
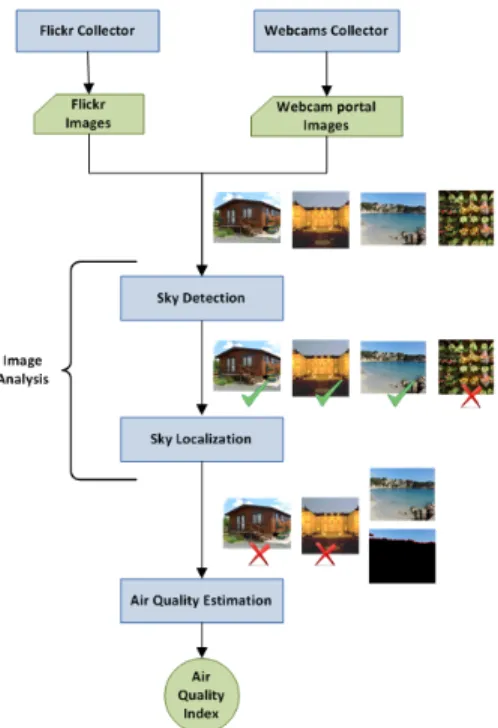
Chapters 4 and 5 are rather focused on the presentation of automated monitoring systems. Chapter 4 presents a real-time streaming and detection system for bio-acoustic ecological studies after the Fukushima accident. Audio recordings were continuously collected within the exclusion (i.e., difficult-to-return-to) zone located 10 km from the Fukushima Daiichi Nuclear Power Plant in the Omaru District (Namie, Fukushima, Japan). The authors describe the potential of this live stream of sound data from an unmanned remote station as well as the methodologies by which they processed these recordings as eco-acoustic indexes for demonstrating possible correlations between biodiversity variation and preexisting radioecology observations. As a last remarkable monitoring system, chapter 5 presents an end-to-end framework for automatic air quality evaluation from raw images collected from social media. The framework includes three main parts: i) a timestamped and geo-tagged data collection mechanism, ii) a sky detection/localization system that aims at retaining only images containing sky and highlighting only sky related pix-els and iii) an air quality evaluation algorithm based on sky related pixel intensities evaluation (only applied to sky related pixels identified by the previous module). As illustrated on Figure 1.2, the remaining chapters are more focused on specific steps of the overall processing pipeline. First of all, chapter 6 deals with data integra-tion and knowledge representaintegra-tion issues. In particular, it discusses the challenges related to the aggregation and the exploitation of traits in an information system. Traits are a crucial information for structuring and accessing to the knowledge about any living organism (e.g. morphology, taxonomy, functional role, habitat, ecological interactions, etc.). The paper addresses several challenging tasks such as aggregating such information, structuring it for a better navigation and then exploiting it for new applications. Regarding the two first steps, the paper introduces a concrete platform (BIP, standing for Biodiversity Informatics Platform) dedicated to the integration of species information and specimen observations from both experts and citizens.
reveal the diversity of sounds emitted for animal communication at the intra-level species and at an inter-level species. This study demonstrates new insights for unsu-pervised analysis of complex soundscapes and illustrates their potential of chunking non-human animal signals into structured units. This can yield to new representa-tions of the calls of a target species, but also to the structuring of inter-species calls. Chapter 8 rather deals with the automated identification of plants in images. This challenging task improved considerably in the last few years, in particular thanks to the recent advances in deep learning. The central question addressed within the chapter is to know how far such automated systems are from the human expertise. Indeed, even the best experts are sometimes confused and/or disagree between each others when validating visual or audio observations of living organism. A picture or a sound actually contains only a partial information that is usually not sufficient to determine the right species with certainty. Quantifying this uncertainty and compar-ing it to the performance of automated systems is of high interest for both computer scientists and expert naturalists. Chapter 9 also addresses the problem of identifying plant groups in images but it differs in two main points. First of all, it deals with digitized herbarium specimens rather than in-the-field photographs as in the previ-ous chapter. The problem is more challenging in that the preservation process of pressing and drying plants for herbarium purposes might cause important changes and loss of information. Furthermore, the paper considers the problem of predict-ing the genus and the family of the samples and not only the species taxonomic level. They introduce several deep learning architectures that are compared through a large-scale comparative study involving thousand of species.
Last but not least, chapter is the only one that is centrally focused on modelling is-sues. It shows that multimedia technologies can have a great contribution at this level of analysis. More precisely, it proposes a deep learning approach to species distri-bution modelling (SDM) that is a central problem in ecology. Given a set of species occurrence, the aim is to infer its spatial distribution over a given territory. Because of the limited number of occurrences of specimens, this is usually achieved through environmental niche modeling approaches, i.e. by predicting the distribution in the geographic space on the basis of a mathematical representation of their distribu-tion in environmental space (temperature, precipitadistribu-tion, soil type, land cover, etc.). This study is the first one evaluating the potential of the deep learning approach for this problem. It shows that deep neural network and convolutional neural networks (CNN) in particular clearly outperform classical approaches used in ecological stud-ies, such as Maxent. This result is promising for future ecological studies developed in collaboration with naturalists expert. Actually, many ecological studies are based on models that do not take into account spatial patterns in environmental variables.
On the contrary, CNN can capture extra information contained in spatial patterns of environmental variables in order to surpass other classical approaches.
References
1. Wiggins, S. (2003). Autonomous acoustic recording packages (ARPs) for long-term monitor-ing of whale sounds. Marine Technology Society Journal, 37(2), 13-22.
2. Fox, C. G., Matsumoto, H., Lau, T. K. A. (2001). Monitoring Pacific Ocean seismicity from an autonomous hydrophone array. Journal of Geophysical Research: Solid Earth, 106(B3), 4183-4206.
3. Beaman, R. S., Cellinese, N. (2012). Mass digitization of scientific collections: New op-portunities to transform the use of biological specimens and underwrite biodiversity science. ZooKeys, (209), 7.
4. Fisher, R.B., Chen-Burger, Y.H., Giordano, D., Hardman, L., Lin, F.P.: Fish4Knowledge: Col-lecting and Analyzing Massive Coral Reef Fish Video Data, vol. 104. Springer (2016) 5. Nagai, S., Maeda, T., Gamo, M., Muraoka, H., Suzuki, R., Nasahara, K.N.: Using digital
camera images to detect canopy condition of deciduous broad-leaved trees. Plant Ecology & Diversity 4(1), 79–89 (2011)
6. Silver, S.C., Ostro, L.E., Marsh, L.K., Maffei, L., Noss, A.J., Kelly, M.J., Wallace, R.B., G´omez, H., Ayala, G.: The use of camera traps for estimating jaguar panthera onca abundance and density using capture/recapture analysis. Oryx 38(2), 148–154 (2004)
Developing mobile applications for
environmental and biodiversity citizen science:
considerations and recommendations
Soledad Luna, Margaret Gold, Alexandra Albert, Luigi Ceccaroni, Bernat Claramunt, Olha Danylo, Muki Haklay, Renzo Kottmann, Christopher Kyba, Jaume Piera, Antonella Radicchi, Sven Schade, and Ulrike Sturm
Soledad Luna
European Citizen Science Association (ECSA) Institute of Forest Growth and Computer Science, Technische Universit¨at, Dresden, Germany,
Nazca Institute for Marine Research, e-mail: [email protected] Margaret Gold
National History Museum London, London, UK, Alexandra Albert
University of Manchester, UK, Luigi Ceccaroni
1000001 Labs, Barcelona, Spain, Bernat Claramunt
CREAF, Edifici Ci´encies, Autonomous University of Barcelona (UAB), Bellaterra, Catalonia, Ecology Unit (BABVE), Autonomous University of Barcelona (UAB), Bellaterra, Catalonia Olha Danylo
International Institute for Applied Systems Analysis (IIASA), Laxenburg, Austria, Muki Haklay
Extreme Citizen Science (ExCiteS), University College London, UK, Renzo Kottmann
Max Planck Institute for marine Microbiology, Celsiusstr, Bremen, Germany, Christopher Kyba
GFZ German Research Centre for Geosciences, Potsdam, Germany, Jaume Piera
Institute of Marine Sciences (ICM-CSIC), Barcelona, Spain, Antonella Radicchi
Technical University Berlin, Germany, Sven Schade
European Commission, Joint Research Centre (JRC), Unit B06-Digital Economy, Via Enrico Fermi, 2749 I-21027 Ispra (VA), Italy,
Ulrike Sturm
Museum f¨ur Naturkunde Berlin, Leibniz Institute for Evolution and Biodiversity Science, Ger-many,
to access these device features (such as the camera, the microphone, and GPS lo-cation data), as well as to reach different user groups, over different project dura-tions, and with different aims and goals. In this chapter we outline a number of key considerations when designing and developing mobile applications for citizen sci-ence, with regard to 1) Interoperability. The factors that influence the usability of the mobile application are covered in both 2) Participant Centred Design and Agile Development, and 3) User Interface and Experience Design. Finally, the factors that influence sustained engagement in the project are covered in 4) Motivational Factors for Participation.
2.1 Introduction
Many modern day citizen science projects are powered by mobile and web tech-nologies, which enable the general public to take part in research and contribute to scientific knowledge around the globe [1, 2, 3, 5]. The nature of these apps and web platforms vary almost as greatly as the underlying science [6, 7, 8, 9], and so do the ways in which participants interact with their mobile devices and with other participants.
A systematic search of citizen science projects conducted by Pocock et al. [10] found 509 projects that fit the definition of environmental and ecological citizen science, of which 77% were focused on biodiversity rather than the abiotic environ-ment, and 93% invited volunteers purely to contribute data, as opposed to taking a collaborative or co-created project approach. Of those 509 projects, 142 requested the submission of a photo as the core data type, 62 projects were found to require a smartphone for their execution, and 5 made use of SMS messaging.
Mobile applications to support environment and biodiversity monitoring are most commonly used to record the presence and location of native and invasive species, to date and geo-reference different biological events such as reproduction, and to identify patterns of land or seabed cover [11, 8].
In order to be successful, most citizen science projects require a sufficient num-ber of participants over an extended period of time. Furthermore, the ability to meet the goals of the project will depend on the usability of the mobile application from the user’s perspective, its effectiveness in carrying out its purpose from the research perspective, and whether the project itself is able to communicate and disseminate the apps and web platform to the public and sustain their engagement for a suffi-ciently long period of time.
Each of these factors present a range of unique challenges and pitfalls to be taken into consideration when designing and building a mobile app and web platform.
To the best of our knowledge, there is no systematic exchange of experience, knowledge, and gaps-to-be-addressed for the development of such mobile apps and web platforms for citizen science. We therefore asked citizen science practitioners and project managers to identify key considerations for the effective development of mobile applications and their adherent web platforms. We did this by way of two workshops on the topic of Defining Principles for Apps and Platform Development for Citizen Science that were held in Berlin on the 13th and 14th of December, 2016, and in Gothenburg on the 25th to 27th of April, 2017, in which a total of 75 practitioners took part in person or online.
This chapter summarises the outcomes of these workshops and online contribu-tions, wherein we highlight a number of considerations for the designing, building and development of effective and sustainable applications for environmental and biodiversity mobile-based citizen science projects. The definitions of the terminol-ogy that we use in this chapter were discussed during the workshops and agreed upon among participants (Figure 1).
In this chapter, the factors that we deem important to consider and plan for at the outset of the design and build phase are described in 1) Interoperability. The factors that influence the usability of the mobile application are covered in both 2) Participant Centred Design and Agile Development, and 3) User Interface and Experience Design. Finally, the factors that influence sustained engagement in the project are covered in 4) Motivational Factors for Participation.
2.2 Interoperability
Interoperability can refer to the ability of humans and machines to pass information between each other via shared terminology and semantic metadata [12], or to the ability of computer systems or software to exchange information between each other and make use of that information [13].
In this chapter we focus on systems interoperability, but recognise that shared terminology (which can range as widely as citizen science, crowdsourcing, citizen engagement, public participation in science, voluntary mapping, and more) between practitioners in the field, and between participants and project initiators is equally vital. Unifying these terms greatly assists wih the sharing of knowledge and emerg-ing best practice amongst those developemerg-ing apps for citizen science [14]. Semantics is even more important in conversations between humans and machines, or between machines [15].
Citizen science participant / citizen scientist: a member of the general public who does not necessarily have scientific training, who takes part in a citizen science project on a voluntary basis.
Citizen science practitioner: anyone involved in the active development of citizen science, e.g. researcher/scientist, project manager, technical person, science communication professionals, educators, volunteer contributor, authorities, institutions, NGOs, etc. Data: information collected in an electronic format that can be stored and used by a computer.
Forking / Software Fork: to develop a new variant of the software on the same code basis but often with an entirely new branding.
Platform: a (computing) platform is a technical framework on which one or more
applications may be run and where data are kept. For the purposes of user interaction (UI) and user experience (UX), the term "website" instead of platform will be used.
Portal: web-site providing access or links to other sites. Here, especially pointing to apps, platforms, projects etc.
Fig. 2.1 List of terminology used in this chapter. Definitions were agreed upon among workshop participants.
2.2.1 Data and Metadata Standards
A common or interoperable structure and representation for data and metadata is needed in order to ensure that data can be shared and aggregated with other cur-rent and future projects. Such (meta)data includes information about citizen science projects, datasets, tools used (software, hardware, apps, instruments, sensors), and (domain specific) observations made by participants. Different organisations use different software solutions to organize knowledge gathered in or used by citizen science projects. These solutions can facilitate or impede interoperability. A num-ber of existing data standards and metadata schemas that are used in citizen science projects are presented in Appendix A. More schemas and their documentation can, for example, be found at schema.org.
2.2.2 Data Sharing and Access
In order to aid data sharing across scientific applications, research projects and aca-demic papers, a universally unique identifier (UUID) is assigned to each observation
or data point in order to avoid duplication in global databases (such as the Global Biodiversity Information Facility - GBIF1), and to be uniquely identified without significant central coordination.
After following a data model or schema as described in Appendix A, we recom-mend that the data is made available to other researchers via a data service, most usually on the web via an Application Programming Interface (API). A range of standards are available for this purpose. Some are more complex and have a high learning curve but capture a rich set of diverse use cases (thus allowing for a high degree of interoperability). Examples of more lightweight alternatives come from within the Web Services of the Open Geospatial Consortium (OGC) and include the Web Feature Service2or the Sensor Web Enablement suite of standards3. These cover less rich structures but are more easy to learn and apply. Another example outside the OGC is the recently revised Semantic Sensor Network (SSN) ontology of the World Wide Web Consortium (W3C)4, which may for example be queried via SPARQL5, a dedicated language to query information sources following the Linked Data paradigm [16].
2.2.3 Data Sharing with Participants
Two very important principles for any citizen science project, as stated in the ECSA 10 Principles of Citizen Science6, are a) that citizen scientists receive feedback from the project in terms of how their data are being used and what the research, policy or societal outcomes are (Principle Four), and b) that project data and metadata are made publicly available and where possible, results are published in an open access format (Principle Seven).
It is therefore vital that project initiators plan for the sharing of both data and out-comes when establishing the project communication channels, with the participants of the project in mind, not just fellow researchers and scientists in the relevant fields. Both data and outcomes should be presented in a format that is easy for participants to navigate and understand.
Pocock et al. [10] found that mass participation projects were more likely to present their data dynamically (e.g. in real time rather than in summary reports) and in an elaborate format, whereas simple projects and entirely computer-based projects were less likely to make data available to view and download at a high resolution (e.g. full dataset, rather than data summaries or reports).
1gbif.org
2opengeospatial.org/standards/wfs
3opengeospatial.org/ogc/markets-technologies/swe 4w3.org/TR/vocab-ssn/
5w3.org/TR/rdf-sparql-query/
2.2.4 Open Data and Licensing
Open data licenses, such as those from the Creative Commons shown in Appendix B allow for the reuse of data, and can take different countries’ regulations into account when a project is global or multi-national in scope. Among the Creative Commons licenses, GBIF recommends the use of No rights reserved (CC0), BY, or CC-BY-NC. Other formats such as the Open Data Commons licenses are particularly well suited for data licensing in a citizen science context, as pointed out by Groom et al. [17], because the Creative Commons licenses were designed with creative content in mind.
2.2.5 Software Reuse
Existing apps can be reused for biodiversity monitoring when requiring little cus-tomization, avoiding the need to create a new application from scratch. Examples that offer an excellent solution are iNaturalist, Natusfera or iSpot (see Appendix C for more examples).
Another option is to use platforms that have been built to support multiple mobile-based projects, such as the Spotteron10platform service for fully-customisable smartphone applications for citizen science, or the Epicollect 511platform for cre-ating bespoke mobile questionnaires with data mapping on a hosted website.
Yet one of the challenges for reusability remains the aspect of discovery. So far, no comprehensive repository of reusable mobile applications for citizen science ex-ists. However there are several global and national citizen science project directories that are a useful source of information about the full range of projects and the tools that they use, such as:
• SciStarter12
• Citizen Science Central13
7emodnet.eu
8earthobservations.org/geoss.php and geoportal.org/ 9gbif.org/ipt
10spotteron.net 11five.epicollect.net 12scistarter.com
• CitSci14
• Scientific American15
• UK Environmental Observation Framework16
• The Federal Crowdsourcing and Citizen Science Catalog17 • Biocollect-Atlas of Living Australia18
• B¨urger schaffen Wissen19 • Citizen Science Austria20 • Schweiz Forscht21
• Iedereen een Wetenschapper22
2.2.6 Software Reusability
Since open source apps and platforms permit a higher level of customization and take advantage of a well-developed code base, it is valuable to open and share the code on a public repository such as GitHub. To maximise reuse, a good repository will include code documentation, requirement specifications, design specifications, test scenarios and results, lessons-learned documentation, and any other materials that will make it easy to ’fork’ the code for a new project.
For example, the application Natusfera used a copy of the source code from iNat-uralist and started an independent development on it, creating a distinct and sepa-rate piece of software. Therefore, Natusfera is a fork of iNaturalist, with its own database, look-and-feel, and special functionalities such as enabling project hierar-chies.
Additionally, forking open code facilitates the interoperability with the original database, and contributes to the growth of the two platforms by sharing improve-ments to the underlying base code.
2.2.7 Data Management and Data Privacy
Data Management has become one of the central challenges to emerge with the growth of citizen science projects [18, 19]. One important aspect of this is data
pri-14citsci.org 15scientificamerican.com/citizen-science/ 16ukeof.org.uk/catalogue 17ccsinventory.wilsoncenter.org 18biocollect.ala.org.au 19buergerschaffenwissen.de 20citizen-science.at 21schweiz-forscht.ch 22iedereenwetenschapper.nl
UK Information Commisioner’s Office Guidelines for Small Businesses collecting information about their customers23). For example, if data points will be shown on a publicly available map, it is critical that the participants understand and consent to this, as observations taken and shared may reveal home locations or other personal details, even if their user ID is anonymized.
Moreover, project managers are responsible for secure data transmission and storage. Personal data have to be deleted as soon as possible if they are no longer needed to meet the objectives of the project. In other cases, data can be obfuscated using reliable methods that keep the data meaningful, but without disclosing details about the participant [20, 21].
These aspects of data management in citizen science are starting to gain attention in the literature. Bastin et al. [22] present the current state of the art regarding data management practices, schemas and tools, along with best-practice examples, and a range of open source technologies which can underpin robust and sustainable data management for citizen science. Additionally, Williams et al. [23] discuss how to sustain and maximize the impact of citizen science data.
2.2.8 Data Quality
One unique aspect of citizen science contributed data is data quality and the con-nected question of reliability. Therefore, in addition to standard data validation tech-niques, citizen science projects might also put additional effort in cross-validation data by comparing collected data to other sources such as remote sensing data [24]. Double bookkeeping approaches such as asking for pen and paper documentation of measurements in addition to mobile app based reporting could be used. Comparison to other data reveals outliers and establishes a general level of trust. Double book-keeping allows for the identification of discrepancies in reporting, and hence the potential measurement of data issues. In addition, double bookkeeping is a fallback in case of malfunctions of mobile apps and data transmission and includes people without, or incompatible, smartphones.
23 ico.org.uk/media/for-organisations/documents/1584/pn collecting information small business
2.2.9 Data Policy Transparency
Essential project information, such as how data is shared, should be made available to participants in a way that is completely transparent, but also removes friction in the user experience. For example, the Loss of the Night app24(Appendix C), had a participant contact the team asking for their data to be deleted, because this detail was buried in a ”Terms and Conditions” page. This can be addressed by allowing participants to dive straight into the first project task, such as taking a photo, and providing the relevant data policy as part of the next step - such as a ’Submit Photo’ button with an explanation that the photograph will be made public. This has the additional benefit of lowering barriers to participation, by facilitating the citizen scientist to get on with a project task.
2.3 Participant Centered Design and Agile Development
The central aim of citizen science is to involve the general public in scientific re-search, therefore projects are usually designed to involve as broad a range of partic-ipants as possible [25, 26, 5]. This can increase complexity in terms of the range of participants’ interests, abilities and motivation [27, 28, 32, 3, 29].
Participant centered design (or user-centred design in the context of mobile apps development in general) helps reach and involve participants [30] by involving them throughout the entire process, from concept to design to iterative usertesting -to shared outcomes. The early involvement of participants helps unearth issues such as ergonomic factors and how to support the learning curve before final user testing takes place. It also allows the project to be structured for mutual benefit, for both the researchers and the participants’, as well as ensuring a good user experience.
The development process of the app Naturblick25 (Appendix C) is a good ex-ample of how to conduct participant centered design in citizen science. Potential participants were involved from the beginning by asking them about their interests and ideas which fed into the conceptual process. During the development, iterative user-testing was conducted. The methods for the user-testing were adapted to the state of the development process, and ranged from focus groups to monitored test-ing situations with follow-up interviews. The issues and ideas were fed into the agile (i.e. iterative and incremental) development process, and resulted in prototypes for further testing and discussion. This process continued after releasing the app, which is crucial to the agile development process.
24verlustdernacht.de
user’s perspective. In mobile applications and web platforms developed for environ-mental and biodiversity citizen science, the user interface and the user experience are important factors to keep participants engaged and motivated [31, 32].
User interface design refers to what is displayed on the mobile phone screen or website, with considerations such as choosing a clear typeface, a well-contrasted and visible colour palette, effective use of images and the placement of buttons, links or arrows.
User experience design refers to how the steps to be taken are placed in a logical flow, such that the project participants are eased through each step. Design elements need to be both effective and efficient, influencing how the participants perform certain interactions, and guiding them through the steps to be taken.
2.4.1 Mobile Applications and Websites
It is typical for mobile phone based citizen science projects to provide both a web-site and a smartphone application (the app) as illustrated in Figure 2. Modern smart-phones are a powerful tool for data-collection in the field, enabling citizen scientists to take measurements, document and photograph their observations, record geo-location data, and easily upload these data to a shared repository.
Crowdsourced contributions via website interfaces include entering and up-loading observation data that were recorded on the mobile phone, processing and analysing data, and transcribing existing data into a digital format. Mobile and web interfaces have to be designed in a way that simplifie data gathering, encourages par-ticipation by as wide a range of people as possible, and ideally increases scientific understanding as well.
To ensure that the interfaces are accessible to the widest possible audience, it is important to use open web standards such as the HTML5 markup language, which is ideal for cross-platform mobile applications, and to ensure that the interface and API are RESTful - i.e.based on representational state transfer (REST) technology, an architectural style and approach to communications used in web services that ensures operability, robustness, and scalability [33].
Fig. 2.2 Examples of a mobile citizen science app (left), and a web page in-tegrating gathered observations from this app and two others (right). Source: digitalearthlab.jrc.ec.europa.eu/app/invasive-alien-species-europe.
2.4.2 UI/UX Best Practice in the Software Development and
Design Literature
A brief internet search using the software development industry’s shorthand of UI/UX (i.e. user interface and user experience) displays digital magazines show-casing new design trends and design patterns (e.g. Hongkiat.com, and theUXRe-view.co.uk), digital magazines showcasing new design element trends and winning designs (e.g. SmashingMagazine.com and UXmag.com), and indispensable tech-know-how reference books such as Effective UI: The Art of Building Great User Experience in Software[34] and Mobile First [35].
The mobile operating system providers also create highly useful guides for devel-oping native applications for their platforms, such as the Think with Google’ series on Principles of Mobile App Design26 and the Android developer centre Design Guides27.
The primary general principle touted by most practitioners of UI/UX design is to strip the design back to the most simple functionality possible. The concept of ’Minimum Viable Product’ from Lean Startup thinking refers to ”the version of a new product which allows a team to collect the maximum amount of validated learn-ing about customers with the least effort” [36], and the ’Simplicity Principle’ from design thinking which states that: ”the design should make simple, common tasks easy, communicating clearly and simply in the user’s own language, and providing good shortcuts that are meaningfully related to longer procedures” [37].
Using existing UX patterns, such as the ’hamburger’ three stripes icon that in-dicates a menu that can be opened up for further navigation, will help project
par-26
thinkwithgoogle.com/marketing-resources/experience-design/principles-of-mobile-app-design-introduction/
accessibility into account by following the Web Content Accessibility Guidelines (WCAG)28.
The key recommendation here is that sufficient time be spent perusing these use-ful guides to best practice in UI/UX design before embarking on the design and implementation phase of any application.
2.4.3 UI/UX Considerations Specific to Citizen Science Projects
Citizen science projects that propose to reach out to audiences with low science capital [39, 40], should conduct user-profiling to understand who is likely to use the mobile application, and in what context. For example, if the goal of the project is to reach out to school-aged children, use of language should be kept simple, and images could be used to illustrate next steps. The UCL ExCiteS group has developed the Sapelli platform29for mobile data collection and data sharing in Citizen Science projects where the participating group are non-literate or illiterate, with little or no prior information and communications technology (ICT) experience.
Usability testing and contextual research are essential practice in this regard, allowing the project initiators to observe real users interacting with the mobile ap-plication to catch potential design improvements. An excellent case study of user testing amongst both citizen science practitioners and participants for the Creek Watch monitoring app is contained in Kim et al. [43].
Several participants (ten environmental scientists in the City of San Jose Environmental Services Water Resources Department in a field deployment study) requested a comment field to write a description of what they were seeing. This request is particularly interesting, because none of these participants could think of a way that, as data consumers, they would have a use for this data. They simply wanted to be able to add a little more data. The disparity between their desires as data collectors and as data consumers reinforces the value in studying both aspects of a citizen science application.
Even more importantly, testing in the field will help to uncover any ’structural’ issues such as visibility of the screen in poorly lit areas, taking a photo one-handed if an object must be held simultaneously, or the importance of building data stor-age into your app for when the participant might be out of reception range - al-lowing for the uploading of the data when an internet or data connection has been re-established.
28w3.org/WAI/intro/wcag 29sapelli.org
Further insights into the UI/UX particularities can be found in the literature with respect to designing virtual citizen science projects [32, 41], how technology is be-ing applied in interestbe-ing new ways [2], case studies reportbe-ing on mobile application based projects [42, 43, 44], and best practice from the field of Human Computer In-teraction (HCI) as applied to biodiversity citizen science [30].
2.5 Motivational Factors for Participation
There is a great deal in the citizen science literature about the motivations to par-ticipate in projects, how to attract participants based on those motivations, and how to maintain their involvement over the longer term [45, 46]. Because participants in citizen science are donating their time and effort freely, project initiators also have a moral obligation and duty to care for their volunteers, and to ensure that the project ’gives back’ in keeping with those motivations. A good participant-centred design process will bring the relevant motivations of any given project to the foreground, which are likely to fall into one or more of the following motivational categories: 1. Learning about science [47, 46].
2. Making a contribution to science / collective motivations that are associated with the overall goal of the movement, including a sense of altruism [48, 47, 50]. 3. Social proof of seeing that an action is valued and that others have engaged in that
action / social motivations that reflect the importance of recognition by others / recognition and attribution [47, 50, 46].
4. Reward-based motivations [50].
5. Intrinsic motivations, where a participant contributes because of personal interest and enjoyment [51].
Both the project ow of tasks and the underlying mobile app need to be designed to take these motivational factors into account, including specific features to support them. This will enhance engagement at the recruitment phase, as well as over the entire length of the project [49].
2.5.1 Learning about Science - Supporting Shared Learning
In citizen science projects where the participant is acting independently (such as online, or with a mobile app outside the context of an organiser-led field project) learning takes place at every step, from the initial engagement with an app or plat-form, to actually doing the task, and beyond. Learning and communication are re-ciprocal (what is called two-way interaction, as is common in Bioblitz events - see [52]) and occur in tangible, as well as in intangible ways. Kloetzer et al. [53] de-scribed various forms of learning and found that most learning occurs in an informal
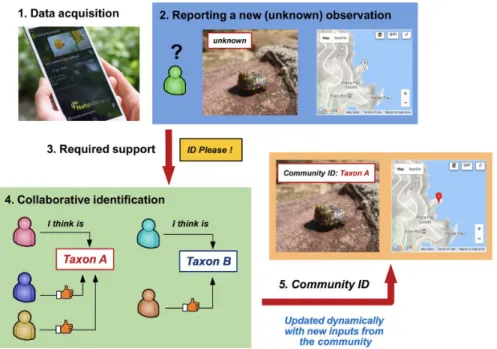
Fig. 2.3 Schematics of how the community may help in identifying observations that the partici-pants are not able to identify by themselves (the process can also be used also to validate or correct proposed identifications).
The mobile application itself will have limited means to support learning about the object of observation or measurement in the field. However, the project website can fill this gap, with ongoing news updates from the project organisers, shared learning from the researchers, and signposting further information for reading and deeper understanding of the science.
2.5.2 Making a Contribution to Science - Designing for Two-way
Communication
News sharing channels by researchers are an important way to feel part of a bigger endeavour, but a real sense of contributing to science can only be achieved by two directions of communication - between practitioners and participants, and among participants themselves. Any citizen science project should plan for and provide two-way communication. As Jennet et al. [54] stated ”It is important to provide users with tools to communicate in order to supporting social learning, community building and sharing.”
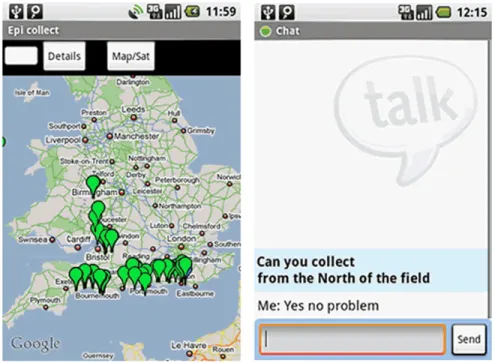
Mobile applications provide a unique opportunity to embed these communica-tions channels within the app itself, such as sending feedback to the researchers via a built-in text messaging function, or sharing notes and observations with the community via a comments function. For example, the EpiCollect31app (Figure 4) for collecting field data via bespoke forms, has embedded the Google Talk instant messenger into the app for instant field communications with the ’curator’ of the project. This requires the participant to have a Gmail account, which then automat-ically stores transcripts for future reference [55].
Fig. 2.4 Embedded Google Talk function in EpiCollect mobile app for field data collection. (Source: journals.plos.org/plosone/article/figure?id=10. 1371/journal.pone.0006968.g003).
Both require visibility of the community, and for the activities of the community to be evident. Koh et al. [56] have identified offline and online interaction as key drivers for community building and collaboration:
”Leaders of robust, sustainable virtual communities find ways to strengthen their members’ sense of social identity and motivate their participation in the community’s activities. Un-derstanding virtual community development provides a foundation for facilitating collab-oration and learning among individuals separated by physical distance and organisational boundaries.”
Social presence in physically dispersed communities can be aided by communi-cation tools such as live text, chat and video interfaces, and also by opportunities to form stronger social bonds in person, at events or group field excursions. Kim [57] suggests four factors for building sustainable communities: clear purpose or vi-sion, clear definition of members’ roles, leadership by community moderators, and online/offline events.
Online discussion forums are a simple but effective means of achieving this, as well as community-oriented social media channels such as Facebook Groups. When implementing such community building tools, it is vital that a communication plan with resourcing also be in place, so that participants frequently hear back from the project initiators and researchers.
2.5.4 Reward-based Motivations - Sustaining Long-term
Engagement
The motives of volunteers may be different when participating in open-ended citizen science projects, and can also change over of time. Long-term projects that incor-porate little or no user-rewards are likely to hit a plateau in the number of users and encounter challenges in recruiting them [58].
A range of different reward systems may be considered in these cases, which focus on maximizing both the quality and quantity of the data collected, as well as on retention of volunteers. Within citizen science projects, these can be divided into two main types: symbolic and non-symbolic [59, 2], examples of which are shown in Appendix D.
An example of different reward systems implemented in two recent campaigns run by the Geo-Wiki32 team [60, 61] is Picture Pile. It is a cross-platform applica-tion that is designed as a generic and flexible tool for ingesting satellite imagery for 32geo-wiki.org
rapid classification. The application involves simple micro-tasks, where the user is presented with satellite images and is asked a straight-forward yes/no question. Us-ing this app, campaigns have been run with both symbolic rewards and no rewards: • Non-symbolic rewards: In one campaign, volunteers were asked to identify the presence or absence of cropland from very high resolution satellite images and geotagged photographs. Each week, the top three players with the highest score were added to a list of weekly winners. The campaign ran for around 6 months, after which three people from the list of weekly winners were randomly drawn to win prizes, which included an e-reader, a smartphone and a tablet.
• Symbolic rewards or no rewards: In a second campaign, volunteers were asked to look at pairs of very high resolution satellite images before and after Hurri-cane Matthew hit Haiti to identify the presence of any visible building damage. There were no rewards although personal performance ratings and ratings on a leaderboard were provided to incentivize participation.
Both campaigns were successful in terms of the data collected, despite the differ-ent reward systems used. The difference was in the type of task undertaken by the volunteers, which attracted individuals with different underlying motivations.
2.6 Discussion and Conclusions
Apps and platforms used through mobile devices enable citizens to provide timely geospatial information that contributes to scientific understanding and decision-making for environmental and biodiversity citizen science. In this chapter, we en-courage initiators of new mobile-based citizen science projects to 1) follow existing data and web standards where possible, 2) collaborate and consult with the target audience of participants early and often, 3) not reinvent the wheel, 4) build on ex-isting UI/UX expertise regarding the development of mobile applications , and 5) factor in motivational considerations throughout.
Using accepted and well-established open standards helps to ensure reliability and interoperability with other tools. The number and range of standards is indeed vast, as only partially illustrated by Appendix A, yet knowing this will provide a solid base for taking an informed decision within each specific project.
Useful guidelines, best practices and other training material to assist in the choice of standards are being worked on in the form of publications [22, 62, 23], in the context of the CSA International Working Group on Data and Metadata33, or OGC’s Citizen Science Domain Working Group34.
Before embarking on the process of building an app and its associated website, effort needs to be made to not reinvent the wheel by looking for open source code repositories and the re-usable elements of other projects. The early years of citizen 33citizenscience.org/2015/11/12/introducing-the-data-and-metadata-working-group
test results’ user experiences). A discussion of how it can sometimes be more time consuming to re-use a ready-to-use tool than to build a new one can be found in the Schade et al. [19] assessment of invasive alien species apps and their potential for reuse. The need for a ’neutral’ cross-topic inventory to aid the discovery and reuse of existing apps is clear. This is also exemplified in Appendix E, which provides a snapshot of the large number of noise pollution apps that have been re-created each time from scratch.
Of even more importance than the ease of re-using existing apps, source code, platforms and standards, is the fact that this can significantly lower the investment cost in terms of money, effort and expertise. It takes a professional software devel-opment approach to develop sufficiently mature applications, which is often neither in the scope of scientific projects, nor accounted for in the budget planning.
There are naturally tensions between different points of view, even inside the community of citizen science practitioners, with some advocating for a smaller number of platforms and systems in the name of efficiency and economies of scale; whereas others point out the need for innovation and new approaches. In this chapter we hope to have highlighted the wide range of choice available to project designers to meet the unique needs of their project and local context.
In conclusion, we highlight the general principles of citizen science, as they are expressed in the ECSA Ten Principles of Citizen Science35as a guiding force to-wards best practice when designers and developers are embarking on a new citizen science project. Undoubtedly, technology is only part of the story. New technologies open up many new possibilities, including the capacity to scale globally, yet a local focus and community-mindedness will always be needed.
References
1. Jennett, C, Furniss, D J, Iacovides, I, Wiseman, S, Gould, S J J and Cox, A L Exploring Citizen Psych-Science and the Motivations of Errordiary Volunteers, Human Computation 1 (2), 200218. (2014)
2. Newman G, Wiggins A, Crall A, Graham E, Newman S and Crowston K, The future of citizen science: Emerging technologies and shifting paradigms, Frontiers in Ecology and the Environment 10(6): 298304, (2012) https://doi.org/10.1890/110294
3. Raddick MJ, Bracey G, Gay PL, Lintott CJ, Cardamone C, Murray P, Galaxy Zoo: Motiva-tions of citizen scientists, Astronomy Education Review, 12(1) (2013)

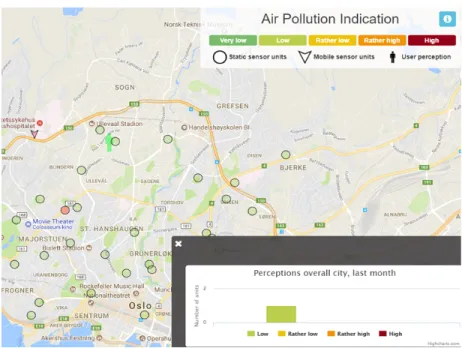
![Fig. 3.10 Data fusion example with real-world observations in Oslo on 6 January 2016 at 09:00 UTC [18].](https://thumb-eu.123doks.com/thumbv2/123doknet/13468230.412281/60.918.214.688.136.434/fig-data-fusion-example-world-observations-oslo-january.webp)