HAL Id: halshs-01342391
https://halshs.archives-ouvertes.fr/halshs-01342391
Submitted on 5 Jul 2016HAL is a multi-disciplinary open access archive for the deposit and dissemination of sci-entific research documents, whether they are pub-lished or not. The documents may come from teaching and research institutions in France or
L’archive ouverte pluridisciplinaire HAL, est destinée au dépôt et à la diffusion de documents scientifiques de niveau recherche, publiés ou non, émanant des établissements d’enseignement et de recherche français ou étrangers, des laboratoires
Indian and Chinese multinational companies
Wladimir Andreff
To cite this version:
Wladimir Andreff. Outward Foreign Direct Investment from BRIC countries: Comparing strategies of Brazilian, Russian, Indian and Chinese multinational companies. The European Journal of Com-parative Economics, European Association for ComCom-parative Economic Studies and Universita Carlo Cattaneo, 2016, 12 (2), pp.79-131. �halshs-01342391�
Outward Foreign Direct Investment from BRIC
countries:
Comparing strategies of Brazilian, Russian, Indian
and Chinese multinational companies
Wladimir Andreff1
Abstract
An overall comparative study of outward foreign direct investment (OFDI) from BRIC countries and strategies conducted by multinational companies (MNCs) based in the BRICs is elaborated on with a same methodology for Brazil, Russia, India and China. The comparison pertains to the historical emergence of firms’ internationalisation, their booming expansion in the 2000s then their muddling through the current crisis, the specificities of OFDI from each home country, OFDI geographical distribution and industrial structure, econometric testing of the respective determinants of Brazilian, Russian, Indian and Chinese OFDI, and the role of home countries’ governments vis-à-vis home-based MNCs. Beyond some common characteristics, BRICs’ MNCs exhibit a number of major country-specific features.
JEL: F21, F23, O57, P52
Keywords: foreign direct investment, multinational companies, emerging countries, BRICs, comparative economic studies
Outward foreign direct investment (OFDI) from post-communist and fast-growing developing (emerging) countries started to increasingly draw attention in the early 2000s2. Since then, analysing foreign investment strategies of multinational
companies (MNCs) whose parent headquarters are based in each BRIC country has actually become a fashioned avenue for research. The literature based on country case studies has been growing at a skyrocketing pace during the past decade, though overall comparative studies are still in the cradle; practically no one comparison samples all the four countries together3. Using a same methodology for comparing Brazilian and Indian
MNCs (Andreff, 2014) then Russian and Chinese MNCs (Andreff, 2015) has facilitated an overall and systematic comparison of OFDI from all four BRICs presented below. Such comparison is of interest since Russia and China are transition countries while, at about the same time, India and Brazil have liberalised their economies without a post-communist systemic change.
Any deep comparison between the four BRICs’ economies will find out so many disparities, sometimes more than similarities that the country grouping coined BRIC
1 Wladimir Andreff, Professor Emeritus at the University Paris 1 Panthéon Sorbonne, Honorary Member of the European Association for Comparative Economic Studies, Honorary President of the International Association of Sports Economists and the European Sports Economics Association, former President of the French Economic Association.
2 Among pioneering references: Andreff (2002 & 2003a), Chudnovsky and Lopez (2000), and Yeung (1999).
3 The comparison here is somewhat more extensive than those available in Duanmu and Guney (2009), Goldstein and Pusterla (2010), Milelli, Hay and Shi (2010), Pradhan (2011), Zhao (2011), De Beule and Van den Bulcke (2012), Kothari, Kotabe and Murphy (2013). Holtbrügge and Kreppel (2012) indeed cover all the four BRICs’ OFDI together though only with case studies of eight companies.
may appear heterogeneous enough to contest that gathering the four countries together is relevant. In the same vein, the present paper unveils a number of significant differences between OFDI strategies conducted by MNCs from different BRICs, beyond some marked similarities. A sensible expectation would be to consider that Russian and Chinese MNCs, since they are based in two post-communist economies in transition toward some kind of state capitalism, should be closer in terms of OFDI strategies while Brazilian and Indian MNCs operating from freer market economies should have together more similar features and strategies that would differentiate them from their Russian and Chinese competitors. The outcome of the comparison led in this article does not entirely confirm such expectation: BRICs’ MNCs similarities and differences do not draw a clear-cut dividing line between transitional MNCs and emerging MNCs that emanate from more liberalized, though not fully-fledged, market economies like Brazil and India.
OFDI is compared across the BRICs first in terms of historical emergence (Section 1), then as regard how it has boomed in the early 2000s and is muddling through the current financial crisis (Section 2). Specificities of their MNCs’ strategies are pointed out (Section 3), including their geographical (Section 4) and industrial distribution (Section 5), as well as the respective determinants of their OFDI as they show up from surveying a sample of econometric tests (Section 6). Finally, the role of home-country government vis-à-vis home-based MNCs is differentiated (Section 7). Conclusion grasps some main comparative results (Section 8).
1.
The emergence of multinational companies based in BRICs
Indian and Brazilian firms are known to have started up investing abroad earlier than Chinese and Russian MNCs. According to Lall (1983), the first OFDI from India occurred as early as 1962 with Jay Engineering Works setting an assembly line for sewing machines in Sri Lanka. Actually, the first one was the establishment of a textile mill in Ethiopia by Birla in 1955 (Saikia, 2012). Indian firms begun to significantly invest abroad in the 1960s, but India’s restrictive OFDI regime limited them to small joint ventures (JVs) in developing countries such as Kenya, Uganda, Nigeria, Malaysia Thailand and Sri Lanka. Liberalisation of OFDI policy pushed up Indian firms to invest abroad though under stringent conditions fixed by the state. A major objective of the new policy was to developing JVs rather than fully-owned subsidiaries. Indian OFDI was felt – by the government – as a tool for export promotion in the equipment goods industry. This drove market seeking OFDI primarily to neighbouring host countries, but also in the Middle-East and a few African countries, with a focus on countries having a significant number of people with Indian origins as local residents. Compared to other BRICs’ MNCs, the Indian ones have been benefiting from a first mover advantage4.
A classical presentation of India’s OFDI in historical perspective splits it into three phases (Hansen, 2010). The first phase (1970s-1980s) was mainly led by modest investments made in JVs in Asia and Africa and shaped by political and regulatory restrictive government policies. Some MNCs were partially or fully state-owned but
4 Major Indian MNCs in the 1980s were Birla, Thapar, Tata group, JK Group, Modi, Hindustan Machine Tools, Usha Martin Black, Kirloskar, Shahibag, Godrej, Larsen & Toubro, Sarabhai, Indian Tobacco,
most were held by Indian family capital though often in collaboration with public financial institutions. Second was a start-up phase (1990s-early 2000s) which was largely an outcome of more liberal government stance on FDI. Liberalisation of the Indian economy in the 1990s targeted inward and outward FDI since 1994. The number of Indian firms investing abroad grew up. The emergence of new Indian MNCs has been boosted by a preliminary substantial inward FDI of Western MNCs into India in tune with the so-called LLL - Linkage, Leverage, and Learning - approach (Matthews, 2002). Instilling spill-overs, incubators and learning by doing business with foreign investors in India have pushed the internationalisation of Indian firms. With the 1998-2002 downturn of the Indian economy, Indian firms internationalised their operations not only for survival but with specific strategies for sustained growth (Kant, 2008). The third was a take-off phase (after early 2000s) when Indian OFDI exhibited a totally different trend as compared to the previous two phases in terms of growth, industrial composition, and geographical orientation.
Brazilian companies started investing abroad in the 1970s. Domestic economic slowdown of the late 1970s and the 1980s’ crisis are main reasons mentioned by Brazilian entrepreneurs to explain this first wave of Brazilian OFDI; it played as a push factor for Brazilian firms to internationalise. Banks, engineering service firms and Petrobrás expanded their activities to bordering countries. Between 1975 and 1980, a dozen Brazilian MNCs had already emerged (Andreff, 1982). The Brazilian Central Bank data show that 54% of FDI outflows were concentrated in financial services in 1980. A strong presence of banking investments overseas was strategically targeted to support the expansion of Brazilian firms’ exports. Besides, first Brazilian MNCs were involved in industries such as oil exploration and production, construction and engineering, and a few manufacturing namely in the agro-food industry. Main destinations of Brazil’s OFDI were Latin America, Africa and the Middle East. Villela (1983) provides a list of the largest non-financial investors abroad in the 1980s5.
In the 1990s, large Brazilian companies have entered a new stage in their internationalisation process (Cyrino et al., 2010). OFDI flows soared as a consequence of deregulation, privatisation and trade liberalisation followed by new Brazil’s outward economic orientation. By the late 1990s, due to economic and institutional reforms, a growing internationalisation of Brazilian firms was registered; OFDI was triggered by a strategy of expanding business in foreign markets which has particularly developed after 2002, corresponding to a recovery of Brazilian economy from the 2001 crisis (Amal and Tomio, 2012).
Though lagging behind the emergence of Indian and Brazilian MNCs, Chinese MNCs held a first mover advantage compared to MNCs from all other transition economies, including those from Russia and Central Eastern European countries (CEECs). They have begun establishing subsidiaries abroad as early as 1979, primarily to open new export markets (Ye Gang, 1992). Since then they were ahead of Russian companies in investing abroad: OFDI from China in 1992 ($7,401 million) was of about the same magnitude as the one from Russia in 1998 ($7,385 million). Just like Indian MNCs, the growth of mainland China’s MNCs has been led by the LLL approach and
5 Such as Petrobràs (oil and gas), Copersucar (coffee), Mendes Junior (construction), Vale do Rio Doce (mining), Camargo Corrêa (engineering), Odebrecht (construction) and Brahma (beverages).
past technology transfers from foreign MNCs resulting in productivity spill-overs to domestic Chinese firms. In a future last phase, it is expected that China’s OFDI would channel comparable transfers and spill-overs from China to developing countries (Lian and Ma, 2011). This should make Chinese MNCs more acceptable in this sort of host countries.
Former USSR opened up to inward FDI comparatively later, in 1987, and the LLL process did not operate in the 1990s given the bad domestic investment climate in Russia (Andreff, 1999a). So-called Soviet “red multinationals” (Hamilton, 1986) vanished nearly overnight in the wake of the USSR’s break-up and subsequent transformational recession. OFDI stock from the USSR fell from $699 million in 1990 down close to nil in 1992 and 1993. Paradoxically, number of Russian firms spontaneously transformed into MNCs overnight simply because they were located in more than one former Soviet republic. Since these republics obtained the status of new independent states by end of 1991 or in 1992, a same company located in two or more former Soviet republics – it was often so under central planning - became all at once a so-called “born multinational” company (Liuhto, 2001).
From the mid-1990s on, the number of subsidiaries settled abroad by Russian firms started growing again, fuelled by a recovery in new FDI outflows from Russia (Andreff, 2002). However, if 1994 is the milestone for a new emergence of Russian MNCs, one has to wait until end of 1998 Russian financial crash consequences to witness a swift growth pace of Russian OFDI stock. Most of the biggest 100 Russian firms have gone multinational since 1999 or so. Russian MNCs benefited from global accelerated internationalisation in the early 2000s and from a catching-up surge of late-coming MNCs, previously lagging behind other BRICs’ MNCs in FDI business.
Let us end up with a paradox: Brazil and primarily India had benefited from a first mover advantage, compared to other BRICs, as regard investing abroad. However, at the end of the day, in 2009-2013, both countries are lagging behind China and Russia whose OFDI in fact benefited from a last mover fast growth since the 1990s – a sort of swift catching-up process.
During the lapse of time they took to emerge from the late 1970s up to the late 1990s, MNCs from transition and emerging economies, of which BRICs’ MNCs, exhibited major features which differentiated them from big MNCs based in developed countries, that is:
• They were not all or not primarily in private ownership; still a significant number of them were state-owned; they had not much ownership specific advantages over local companies.
• They had a modest size compared to Western and Japanese MNCs.
• The government often interfered heavily in their strategies, much more than it is used to do in developed countries.
• The great bulk of their OFDI was located in neighbouring countries or in the same geographical region as the home country.
• The number of countries hosting their foreign subsidiaries was comparatively low.
• Each of these BRICs’ MNCs had only settled a rather small number of subsidiaries abroad.
• They often had primarily invested abroad in the manufacturing industry while big MNCs from developed countries were already privileging the services industry for their OFDI.
• Their profitability was quite below those of big Western and Japanese MNCs.
However, some of these features were used as specific competitive advantages to challenge big MNCs from developed countries through market seeking OFDI. Only a few BRICs’ MNCs, if any, were investing abroad with an efficiency seeking objective – looking for lower unit labour cost abroad - since their domestic production costs were comparatively low. Econometric testing (Andreff, 2002 & 2003a) has verified that the investment development path – IDP – model (Dunning, 1981; Dunning and Narula, 1998) fitted with these early stages of emergence of MNCs from transition, emerging and developing economies. According to IDP model, in a first stage of its economic development, a country hosts very few FDI and does not invest at all abroad. In a second stage, it becomes attractive to inward FDI and achieves its very first OFDI, being a net FDI importer. In a third stage, due to its new technological competences and low unit labour cost, the country attracts very significant inward FDI and its MNCs start to substantially invest abroad even though the country still remains net FDI importer. In such analytical framework, emerging economies are supposed to definitely move from the second to the third stage and even to come close to a fourth stage. In the latter, a country is assumed to be a developed one and invest more outwards than it is invested by inward FDI; its FDI balance becomes positive. In a fifth and last stage, the now post-industrial country roughly reaches a balance between its inward and outward FDI.
2.
From the golden early 2000s to muddling through the crisis
Overall BRICs OFDI growth actually skyrocketed in 2000-2007 (Table 1). Brazil’s OFDI had a fast development momentum between 1997 and 2000 in the wake of privatisation and deregulation; it multiplied by 7 as against Russian OFDI multiplied by 3, Indian OFDI multiplied by 2 and Chinese OFDI6 increasing by 33% over 1997-2000.
Brazilian OFDI stock in 2000-2007 multiplied by 2.5 and grew exactly at the same pace as the world OFDI stock overall; consequently, its pace was passed over by OFDI stock from China (x 3.5), Russia (x 13) and India (x 16). Despite its impressive growth, Indian OFDI stock remained by far quite smaller than the Russian (8 times smaller), Brazilian (4 times) and Chinese (3 times) ones in 2007. On the brink of financial crisis, the major BRIC investing abroad was Russia whereas the laggard was India, with Brazil and China in between. Russian OFDI achieved a world record in terms of growth7 from 2000 to 2007, growing faster than OFDI from other BRICs.
6 All the comments refer to OFDI from mainland China, Hong Kong OFDI excluded.
7 Until 2007, Russian MNCs showed a double-digit growth and high profitability (Kalotay, 2008a).The dramatic growth of Russian OFDI may be somewhat overestimated due to data collection methodology; however the latter improved throughout the 2000s, namely with a better accounting for
Table 1 - Outward FDI stock from Brazil, Russia, India, and China ($million) BRICs: 1997 2000 2007 2008 2009 2010 2011 2012 2013 Brazil 7230 51946 129840 162218 157667 180949 202586 232848 293277 Russia 6410 20141 255211 202837 248894 433655 362101 413159 501202 India 846 1859 29412 61765 77207 92407 111257 118167 119838 China (mainland) 20416 27212 95799 147949 229600 297600 365981 509001 613585
China and Hong Kong 157928 411944 1122386 923869 1063689 1246094 1411901 1818850 1352353
Source: UNCTAD (2014) and previous issues.
Table 2 - Comparative features of OFDI from the BRICs (in %)
Outward FDI stock / GDP Outward / Inward FDI stock
BRICs: 1999 2007 2011 1999 2007 2011
Brazil 1.4 9.9 9.0 7.4 40.0 30.3
India 0* 2.6 6.0 6.5 38.6 55.2
Russia 2.3 19.8 19.5 51.9 75.4 79.2
China 2.5 3.0 5.0 8.4 29.3 51.4
China & Hong Kong 15.9 30.3 18.7 45.3 74.3 76.3
* Below 0.1%
Calculated from UNCTAD's World Investment Reports.
Looking at Table 2 with reference to Dunning’s IDP model, Brazil exhibits a quite lower OFDI/GDP ratio than Russia – twice lower from 1999 to 2011 – while it is much higher than in India and China which compare in this respect. If an OFDI/GDP ratio higher than 5% were assumed to be required for a country to be in the third step of IDP model (Andreff, 2003a), Brazil and Russia reached it in the early 2000s while India and China attained such step only by 2011. Outward to inward FDI stock ratio is the lowest in Brazil and India in 1999; this ratio multiplied by more than 5 in Brazil between 2000 and 2007 and was only outperformed by Russian OFDI at this date. Due to the crisis, of which Brazilian and Russian OFDI suffered more than their Indian and Chinese counterparts, in 2011 Brazil was lagging behind India and China as to outward/inward FDI stock ratio, and of course Russia. However, if a 25% ratio is hypothetically retained for qualifying the third step of IDP model all the BRICs stick to the criterion in 2007 as well as in 2011, with only Russia having met it before 1999.
The growth of global OFDI stock sharply slowed down during the financial crisis in 2008, 2010 and 2011, with uneven recoveries in 2009, 2012 and 2013. The financial crisis had a negative impact on OFDI from emerging markets as well. However, emerging market MNCs’ contribution to OFDI was more resilient to the crisis and less volatile than that of other MNCs. While the growth of overall world OFDI significantly and repeatedly fell on average one year out of two (Table 3), OFDI fluctuations were scattered among the BRICs during the crisis.
Table 3 – BRICs outward FDI stock during the global economic crisis: rate of growth
2007/ 2000 2008/ 2007 2009/ 2008 2010/ 2009 2011/ 2010 2012/ 2011 2013/ 2012 Brazil x 2.5 24.9% - 2.8% 14.8% 12.0% 14.9% 25.9% Russia x 13 - 20.5% 22.7% 74.2% - 16.5% 14.1% 21.3% India x 16 110% 25.0% 19.7% 20.4% 6.2% 1.4% China x 3.5 54.4% 55.2% 29.6% 23.0% 39.1% 20.5%
China & Hong Kong x 2.7 - 17.7% 15.1% 17.1% 13.3% 28.8% -25.6%
World OFDI x 2.5 3.9% 17.1% 7.5% 3.7% 11.3% 11.5%
Calculated from UNCTAD (2014) and previous issues.
Russian OFDI stock was by far the most unstable and the most affected by crisis suffering a 20% decrease in 2008, and again 17% down in 2011; but in between its recovery was the strongest in the world with the highest growth rate (74%) in 2010; the 2012-2013 recovery is milder. Russian OFDI was harshly affected by the crisis with a cut in its stock value (not only a fall in outflows), due to both divestments from abroad and foreign asset depreciation in 2008. Russian MNCs have been stifled by a lack of external finance. Russian OFDI stock grew again in 2010 fuelled by new investments abroad, foreign asset appreciation and likely capital flight. These figures exhibit that crisis entailed a much higher instability in Russian than other BRICs’ OFDI. The rouble depreciation since 2014 is bad news for further OFDI expansion.
Though fluctuating, Chinese OFDI stock kept on growing at between 21% and 55% a rate per year from 2008 to 2013: the most stable and the least affected by crisis. Chinese OFDI stock did better than other BRICs’ OFDI so that it slightly passed over the value of the Russian one since 2011. Its rate of growth remained significantly higher than in other BRICs just like the annual rate of Chinese domestic economic growth which did not fall below 7% so far – much higher than in other BRICs’ economies. Moreover Chinese OFDI has been facilitated by a strong domestic currency – all the more so with remminbi being often assessed as undervalued at official exchange rate.
Brazilian and Indian OFDI stocks stand in between. Brazilian OFDI stock is the most unstable after the Russian one, decreasing by 3% in 2009 then sticking to a 12% to 15% growth rate until 2012 and reaching 26% in 2013. The high growth rate of Brazilian OFDI stock in 2008 was mainly due to intra-company loans from parent companies to underperforming subsidiaries abroad as well as new acquisitions of mining
and natural-resource-based industries. In 2009, in response to worldwide crisis, FDI outflows from Brazil were negative, with Brazilian parent companies repatriating $10 billion from their foreign subsidiaries through intra-company transfers. The combination of Brazilian real depreciation and loss of market value of overseas equity did not result in more ventures abroad for Brazilian companies. The latter were strongly hit by tightened international credit conditions and uncertainty fueled by the crisis. Trans-border mergers and acquisitions (M&As) by Brazilian MNCs plummeted sharply in 2009. Since 2010, Brazilian OFDI stock located in Europe has considerably raised namely in Austria, through special purpose entities and takeovers of Austrian banks.
Indian OFDI rate of growth peaked up at 98% per year in 2004-2007. Indian OFDI stock was still one of the fastest growing in the world in 2008 but dropped off significantly in 2009 and since then its growth rate is on a decreasing slope down to 6% in 2012 and 1% in 2013. This growth rate declined, on average, less than in other BRICs but China. Indian MNCs had borrowed heavily in dollars to finance mega trans-border M&As. They were thus hit badly by the sharp rupee depreciation and tightened international credit conditions. Since 2008 continuously tumbling trans-border M&As by Indian MNCs were driving the decline in OFDI growth. After years of overseas expansion, Indian MNCs started consolidating their foreign operations and adjusting to the crisis. They suffered from a credit crunch and difficulties in raising financial resources. However, after Chinese MNCs, Indian ones are the least affected by crisis among the BRICs’ MNCs so far.
In terms of OFDI stock, India became the world’s 34th largest outward investor in 2007 whereas Brazil had reached the 19th rank the same year as against Russia the 12th, and mainland China the 23rd. In 2012, Brazil was the 18th most important source of OFDI worldwide and India the 23rd, as against Russia being the 15th and China the
12th. From 2007 to 2012, during the crisis, all the BRICs have climbed this ranking
based on UNCTAD data, except Russia.
3.
Specificities of multinational companies from Brazil, Russia, India and
China
3.1 Global players and small-medium sized firms: Brazilian multinationals
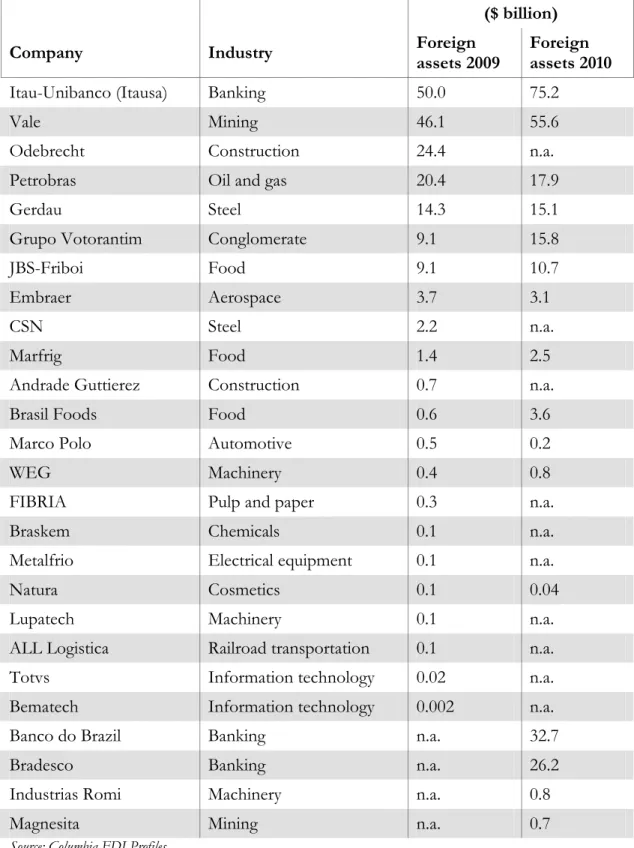
In 2006, 885 identified Brazilian MNCs had invested in 52 countries where they were employing 77,000 people; Gammeltoft (2008) even identified more than 1,000 Brazilian firms that had invested abroad in the late 1990s. The group of Brazilian firms with significant amounts of OFDI is around 100 of which about 50 global players (Carvalho et al., 2010). In 2013, seven Brazilian MNCs were listed among the Fortune 500 biggest companies in the world: Petrobras, Banco de Brasil, Bradesco, Vale, JBS, Itau, Ultrapar Holdings, and Brazilian Distribution. Major Brazilian companies investing abroad are listed in Table 4 but quite smaller or less known Brazilian firms invest abroad as well. Overall, Brazilian MNCs form a mixed sample of global players and small and medium-sized enterprises.
Table 4 - The biggest Brazilian multinationals, 2009-2010
($ billion)
Company Industry Foreign
assets 2009
Foreign assets 2010
Itau-Unibanco (Itausa) Banking 50.0 75.2
Vale Mining 46.1 55.6
Odebrecht Construction 24.4 n.a.
Petrobras Oil and gas 20.4 17.9
Gerdau Steel 14.3 15.1
Grupo Votorantim Conglomerate 9.1 15.8
JBS-Friboi Food 9.1 10.7
Embraer Aerospace 3.7 3.1
CSN Steel 2.2 n.a.
Marfrig Food 1.4 2.5
Andrade Guttierez Construction 0.7 n.a.
Brasil Foods Food 0.6 3.6
Marco Polo Automotive 0.5 0.2
WEG Machinery 0.4 0.8
FIBRIA Pulp and paper 0.3 n.a.
Braskem Chemicals 0.1 n.a.
Metalfrio Electrical equipment 0.1 n.a.
Natura Cosmetics 0.1 0.04
Lupatech Machinery 0.1 n.a.
ALL Logistica Railroad transportation 0.1 n.a.
Totvs Information technology 0.02 n.a.
Bematech Information technology 0.002 n.a.
Banco do Brazil Banking n.a. 32.7
Bradesco Banking n.a. 26.2
Industrias Romi Machinery n.a. 0.8
Magnesita Mining n.a. 0.7
Since the very beginning, Brazilian MNCs had adopted either an export-substitution or an export-complementing OFDI strategy that is a market seeking strategy in any case. The latter was fueled in the long run by trade liberalisation at home and abroad. Brazilian MNCs invest abroad by means of both greenfield investment and trans-border M&As. Overseas acquisitions have gained strength, due to the stabilisation of the Brazilian economy and a temporary appreciation of real against the US dollar. An appreciated currency has made M&As cheaper. Brazilian MNCs have taken this opportunity to expand their market and access natural resources that are not available in domestic market: this was the purpose for instance of Vale-Inco Steel, Votorantim-US Zinc, and Gerdau-Chaparral Steel acquisitions.
Table 5 – A Sample of significant trans-border mergers-acquisitions achieved by Brazilian companies, 2008-2010
Brazilian acquirer Acquired company Target country Industry acquired % Value $million
Vale BSRG Resources Guinea UK Ferroalloy ores 51 2500 Marfrig Keystone Foods USA Meat packing 100 1260 Votorantim Cimpor Cimentos Portugal Cement, hydraulic 17 982 DHC Outsourcing Diveo Braodband Networks USA Information retriev. 100 422 Votorantim Métais Cia Minera Milpo Peru Copper ores 15 419 Petrobras Pasadena Refining System USA Petroleum refining 50 350 Braskem Sunoco Chemicals USA Chemicals 100 350 Votorantim Cimpor Cimentos Portugal Cement, hydraulic 4 210 Petrobras Devon Energy CorpCascade USA Petroleum and gas 50 180 Camargo Correa Cimpor Cimentos Portugal Cement, hydraulic 3 180 Banco Itau
Holding Banco Itau Europa Portugal Security services 89 498 Petrobras Esso Chile Petrolera Chile Petroleum refining n.a. 400 Vale Cementos Argos Colombia Cement, hydraulic 100 373 Votorantim Cementos Avellaneda Argentina Cement 50 202 Banco Bradesco Banco Espirito Santo Portugal Banking 6 32 Suzano Holding MDS SGPS Portugal Insurance 50 71 Vale TEAL Explorat. & Mining Canada Copper ores 50 66 Marfrig Grupo Zenda Uruguay Leather products 51 49 Petrobras Chevron Chile Chile Petroleum and coal 100 12 JBS-Friboi Pilgrim's Pride USA Food 64 3 Gerdau Quanex Corp USA Steel 100 1749 Magnesita LWB Refractories Germany Brick and clay tile 100 944 JBS-Friboi Smithfield Beef Group USA Beef cattle 100 565 JBS-Friboi Inalca Italy Meat products 50 425 Votorantim Métais US Zinc Corp USA Nonferrous metals 100 295 Gerdau Corporacion Sidenor Spain Steel 20 287 AmBev Quilmes Industrial Argentina Malt beverages 6 252 JBS-Friboi Tasman Group Services Australia Meat packing 100 150 Gerdau Corsa Controladora Mexico Steel 49 101
From Table 5 one can infer that trans-border M&As by Brazilian MNCs target foreign companies geared towards consumer markets (food, services, banking), which confirms market-oriented OFDI. Then come M&As for acceding natural resources (petroleum, gas, various ores), and just one trans-border M&A is asset seeking in information retrieval; this highlights a resource seeking OFDI strategy. Thus, predominantly Brazilian MNCs’ strategy is market seeking, to some extent resource seeking and to a much lesser degree, and only recently, technological asset seeking, less than 10% of declared OFDI motives. There is no sign of an efficiency seeking strategy with relocating production units in low unit labour cost countries. Despite the rise of some big investors, mostly in the extractive sector, Brazilian MNCs have not yet developed a global strategy8, much less than other BRICs’ MNCs.
Searching technological assets that firms do not avail in their domestic market is an important driver of OFDI in general, and has become a central motivation for emerging market firms to internationalise (Dunning et al., 2008; Dunning and Lundan, 2008). But in Brazil, technology seeking OFDI responds of only 7.2 percent of sampled MNCs (Carvalho, 2009). The recent increase in trans-border M&As might be a signal that Brazilian MNCs are seeking now to augment their strategic position through investment in technological assets. Tolentino (2000) contends that Brazilian MNCs had the disadvantage of not having global brands (in some cases not even strong national brands) and, most important, had neither attained worldwide technological leadership nor developed significant technological advantage to compete abroad. However, some Brazilian MNCs have significantly invested in R&D expenditures abroad, but not yet in very high tech industries like MNCs from developed countries and some Indian or Chinese MNCs. Galina and Moura (2013) found that Brazilian MNCs basically internationalise Product Development (not the whole R&D process) while Research properly speaking remains at the headquarters in Brazil. Adaptation of products to local markets is often observed as a factor that led to internationalise R&D.
Partnership with local suppliers was used for product or technology development. Maehler et al. (2011) have shown that in four Brazilian subsidiaries located in Portugal, in different industries, frequent innovations take place which are typically incremental in nature and occur in strong interaction with local markets, especially with customers contributing with suggestions and influence on the new products’ creation in the subsidiaries. At odds with Russian and Chinese MNCs strategy of tapping technological assets abroad, Fleury et al. (2013) contend that Brazilian MNCs derive innovative capabilities from core competences and competence formation at firm level which are influenced by the national environment. Thus Brazilian MNCs which do not exhibit the expected strength in R&D are able to combine their organisational competences and manage to develop innovative capabilities as a springboard for their internationalisation.
8 As defined in Andreff (2003b).
3.2 Conglomerates and family groups: Indian multinationals
In 2007, the number of Indian MNCs stood at 3,149 operating across 122 countries, but many had a relatively small size. In 2008, seven Indian firms were listed in the Fortune 500 biggest companies of the world: Indian Oil, Reliance Industries, Bharat Petroleum, Hindustan Petroleum, Tata Steel, Oil and Natural Gas Corporation and State Bank of India. In 2013, they were eight, the same plus Tata Motors. Some of these biggest Indian firms did not show up among the biggest Indian MNCs in 2006 (Table 6).
Early Indian OFDI was market seeking and concentrated in developing countries where there was little technological competition. Indian MNCs invested abroad largely to circumvent a stagnant domestic market and policy restrictions on large firms’ growth stemming from the Monopolies and Trade Restrictive Practices Act, the Foreign Exchange Regulation Act, and licensing regulation and reservation policies for public-owned and small scale sector (Pradhan, 2008). Indian firms investing abroad before the 1990s were mostly conglomerates (Lall, 1982) competing into those industries that required simple technology, low product differentiation and labour intensive techniques in developing countries. After a first liberalisation phase, continual industrialisation in the domestic market, experience attained from home and abroad, financial relaxation and local government supports paved the way for Indian MNCs to invest more globally, including increasingly into developed countries since the 1990s (Arockia Baskaran and Chaarlas, 2012). A number of Indian MNCs attempted globalising their businesses and revenue sources as a means for reducing dependence on the Indian market and domestic business cycle.
Table 6 - The biggest Indian multinationals, 2006
($ million)
Company Industry Foreign assets
Oil and Natural Gas Corporation (ONGC) Oil and gas 4700
Tata Group Conglomerate 4200
Videocon Industries Conglomerate 1600
Ranbaxy Laboratories Pharmaceuticals 1000
Dr. Reddy’s Laboratories Pharmaceuticals 870
HCL Technologies IT services 780
Hindalco Industries Aluminum manufacturing 580
Sun Pharmaceuticals Pharmaceuticals 280
Reliance Industries Oil and gas 250
Suzlon Energy Power and energy 140
Larsen and Toubro Engineering, construction 130
WIPRO Technologies IT services 130
Bharat Forge Auto component forging 110
Patni Computer Systems IT services 81
Hexaware Technologies IT services 70
Biocon Limited Pharmaceuticals 50
i-Gate Global Solutions IT services 49
Max India Limited Conglomerate 37
Mahindra & Mahindra Automotive 35
NIIT Limited IT services 31
Piramal Healthcare Limited Pharmaceuticals 26
Birlasoft (India) Limited IT services 21
Raymond Limited Fabric manufacturing 18
Infosys Technologies Limited IT services 9
Source: Satyanand & Raghavendran (2010).
Then, Indian OFDI became more high-tech and trade supporting, as Indian IT firms begun to win large global contracts and relocated in developed countries to be close to key clients. Indian pharmaceutical firms followed such route to break into Western generic markets. India’s pharmaceutical companies looked for new unregulated markets for their generic drugs while seeking to acquire facilities that have regulatory clearance in regulated markets such as the USA and Western Europe. The conglomerate structure of some well-known Indian MNCs is considered as a key factor of their success (Ruet, 2010). It helped them catching up as regard production process-efficiency and technology while raising their borrowing capacity in international markets. Those non-conglomerate Indian firms that became MNCs often used foreign networks, namely parental networks (Elango and Pattnaik, 2007) of big families like the Kalyani’s (Bharat Forge), the Mahindra brothers, Dilip Shanghvi (Sun Pharmaceuticals), or Nicholas Piramal.
Some Indian MNCs have persistently pursued natural resources. Resource seeking OFDI aims at ensuring a stable and secure supply of resources to fuel the country’s energy-intensive growth. There has recently been a surge in resource seeking OFDI by Indian MNCs, especially to acquire energy resources in Australia, Indonesia and Africa. Indian OFDI to the US and Western Europe has taken off since 2000. The major driver of this takeoff is to get an access to better R&D, skill infrastructure, and strategic assets. This (technological) asset seeking strategy reflects an aspiration by Indian MNCs to buy technology, processes, and management know-how. Finally, as trade barriers declined, some Indian MNCs undertook industrial restructuring with creating regional production networks, which looks like an efficiency seeking strategy though it is not heavily based on a search for lower unit labour cost9. Indian IT companies have established major
global sourcing bases in China. Similarly, Tata Motors’ acquisition of Daewoo Heavy Vehicles of South Korea in 2005 has led to a regional production networking strategy whereby small and medium-sized vehicles are manufactured in Indian plants and sold through Daewoo outlets and brands while, simultaneously, heavy trucks built at the Daewoo plant are sold by Tata outlets in India and other countries under Tata brand name.
Though relatively small in a global context, Indian MNCs are noticeable for their buy-outs of foreign enterprises far larger than themselves. Indian MNCs started being seriously involved into overseas M&As in the 2000s (Table 7). They have systematically acquired leading firms in developed countries to boost domain expertise, technological competitiveness, market size, and brand recognition. In some cases, these acquisitions were specifically undertaken to attain global size and status, and to build new competitive advantages by combining the best international technology with low-cost Indian labour (Andreff and Balcet, 2013). Severe domestic competition triggered increasingly larger strategic asset-seeking trans-border M&As in the automotive industry, auto-components, electronics, electrical machinery and the metals sector, including the acquisition of established and prestigious brands, for example, Tata Motors’ purchase of Jaguar and Ford assets. While the largest overseas M&As were smaller than $500 million in the early 2000s, they became bigger than $10 billion after the mid-2000s with the record takeover of Arcelor by Mittal ($47 billion). Many Indian firms also used M&As to bring home new products and services and build competitive strength in India. Improving competitiveness also explains the dominance of natural resource seeking investments in India’s recent trans-border M&As.
A survey of Indian MNCs revealed that market access was the most significant motive of their OFDI for 51% of the respondents, followed by efficiency seeking (22%), resource seeking (13%) and created-asset seeking (14%) (Nayyar, 2008).
Table 7 – A sample of significant trans-border mergers-acquisitions achieved by Indian companies, 2006-2010
Indian Acquired Target Acquired Value
acquirer company country Industry % $million
Mittal Steel Arcelor Luxembourg Metals & mining 100 47440
Tata Steel Corus Group U. K. Metals & mining 100 14850
Bharti Airtel Zain Africa* Telecom 100 9000
Hindalco Industries Novelis Canada Metals & mining 100 6000
ONGC Imperial Energy U. K. Energy & power 100 2800
Sterlite Industries India Asarco United States Mining n.a. 2600
Tata Motors Jaguar & Land Rover U. K. Automotive 100 2300
Suzlon Energy Repower Systems Germany energy & power 66 1700
Essar Global Algoma Steel Canada Metals & mining 100 1570
ONGC Petrobras Brazil Oil and gas n.a. 1400
Tata Power Kaltim Prima Coal Indonesia Metals & mining 30 1300
United Spirits Whyte and Mackay U. K. Food, beverage 100 1180
Tata Power PT Bumi Resources Thailand Energy & power n.a. 1100
GMR Infrastructure Intergen Netherlands Energy & power 50 1100
Tata Chemicals General ChemicalIndustrial United States Plastic,chemicals 100 1100
JSW Steel Jindal United Steel United States Metals & mining 90 900
HCL EAS Axon Group U. K. IT & ITES 100 800
Wipro Infocrossing United States IT & ITES 100 600
Rain Calcining CII Carbon United States Energy & power 100 600
DS Constructions Globeleq Bermuda Energy & power 100 600
Dr Reddy's Laboratories Betapharm Germany Parmaceuticals n.a. 582
Tata Tea Tetley Group U. K. Food, beverage n.a. 431
Videocon/Bharat Petro Encana Brasil Petroleo Brazil Energy & power 50 400
Ranbaxy Laboratories Trapia Romania Parmaceuticals n.a. 324
Firstsource Solutions MedAssist United States IT & ITES 100 300
RelianceCommunications Yipes Holding United States Telecom 100 300
Videocon Appliances Thomson Multimedia France IT & ITES n.a. 292
Wockhardt Negma Laboratories France Parmaceuticals 100 265
Jubilant Organosys Draxis Health Canada Pharmaceuticals n.a. 258
Kiri Dyes and Chemicals DyStar Group Germany Plastic,chemicals 100 200
Essar Group Warid Telecom Uganda/Congo Telecom 51 200
United Phosphorus Cerexagri France Chemicals n.a. 142
Subex Systems Azure Solutions U. K. Technology n.a. 140
Inox India Cryogenic VesselInitiatives United States Logistics 51 100
S. Kumar's Hartmarx United States Textiles,apparels 100 100
* In 17 African countries
Sources: UNCTAD, Hattari & Rajan (2010).
3.3 From opacity to globalisation: Russian multinationals
An unknown number – probably less than 1,000 Russian firms10 - have invested abroad. Despite their growing size, no one Russian MNC has entered yet the list of top 100 biggest non-financial MNCs ranked by UNCTAD according to the value of their foreign assets (Table 8). Russian MNCs were used to disclose very little information with regards to their economic activity abroad. This strategy of opacity, non-transparency and information concealment is a typical feature of Russian MNCs, even though it is stepping back now.
Table 8 – The biggest Russian multinationals, 2004-2009
Company, 2004* Foreign assets Company, 2007* Foreign assets Company 2009** Revenue Rank***
Lukoil 10579 Lukoil 20805 Gazprom 67806 12
Gazprom 2951 Gazprom 17236 Lukoil 49654 23
Sovcomflot 1762 Norilsk Nickel 12843 Rosneft 25325 57
Norilsk Nickel 1413 Evraz 6221 TNK-BP 24124 61
MTS 994 Severstal 5130 Gazpromneft 14758 106
Rusal 743 Sovcomflot 4874 Surgutneftegaz 13584 114
FESCO 675 Rusal 4533 Sistema 13015 118
Severstal 666 MTS (Sistema) 3812 Severstal 9529 164
PriSCO 657 Vimpelcom 3572 IDGC 9299 168
Vimpelcom 602 Novolipetsk Steel 1594 Tatneft 8629 177
TNK-BP 438 PriSCO 1208 Norilsk Nickel 7302 197
OMZ 347 TNK-BP 1150 MTS 7064 203
InterRAO 261 FESCO 1055 Evraz 6783 210
Acron 119 OAO Koks 978 Transneft 6478 224
RitzioEntertainment 47 Eurochem 901 X 5 Retail 6363 227
Alrosa 31 InterRAO 799 Vimpelcom 6353 228
Sitronics 31 TMK 606 Rusal 5871 245
Evraz 0 Mirax 470 AvtoVAZ 4525 284
Novolipetsk Steel 0 GAZ 384 Novolipetsk Steel 4482 288
IMH/OAO Koks 0 ChTPZ 262 Mechel 4138 306
Eurochem 0 Acron 261 GAZ Avto 4015 312
TMK 0 Alrosa 231 Magnit 3908 317
Mirax 0 Sitronics (Sistema) 226 Magnitogorsk Steel 3709 327
ChTPZ 0 OMZ 207 Bashneft 2872 394
GAZ .. RitzioEntertainment 200 Aeroflot 2718 416
Rushydro 2621 431
Mosenergo 2590 441
Salavatnefteorgsintez 2471 457
Slavneft 2460 461
Sources: * Skolkovo (2008) in million $. ** Handelsblatt Research 2010: in million €. *** rank among the biggest 500 European companies.
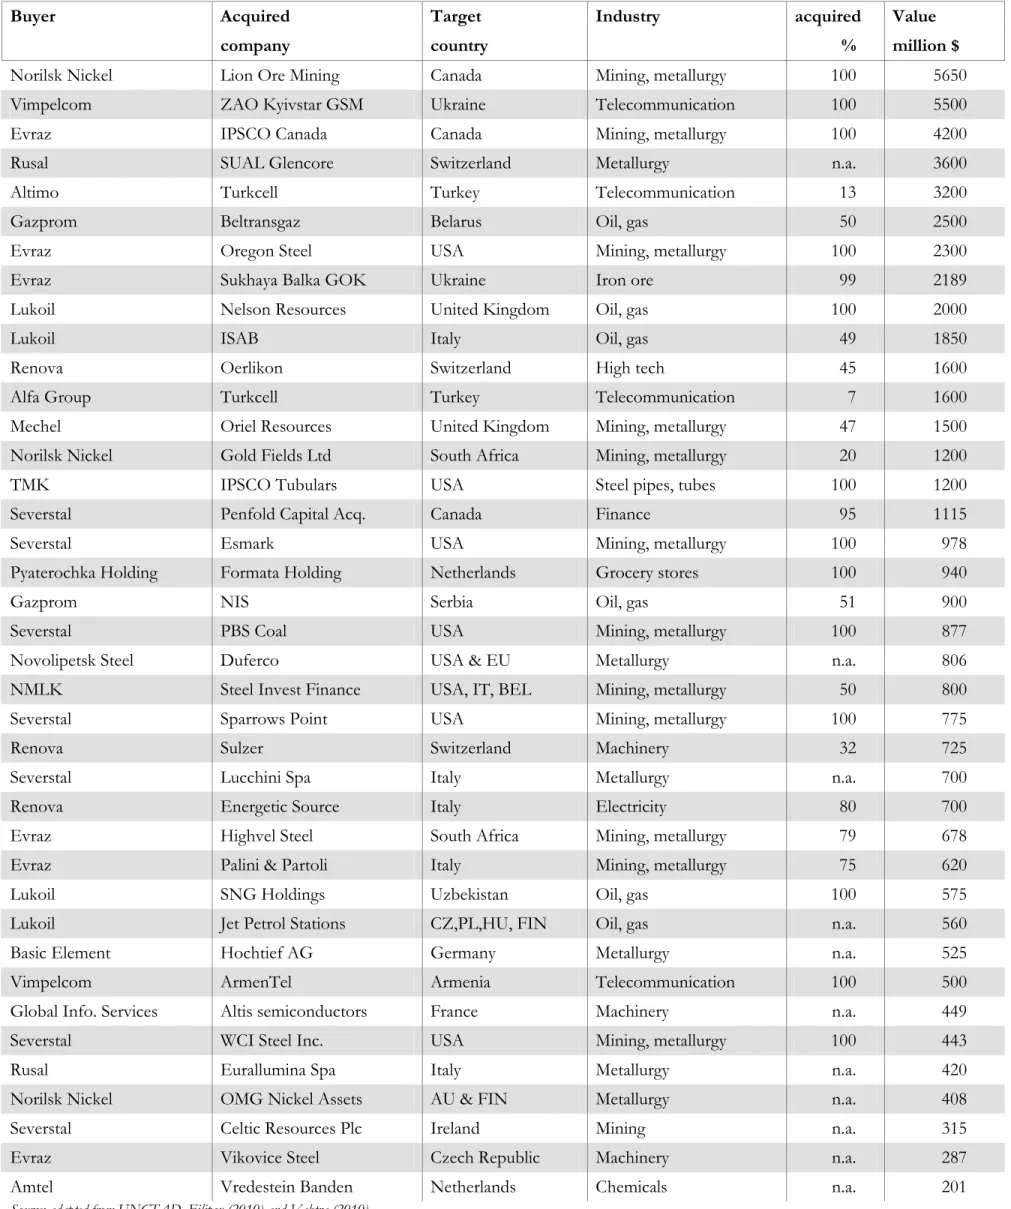
Table 9 - A sample of significant trans-border mergers-acquisitions achieved by Russian companies, 2005-2010
Buyer Acquired Target Industry acquired Value
company country % million $
Norilsk Nickel Lion Ore Mining Canada Mining, metallurgy 100 5650
Vimpelcom ZAO Kyivstar GSM Ukraine Telecommunication 100 5500
Evraz IPSCO Canada Canada Mining, metallurgy 100 4200
Rusal SUAL Glencore Switzerland Metallurgy n.a. 3600
Altimo Turkcell Turkey Telecommunication 13 3200
Gazprom Beltransgaz Belarus Oil, gas 50 2500
Evraz Oregon Steel USA Mining, metallurgy 100 2300
Evraz Sukhaya Balka GOK Ukraine Iron ore 99 2189
Lukoil Nelson Resources United Kingdom Oil, gas 100 2000
Lukoil ISAB Italy Oil, gas 49 1850
Renova Oerlikon Switzerland High tech 45 1600
Alfa Group Turkcell Turkey Telecommunication 7 1600
Mechel Oriel Resources United Kingdom Mining, metallurgy 47 1500
Norilsk Nickel Gold Fields Ltd South Africa Mining, metallurgy 20 1200
TMK IPSCO Tubulars USA Steel pipes, tubes 100 1200
Severstal Penfold Capital Acq. Canada Finance 95 1115
Severstal Esmark USA Mining, metallurgy 100 978
Pyaterochka Holding Formata Holding Netherlands Grocery stores 100 940
Gazprom NIS Serbia Oil, gas 51 900
Severstal PBS Coal USA Mining, metallurgy 100 877
Novolipetsk Steel Duferco USA & EU Metallurgy n.a. 806
NMLK Steel Invest Finance USA, IT, BEL Mining, metallurgy 50 800
Severstal Sparrows Point USA Mining, metallurgy 100 775
Renova Sulzer Switzerland Machinery 32 725
Severstal Lucchini Spa Italy Metallurgy n.a. 700
Renova Energetic Source Italy Electricity 80 700
Evraz Highvel Steel South Africa Mining, metallurgy 79 678
Evraz Palini & Partoli Italy Mining, metallurgy 75 620
Lukoil SNG Holdings Uzbekistan Oil, gas 100 575
Lukoil Jet Petrol Stations CZ,PL,HU, FIN Oil, gas n.a. 560
Basic Element Hochtief AG Germany Metallurgy n.a. 525
Vimpelcom ArmenTel Armenia Telecommunication 100 500
Global Info. Services Altis semiconductors France Machinery n.a. 449
Severstal WCI Steel Inc. USA Mining, metallurgy 100 443
Rusal Eurallumina Spa Italy Metallurgy n.a. 420
Norilsk Nickel OMG Nickel Assets AU & FIN Metallurgy n.a. 408
Severstal Celtic Resources Plc Ireland Mining n.a. 315
Evraz Vikovice Steel Czech Republic Machinery n.a. 287
Amtel Vredestein Banden Netherlands Chemicals n.a. 201
Source: adapted from UNCTAD, Filipov (2010) and Vahtra (2010).
The expansion of Russian MNCs abroad has often been interpreted in a first phase as capital runaway, if not exodus, toward friendly more stable and less risky foreign investment climates than in the Russian domestic market (Bulatov, 1998; Vahtra and Liuhto, 2004).
Following up the former red multinationals developed to serve Soviet foreign trade purposes, a rather frequent strategy of Russian MNCs is market seeking OFDI relaying previous export. This strategy first pertains to traditional markets such as the CIS; it is also the rationale for Russian OFDI in Western markets where Russian products face tough competition. Those Russian MNCs which invest abroad in mining, oil and gas industries have adopted a resource seeking approach and attempted to take over their most needed suppliers abroad by means of M&As. Russian OFDI in the CIS is basically resource seeking geared towards oil, gas and mining. The same strategy applies to the fairly recent Russian OFDI in Africa though it is mitigated here with a motive of accessing to new consumer markets. Russian MNCs have not yet adopted an efficiency seeking strategy although they could have envisaged it in the CIS and developing countries with lower production costs than in Russia.
Russian companies have conducted an asset seeking strategy based on overseas M&As in view of acquiring Western technology and R&D intensive units. Trans-border M&As enable them to consolidate their global competitiveness in creating or reaching the advantages of a monopoly or dominant oligopoly position in some foreign markets. The main target for M&As by Russian MNCs is to take over European and North American firms. Between 2005 and 2010, M&As have primarily targeted an entry in industries linked to natural resources in the U.S., Canada, Italy, Switzerland and South Africa (Table 9). Big trans-border M&As are less frequent in the close abroad whose firms are of smaller size and less attractive in terms of high tech assets. The proportion of M&As in Europe peaked up in 1997-2000 whereas the one in the CIS climaxed in 2001-2004. First asset acquisitions appeared in developing countries since 2005. Financial crisis impacted M&As undertaken by Russian MNCs downwards. The overall number of trans-border M&A deals was 114 in 2007 and 119 in 2008; it fell down to 102 in 2009 and 70 in 2010 (Filipov, 2011).
OFDI by Russian MNCs directly in R&D is less the rule than exception so far, but it is a significant sign of a step forward toward a more global strategy. For instance, Sistema entered the stock equity of an Indian company in the mobile telecom industry in 2008 and then attempted to acquire a German firm involved in microelectronics, Infineon, in 2009 (Vahtra, 2010). Similarly Sberbank had attempted (but failed) to participate into the purchase of Opel, a General Motors subsidiary, during the bankruptcy proceeding of this company, in view of capturing its high tech. In the iron and steel industry, Evraz, Severstal and Rusal have invested a big deal of money for technological development in their foreign subsidiaries whereas, in oil industry, Lukoil and TNK-BP have acquired foreign firms in view of upgrading their own technological level. This spread of overseas M&As by Russian MNCs in high-tech industries was backed and supported by the highest Russian authorities.
3.4 Predominant state ownership: Chinese multinationals
In 2005, 3,429 parent companies of Chinese MNCs had settled about 28,000 foreign subsidiaries. Most of the biggest Chinese MNCs are state-owned and backed by governmental financial assistance while private ones are fast-growing and even faster-globalising (Table 10). State-owned enterprises (SOEs) and privately-owned MNCs differentiate with regards to their motives of internationalisation since the government influence is absolutely decisive on the former while looser with the latter.
Chinese SOEs are attracted in countries with big markets or large endowment in natural resources and rather risky political environment. Private MNCs are more purely market seekers. Although all Chinese public and private firms have strategic intent with asset seeking, the attraction is toward commercially viable technology rather than core research content. Such technological asset seeking strategy is primarily adopted when investing in advanced developed economies where Chinese MNCs are motivated by an access to strategic assets corresponding to China’s strategic needs (Deng, 2007). Chinese MNCs are often portrayed as internationalising in order to improve their access to foreign proprietary technology and enhance competitiveness through diversifying their activity. Asset seeking has been used on purpose. With domestic wage inflation in the recent years, some Chinese companies started relocating their production in geographically close countries with markedly lower unit labour costs such as Vietnam
and North Korea. This signals the emergence of a new efficiency-seeking strategy which is likely to develop in the years to come with the current rise of unit labour cost in China.
Table 10 - The biggest 50 Chinese multinationals ranked by foreign assets, 2010
Rank Company Rank Company
1 China Unicom Corporation 26 China Huneng Group
2 China National Petroleum (CNPC) 27 China Communication Construction Co, Ltd
3 China Petrochemical Corporation 28 China Vanke Co, Ltd 4 China Resources (Holdings) Co, Ltd 29 China Metallurgical Group
5 China National Offshore Oil (CNOOC) 30 Yanzhou Coal Mining Company Ltd 6 China Merchants Group 31 SINOTRANS Changjiang Nl Shipping
Corp.
7 China State Construction Engineering Co 32 State Grid Corporation of China 8 China Ocean Shipping Company
(COSCO) 33
China North Industries Group Corporation
9 Sinochem Corporation 34 Guangzhou Yuexiu Holdings Limited 10 China Mobile Commiunications
Corporation 35 China Guandong Nuclear Power Holding 11 Huawei Technologies Co, Ltd 36 China Ship Buiding Industry Corporation 12 Aluminum Corporation of China 37 ZTE Corporation
13 China National Cereals, Oils &
Foodstuffs 38 Shougang Corporation
14 China Power Investment Corporation 39 China National Chemical Corporation 15 Legend Holdings Ltd 40 Yantai Xinyi Investment Ltd
16 Geely Holding Group 41 Shanghai Baosteel Group Corporation 17 China Minmetals Corporation 42 Changsha Zoomlion HI S&T
Development
18 CITIC Group 43 Shum Yip Holdings Company Ltd 19 China Poly Group Corporation 44 China Non Ferrous Metal Mining &
Constr.
20 Beijing Enterprises Group Company Ltd 45 SINOHYDRO Co, Ltd 21 Hunan Valin Iron & Steel Co, Ltd 46 Jiangsu Shagang Group
22 China Shipping Company 47 China International Marien Containers Ltd
23 China National Aviation Holding Corp. 48 Wuhan Iron & Steel Corporation 24 GDH Limited 49 China National Gold Group Corporation 25 SinoSteel Corporation 50 Jinchuan Group Ltd
Table 11 - A sample of significant trans-border mergers-acquisitions achieved by Chinese companies, 2004-2011
Buyer Acquired company or
country of acquisition Industry
Value million $
CNOOC (1) Unocal Oil 18500
Chinalco Rio Tinto (12%) Mining 14280
Sinopec Addax Petroleum (Swizt.) Oil 7200
Sinopec Repsol, Brazil (40%) Oil 7100
China Investment Corp Morgan Stanley (9.9%) Banking 5000
Sinopec Conoco Phillip, Canada
(9%) Oil 4650
COSL Awilco Offshore Drilling 3890
Huaneng Power Tuas Power (Singapore) Power 3070
Sinopec Udmurneft Oil 3500
CNPC PetroKazzakhstan Oil 3960
CNOOC Bridas (Argentina) Oil 3100
Sinochem Peregrino field (Brazil)
40% Oil 3070
China Investment Corp Blackstone Group L.P. Private equity 3000
Yanzhou Coal Felix Resources (Australia) Coal 2950
CNPC KaMunaigas Gas 2600
CNOOC Awilco Offshore
(Norway) Oil 2500
CNOOC Pan American, Argentina
30% Oil 2470
Sinopec Occidental (Argentina) Oil 2450
CNOOC South Atlantic Petroleum Oil 2268
CNOOC Chesapeake Energy, US
(33%) Oil 2200
Investor Group Kazakhstan Energy 1874
Geely Volvo Automobile 1500
Lenovo Group IBM PC Business Computers 1760
CNPC National Iranian Oil
Company Oil 1760
Buyer Acquired company or
country of acquisition Industry
Value million $
Wanhua Polyurethanes Borsodchem (Hungary) Chemicals 1701
China Investment Corp Lexington Partners (USA) Finance 1500
CNPC Shell Syria Energy 1500
Sinochem Makhteshim-Agan, Israel,
60% Agriculture 1440
CNPC Canadian Energy Oil 1420
Minmetals Oz Minerals Mining 1350
Sinosteel Midwest (Australia) Iron 1300
Haier America Trading Maytag Corp Appliances 1280
CNPC Mynamar Oil & Gas Construction 1280
Huaneng Power IntrerGen, US (50%) Power 1230
China Investment Corp Penn West, Canada (5%) Oil 1220
Xingxing Iron &
Minmetals Kelachandra & Manasara Steel 1200
Bosai Minerals Ghana Minerals Aluminium 1200
Jiangsu Itaminas (Brazil) Iron 1200
PetroChina Keppel, Singapore
Petroleum Oil 1020
CITIC Securities Bear Stearns (9.9%) Banking 1000
State Grid Cobra Elecnor & Isolux,
Brazil Power 990
China Investment Corp Apax Finance Finance 960
Sinochem Emeral Energy Energy 880
Hunan Valin Iron &
Steel Fortescue Metals (16.5%) Iron 770
Sinopec Chevron Indonesia Gas 680
Hudian Sintez (Russia) (51%) Gas 650
China Investment Corp Goldman Sachs distress
fund Finance 600
Sinopec AED (Australia) (60%) Oil 560
China Merchants Group Loscam Shipping 550
China Investment Corp Blackrock Finance 530
Buyer Acquired company or
country of acquisition Industry
Value million $
(10%)
Shanghai Automobile Ssangyong Motors Automobile 509
Sinochem Soco (Yemen) Oil 470
China Merchants Group Aitken Spence, Sri Lanka Shipping 450
Jinchuan Continental Metals,
Canada Mining 420
Wuhan Iron & Steel MMX Mineracao, Brazil
22% Iron 400
Guandong Rising Asset Caledon (Australia) Coal 400
China Investment Corp Diaego Food 370
Huawei Technologies 3Com Corporation
(16.5%) (2) Telecommunication 363
Chalco GIIG (Malaysia) Aluminium 350
China Int. Marine
Containers Yantai Raffles Shipyard Shipping 330
Shanghai Automobile GM India (50%) Automobile 330
China Minsheng UCBH Holdings (10%) Banking 317
China Investment Corp Nobel Holdings (Russia) Oil 300
Tencent Digital Sky, Russia (10%) Technology 300
Jiangsu Shagang Bulk Minerals & Grange Iron 270
China Railway Materials African Minerals,Sierra
Leone Iron 260
Zoomlion Compagnia Forme
Acciaio Construction 250
China Investment Corp South Gobi Energy,
Mongolia Coal 250
Baosteel Aquila Resources
(Australia) Iron 240
Jinchuan Group Wesizwe Platinu Mining 230
Nanjing Automobile MG Rover Automobile 205
Mindray Medical Datascope Corporation
unit Medical devices 202
Buyer Acquired company or
country of acquisition Industry
Value million $
BAIC Saab Automobile 200
Baiyin, CITIC & Chang
Xin Oxus (Uzbekistan) Mining 190
Ningbo Qingchun Clothing
Youghwa Weaving &
Dyeing Textile 184
Cosco Peninsular & Oriental
Steam Shipping 181
Navigation
Three Gorges EuroSibEnergo (Russia) Power 170
China Merchants Group Ming Wah Universal Transportation 168
CNPC Turkmenistan Motor, transport 167
Sinopec First International Oil Oil 160
WuXi PharmaTech AppTec Laboratory Biopharmaceuticals 151
Great Wall Motor Litex Motors (Bulgaria) Automobile 120
China Investment Corp GDF Suez (30%) Electric services n.a. (1) Eventually failed due to national security issues.
(2) Failed due to political objections and national security reasons.
Source: adapted from H. Rui, G.S. Yip & S. Prashantham (2010) and Salidjanova (2011).
The M&A mode of Chinese MNCs’ entry suddenly took off after 2000 targeting both developed and developing countries (Table 11). In 2004, a circular issued by the National Development Research Council (NDRC) and the Export-Import Bank of China explicitly promoted trans-border M&As. Renminbi appreciation against the US dollar and Euro in the recent years has reduced the cost of Chinese M&As over Western companies. From 2000 to 2010, Chinese MNCs merged or acquired 83 companies located in EU countries (Clegg and Voss, 2012). But between 2007 and 2009, the total number of Chinese overseas M&As plummeted from 243 to 82; the total trans-border M&A value fell from $32.8 billion to $1.4 billion.Most overseas M&As achieved between 2008 and 2010 failed and translated into a fall in the stock value of those companies involved. Thus, in presence of very high country risk, Chinese MNCs prefer greenfield investment. When a host country has stronger national innovation ability or higher level of human capital, Chinese firms tend to choose M&As. An increase in the cultural distance appears to induce Chinese MNCs to select M&As as well (Hu et al., 2012). The number and magnitude of trans-border M&A deals by Chinese MNCs on average are much bigger than those observed with other BRICs’ MNCs, except the giant Mittal-Arcelor deal.
4.
Geographical orientation of BRICs’ outward foreign direct investment
Tax havens such as Cyprus, Hong Kong, Virgin Islands, Cayman Islands, Channel Islands, Bahamas, Gibraltar, Macau, and St Vincent & Grenadines are highly ranked among the major host countries of BRICs’ OFDI as well as tax-friendly developed countries like Luxembourg, Switzerland, the Netherlands, and Austria (Table 12). Most of them, like Cyprus, are well-known rocket pads for round tripping circular investment. A part of OFDI in tax havens consists in round tripping FDI, i.e. for instance investment by Russian enterprises and citizens in offshore companies, in particular in Cyprus and the Virgin Islands, in view of reinvesting the corresponding capital later on in Russia11. A significant share of Chinese OFDI consists in round tripping as well, since 75% of overall stock in 2010 is invested in tax havens12, which is a much higher share
than with Russian OFDI. It is what most of Chinese OFDI in Hong Kong, Macau, the Virgin and Cayman Islands is all about.
Top host countries of Brazilian OFDI are Caribbean tax havens and tax-friendly developed countries. FDI outflows to tax havens often flow back to Brazil, mainly in the form of intra-company transfers: 91% of annual cross-border intra-company transfers of Brazilian MNCs were with tax havens in 2008. However this sort of round tripping seems to be less widespread than in the case of Russian and Chinese OFDI. Fiscal regulation in Brazil seemingly induces investment in tax havens to escape regulatory and tax obligations. This suggests that Brazilian MNCs undertake trans-shipping FDI in tax-haven countries while waiting for good opportunities to make productive investment in third countries. This behaviour is different from that of Chinese MNCs that tend to be involved in round tripping OFDI due to favorable conditions offered by Chinese government to foreign investors in mainland China. The share of round tripping via tax havens in Indian OFDI must be lower than in the three other BRICs though the great bulk of OFDI channeled from India to countries such as Mauritius, Cyprus and Virgin Islands is ultimately geared toward third countries.
11 Since the 2008-on crisis round tripping and trans-shipping OFDI received in offshore economies has accelerated again to reach up to two-thirds of Russian OFDI. Its final destination is the CIS, CEECs and primarily the Russian Federation herself.
12 Indeed, only a part of Chinese OFDI transiting through tax havens namely Hong Kong, are round tripping flows. There is no official assessment of round tripping OFDI published by the MOFCOM. Western experts of China and press articles assess that it may be up to 50% of OFDI to Hong Kong.
Table 12 - Major host countries of BRICs’ OFDI stock
Brazilian OFDI 2012 $mn % Russian OFDI 2011 $mn %
Austria 56618 22.9 Cyprus 121596 33.6
Cayman Islands 40264 16.3 Netherlands 57291 15.8
Netherlands 28186 11.4 Virgin islands 46137 12.8
Virgin Islands 22291 9.0 Switzerland 12679 3.5
United States 18401 7.4 Luxembourg 11599 3.2
Spain 15376 6.2 United Kingdom 10662 2.9
Luxembourg 14719 6.0 United States 9501 2.6
Bahamas 14500 5.9 Jersey 7035 1.9
Argentina 5511 2.2 Germany 6692 1.8
Hungary 3207 1.3 Gibraltar 5701 1.6
Peru 2986 1.2 Bahamas 5481 1.5
Uruguay 2951 1.2 Belarus 4663 1.3
Panama 2430 1.0 St Vincent Grenad. 4421 1.2
Portugal 2139 0.9 Ukraine 4395 1.2
Canada 1804 0.7 Austria 4229 1.2
Indian OFDI 2009* $bn % Chinese OFDI 2010 $mn %
Singapore 14.2 20.8 Hong Kong 199056 62.8
Netherlands 10.6 15.4 Virgin Islands 23243 7.3
Mauritius 5.6 8.1 Cayman Islands 17256 5.4
Channel Islands 5.4 7.9 Australia 7868 2.4
United Kingdom 5.2 7.6 Singapore 6069 1.9
United States 5.1 7.4 Luxembourg 5787 1.8
Cyprus 4.7 6.8 USA 4874 1.5
United Arab Emirates 2.1 3.1 South Africa 4153 1.3
Russia 1.4 2.0 Russia 2788 0.9
Sudan 1.2 1.7 Canada 2603 0.8
Switzerland 1.1 1.6 Macau 2229 0.7
China 0.9 1.3 Myanmar 1947 0.6
Virgin Islands 0.9 1.2 Pakistan 1828 0.6
Egypt 0.8 1.2 Kazakhstan 1591 0.5
Denmark 0.8 1.2 Germany 1502 0.5
* Cumulative stock of outward investment approvals, 2002-2009
Sources: Banco Central do Brazil, Central Bank of Russia, Reserve Bank of India and MOFCOM Statistical Bulletin.
A next destination of BRICs OFDI encompass developed countries and major export markets, like the Netherlands, the UK, Germany, Austria, Turkey, Spain, Bulgaria, France for Russian OFDI. Western advanced economies are important hosts of Chinese OFDI as well, first of all Australia and the US (the Pacific Rim). As other BRICs’ MNCs, in the past decade Brazilian firms have re-oriented their investment abroad toward Europe (44.7% of total in 2012) which is now their major host area.