HAL Id: hal-01259859
https://hal.sorbonne-universite.fr/hal-01259859
Submitted on 21 Jan 2016
HAL is a multi-disciplinary open access
archive for the deposit and dissemination of
sci-entific research documents, whether they are
pub-lished or not. The documents may come from
teaching and research institutions in France or
abroad, or from public or private research centers.
L’archive ouverte pluridisciplinaire HAL, est
destinée au dépôt et à la diffusion de documents
scientifiques de niveau recherche, publiés ou non,
émanant des établissements d’enseignement et de
recherche français ou étrangers, des laboratoires
publics ou privés.
One-year metreleptin improves insulin secretion in
patients with diabetes linked to genetic lipodystrophic
syndromes
C. Vatier, S. Fetita, P. Boudou, C. Tchankou, L. Deville, Jp. Riveline, J.
Young, L. Mathivon, F. Travert, D. Morin, et al.
To cite this version:
C. Vatier, S. Fetita, P. Boudou, C. Tchankou, L. Deville, et al.. One-year metreleptin improves insulin
secretion in patients with diabetes linked to genetic lipodystrophic syndromes. Diabetes, Obesity and
Metabolism, Wiley, 2016, �10.1111/dom.12606�. �hal-01259859�
One-year metreleptin treatment improves insulin secretion
1
in patients with diabetes linked to genetic lipodystrophic syndromes
2
3
Short running title : Metreleptin effect on insulin secretion in lipodystrophic syndromes
4
C. Vatier1,2, S. Fetita3, P. Boudou4, C. Tchankou3,L. Deville5, JP. Riveline3,6, J. Young7, L. Mathivon8, F.
5
Travert9, D. Morin10, J. Cahen11,O. Lascols1,2,12, F. Andreelli2,13, Y. Reznik14, E. Mongeois15, I. Madelaine5, MC.
6
Vantyghem16, JF. Gautier3,6,17*, C. Vigouroux1,2,12*
7
8
1
Sorbonne Universités,UPMC Univ Paris 06, and INSERM, UMR_S938, Centre de Recherche Saint-Antoine,
9
F-75012, Paris, France
10
2
ICAN, Institute of Cardiometabolism and Nutrition, F-75013, Paris, France
11
3 AP-HP, Groupe Hospitalier Lariboisière-Saint-Louis, Service de Diabétologie et Endocrinologie, F-75010,
12
Paris, France
13
4 AP-HP, Hôpital Saint-Louis, Service de Biochimie, F-75010, Paris, France
14
5
AP-HP, Hôpital Saint-Louis, Département de Pharmacie, F-75010, Paris, France
15
6 INSERM, UMR_S1138, Centre de Recherche des Cordeliers, Paris, F-75006 France
16
7
AP-HP, Hôpital Bicêtre, Service d'Endocrinologie et des Maladies de la Reproduction, F-94275, Le
Kremlin-17
Bicêtre, France
18
8
Centre Hospitalier de Meaux, Service de Pédiatrie, F-77104, Meaux, France
19
9 AP-HP, Hôpital Bichat, Service d’Endocrinologie, Diabétologie, Nutrition F-75018, Paris, France
20
10
CHRU Montpellier, Hôpital Arnaud de Villeneuve, Service de Pédiatrie, 34295 Montpellier, France
21
11 Centre Hospitalier, Service d’Endocrinologie et Métabolismes, 95100 Argenteuil, France
22
12
AP-HP, Hôpital Saint-Antoine, Laboratoire Commun de Biologie et Génétique Moléculaires, F-75012, Paris,
23
France
24
13
AP-HP, Groupe Hospitalier Pitié-Salpêtrière, Service de Diabétologie, F-75013 Paris, France
25
14 Service d’Endocrinologie, Centre Hospitalier Universitaire Côte-de-Nacre, F-14033, Caen, France; Equipe
26
d’Accueil 2608, Université de Caen-Basse Normandie, F-14032, Caen, France; Unité sous Contrat 2006, Institut
27
National de la Recherche Agronomique, F-14032 Caen, France;
28
15 Centre Hospitalier Régional d’Orléans, Service d’Endocrinologie, F-45000 Orléans, France
29
16 Centre Hospitalier Régional Universitaire de Lille, Service d’Endocrinologie et Métabolisme, F-59037 Lille,
France
31
17 Université Paris-Diderot Paris-7, Paris, France
32
33
* These authors contributed equally to this work
34
35
36
Corresponding authors:
37
Corinne Vigouroux, INSERM UMR_S938, Faculté de Médecine Pierre et Marie Curie, site Saint Antoine, 27
38
rue Chaligny, 75571, Paris Cedex 12, France.
39
Fax: +33 1 40 01 14 32, Phone: +33 1 40 01 14 84, [email protected]
40
41
42
ABSTRACT
43
Recombinant methionyl human leptin (metreleptin) therapy was shown to improve hyperglycemia, dyslipidemia
44
and insulin sensitivity in patients with lipodystrophic syndromes, but its effects on insulin secretion remain
45
controversial.
46
We used dynamic intravenous clamp procedures to measure insulin secretion, adjusted to insulin sensitivity, at
47
baseline and after one-year metreleptin therapy, in 16 consecutive patients with lipodystrophy, diabetes and
48
leptin deficiency.
49
Patients, aged 39.2 ± 4 years (mean ± SEM), presented with familial partial lipodystrophies (n=11, 10 women)
50
or congenital generalized lipodystrophy (n=5, 4 women). Their BMI (23.9 ± 0.7 kg/m2), HbA1c (8.5 ± 0.4%)
51
and serum triglycerides (4.6 ± 0.9 mmol/l) significantly decreased within 1 month of metreleptin therapy, then
52
remained stable. Insulin sensitivity (from hyperglycaemic or euglycemic hyperinsulinemic clamps, n = 4 and 12,
53
respectively), insulin secretion during graded glucose infusion (n=12), and acute insulin response to intravenous
54
glucose adjusted to insulin sensitivity (disposition index, n=12), significantly increased after 1 year of
55
metreleptin therapy. Increase in disposition index was related to decrease in percent total and trunk body fat.
56
Metreleptin therapy improves not only insulin sensitivity, but also insulin secretion in patients with diabetes due
57
to genetic lipodystrophies.
58
INTRODUCTION
60
Leptin deficiency, linked to reduced fat amount, is thought to importantly contribute to the metabolic
61
complications associated with lipodystrophic syndromes, as shown by studies in mice [1,2] and humans [3,4]. In
62
generalized forms of lipodystrophies, metreleptin therapy dramatically decreased liver and muscle lipid content,
63
improving insulin sensitivity, hyperglycemia and dyslipidemia, partly independently of decreased caloric intake
64
[3,4]. However, in partial forms of lipodystrophies, the effect of metreleptin on hyperglycemia has not been
65
clearly established in patients with moderate baseline metabolic alterations [5-7]. In addition, the effect of
66
metreleptin on insulin secretion, which remains controversial, has been previously investigated using only oral
67
glucose tolerance tests [3,6,8-10].
68
In this study, we evaluated the effect of metreleptin on insulin sensitivity and insulin secretion using dynamic
69
intravenous clamp procedures in 16 patients with genetic lipodystrophy syndromes, included in a compassionate
70
therapeutic programme.71
72
METHODS73
(see also Supplementary appendix)
74
75
Patients
76
Twenty-two non HIV-infected patients with genetic or acquired, partial or generalized lipodystrophy, diabetes
77
and low serum leptin (ie, fasting leptin ≤ 6 ng/ml), entered a compassionate programme of metreleptin therapy
78
approved by the National French Health Agency. Among them, sixteen consecutive patients older than 16 years
79
gave their informed consent for metabolic investigations at baseline and after one year of therapy, which were
80
approved by the local ethics committee (Comité de Protection des Personnes, Paris-St-Louis).
81
Recombinant human methionyl-leptin (r-metHuLeptin/metreleptin, Amylin/Bristol-Myers-Squibb/AstraZeneca
82
Pharmaceuticals, San Diego, CA), self-administered in one daily subcutaneous injection at the initial dose of
83
0.02 mg/kg (M0) increased to 0.08 mg/kg at one month (M1), was added to the patients’ regimen, stable for at
84
least 6 weeks. Every three months, metreleptin and other medications were adapted to tolerance and
85
effectiveness, and anthropometric parameters, lipid profile, HbA1c, renal and liver function tests were collected.
86
The mean metreleptin daily dose at one year (M12) was 0.10 mg/kg ± 0.02 (SEM).
87
88
Metabolic investigations using insulin and/or glucose intravenous infusions were performed at M0 and M12.
The first four patients (1 to 4) were evaluated with hyperglycemic clamps, and the twelve subsequent patients (5
90
to 16) with euglycemic hyperinsulinemic clamps and intravenous glucose tolerance test (IVGTT) followed by a
91
graded IV-glucose infusion (glucose ramping).
92
Hyperglycemic clamps allowed the measurement of acute insulin response to an intravenous bolus of glucose
93
(AIR), and the ratio of the glucose disposal rate to insulin concentration (M/I) at the 200 mg/dl-hyperglycemic
94
plateau, as an estimate of insulin sensitivity.
95
Euglycemic hyperinsulinemic clamps estimated the whole-body insulin sensitivity to glucose, expressed as the
96
insulin-stimulated glucose disposal rate (M-value), further adjusted to insulin concentrations (M/I). AIR was
97
calculated from IVGTT. Insulin secretion rates (ISR) in response to four-step graded glucose infusions evaluated
98
the beta-cell sensitivity to glucose.
99
The disposition index was calculated as the product of AIR by M measured during euglycemic hyperinsulinemic
100
clamps [11].101
102
Statistical analyses103
A favorable effect of metreleptin on glucose control was defined as a 0.5-point decrease in HbA1c, or HbA1c
104
stability with a decrease of more than 50% in total daily insulin or oral antidiabetic doses, or discontinuation of
105
one antidiabetic class, between M0 and M12. Results are presented as mean ± SEM, unless otherwise specified.
106
See File S1 for supplemental methods and references.
107
108
109
RESULTS
110
Anthropometric and metabolic markers
111
Patients with diabetes, attributable to familial partial lipodystrophy (FPLD) linked to LMNA (nine women),
112
PPARG (one man) or PLIN1 mutations (one woman), or to congenital generalized lipodystrophy attributable to
113
AGPAT2 mutations (CGL1) (four women, one man) were included in the study (Table S1). They presented
114
different forms of lipodystrophic syndromes with insulin resistance and dyslipidemia, attributable to already
115
described causative mutations (for review, see [12]). Their age and BMI were 39.2 ± 4.0 years and 23.9 ± 0.7
116
kg/m2, respectively. Their serum leptin was low (2.7 ± 0.5 ng/ml), related to fat mass (r2=0.7, p=0.003). BMI,
117
total energy intake (but not food macronutrient distribution), HbA1c, triglycerides, aspartate aminotransferase
118
(AST) and gamma glutamyl transferase levels significantly decreased within the first month of metreleptin
119
therapy, then were not significantly modified until M12 (Table 1, Figure S1, and data not shown). After one-year
120
metreleptin therapy, proportion of total body fat and lean masses were not significantly modified, but abdominal
121
and percentage of truncal fat decreased or tended to decrease. Patients used a lower number of antidiabetic
122
classes, and three among nine of them stopped insulin therapy (Table 1). One-year changes in BMI, HbA1c and
123
triglycerides were not significantly related to baseline leptin levels.
124
Fourteen of 16 patients met the criteria for a glucose response to metreleptin. However, one of these fourteen
125
patients cannot be formally considered as a responder since, although her glucose control was strikingly
126
improved after one-year metreleptin whereas glitazones were stopped, her basal insulin doses were increased
127
from 24 to 30 U/day and her metformin dose from 1g to 3g per day (patient 9, Table S2). The two non-responder
128
patients were the only patient with a PLIN1-linked partial lipodystrophy, and a patient with FPLD2 with
129
moderately elevated baseline HbA1c (patients 6 and 12, Table S2). None of them reported any difficulties
130
regarding the compliance with the treatment. Compared to other patients with partial lipodystrophies, they had
131
baseline values of serum leptin, percent body fat, waist circumference and duration of diabetes above the median
132
levels. They were the only patients who did not lose, or even gained weight (+0 and +3.2 kg, respectively) over
133
the one-year period.
134
Insulin sensitivity
135
Insulin-stimulated glucose disposal rate during euglycaemic hyperinsulinemic clamp (n=12) significantly
136
increased during metreleptin therapy, from 2.72 ± 0.79 to 5.44 ± 1.19 mg/kg of fat free mass/min (p=0.0005) for
137
M-value and 0.013 ± 0.005 to 0.031 ± 0.008 mg/kg of fat free mass/min/pmol/l for M/I (p=0.02), showing that
138
the whole-body insulin sensitivity improved. Of note, in three patients (patients 6, 8 and 13, Table S1),
139
euglycemia was maintained without any glucose infusion during the hyperinsulinemic clamp at baseline, while a
140
significant glucose infusion rate was mandatory after one year-metreleptin therapy, pointing to a significant
141
improvement in insulin sensitivity. In the four patients evaluated with the hyperglycemic clamp, M/I increased
142
by a mean of 48% (Table S3).
143
Insulin secretion
144
Acute insulin response to intravenous glucose (AIR, n=16) did not significantly increased after one-year
145
metreleptin therapy (88.9 ± 27.5 pmol/kg/min at M0 and 128.8 ± 36.4 at M12, p=0.19). However, insulin
146
secretion rate (ISR) during glucose ramping was higher at every hyperglycemic step (ANOVA overall effect
147
p<0.0001), and the disposition index (AIR x M-value), which adjusts the acute beta-cell function to insulin
148
sensitivity[11] increased after one-year metreleptin (n=12) (Figure 1) (Table S3). The AIR x M/I index, assessed
149
in the whole group, also significantly increased (from 6.3 ± 3.8 to 9.2 ± 3.1, p=0.02).
150
Although one-year changes in HbA1c, triglycerides, M-value, and AIR were not significantly associated with
151
modifications in anthropometric parameters (data not shown), disposition index variation was significantly
152
related to changes in percent total body fat (r2=0.71, p=0.008), and percent trunk fat mass (r2=0.40, p=0.05).
153
154
Metreleptin response in the LMNA-mutated subgroup of patients
155
In patients with LMNA mutations (n=9), BMI, HbA1c, triglycerides and liver enzymes significantly decreased
156
after one-year metreleptin therapy (data not shown), while M-value increased from 2.88 ± 1.13 to 6.85 ± 1.65
157
mg/kg of fat free mass/min (n=7, p=0.02). ISR increased or tended to increase at the four steps of glucose
158
ramping, with a mean increase of 36%, and the disposition index significantly increased, from 208.8 ± 154.3 to
159
1068 ± 543.9 (n=7, p=0.02) (Figure S2 and Table S3). In this group, the decrease of HbA1c at M12 was
160
positively correlated with the initial HbA1c level (r2=0.7, p=0.03), but was not related to the initial leptinemia.
161
162
DISCUSSION
163
In patients with lipodystrophy, metreleptin therapy was shown to improve insulin sensitivity [8,13,14]. However
164
the studies that investigated its effects on insulin secretion were done using oral glucose tolerance tests, and gave
165
heterogeneous results [3,6,8-10]. Interestingly, leptin has been shown to have dual effects on pancreatic beta-cell
166
function: while suppressing insulin gene expression and secretion, it also inhibits ectopic lipid storage in islet
167
cells, thus preventing lipotoxicity in rodent models [15].
168
The present study, which used dynamic i.v. clamp techniques in 16 patients with diabetes and endogenous
169
hypoleptinemia due to genetically-determined lipodystrophic syndromes, shows that metreleptin treatment for 1
170
year significantly improved insulin secretion. It also confirms that it decreased HbA1c, triglycerides and liver
171
enzymes and enhanced insulin sensitivity, with a two-fold increase in insulin-stimulated glucose disposal rate
172
after one year, as reported [8]. Importantly, in this context of severe insulin resistance, we adjusted insulin
173
secretion measurements for insulin sensitivity using the disposition index, based on the hyperbolic function
174
linking acute insulin response and insulin sensitivity [11]. Improvement of this index showed that, in patients
175
with lipodystrophy, metreleptin therapy increased beta-cell sensitivity to glucose.
176
Metreleptin-induced changes in disposition index and body fat mass and distribution were correlated, suggesting
177
that improvement in beta-cell secretory function could result from decreased lipotoxicity. In accordance, the two
178
non-responder patients did not lose, or even gained weight under metreleptin. Leptin could also inhibit glucagon
179
oversecretion, which was reported in insulin-deficient mice [16] and remains to be investigated in patients with
180
lipodystrophy under metreleptin therapy.
181
In patients with partial forms of lipodystrophies as a result of mutations in the LMNA gene, defects of insulin
182
secretion have been suspected to prevent the beneficial effect of metreleptin on glucose homeostasis [5]. Our
183
present results show that metreleptin therapy also increases insulin secretion in this subgroup of patients,
184
affected by typical Dunnigan syndrome (FPLD2) [17] or by previously described mixed laminopathic
185
phenotypes associating lipodystrophic syndrome and progeroid or cardiomyopathic signs [18,19]. In addition, in
186
accordance with recent findings showing that, in patients with partial lipodystrophy, metreleptin was mainly
187
useful if metabolic derangements were severe [7], the present study shows that effect of metreleptin on glucose
188
control in these patients was related to the baseline level of HbA1c
.
189
In conclusion, 1 year of metreleptin therapy improves beta-cell function in patients with lipodystrophy, leptin
190
deficiency and diabetes. Improved insulin secretion, related to fat mass and distribution changes, probably
191
contributes to the metabolic benefits of metreleptin. Further studies are required to investigate whether these
192
effects are maintained over time and to study mechanisms by which metreleptin affects the islets. Leptin has
193
been proposed to protect the islets by acting on several pathophysiological steps involved in beta-cell
194
lipotoxicity and in glucagon production during diabetes [20]. These leptin-regulated pathways, which control,
195
among others, de novo ceramide synthesis, could be further studied in response to metreleptin therapy.
196
197
198
ACKNOWLEDGEMENTS
199
We thank the patients who participated in this study, the nurses from the Diabetology-Endocrinology
200
Department of Saint-Louis hospital, Paris, France, David Savage of Addenbrooke's Hospital, Cambridge, UK for
201
help with a genetic diagnosis, Profs Eric de Kerviler of AP-HP, Department of Radiology, Saint-Louis Hospital,
202
Paris, France and Robert Carlier and Mr Dominique Laurent of AP-HP, Department of Radiology,
Raymond-203
Poincaré Hospital, Paris, France for CT-scan analyses, Amylin/Bristol-Myers Squibb/AstraZeneca and in
204
particular Dr Jean Chan and Ms Poonam Rohilla for generously providing metreleptin.
205
206
CONFLICT OF INTEREST
This work was supported by funding sources from DHOS-INSERM (Translational clinical research 2010),
208
ICAN Foundation (grant ANR-10-IAHU) and the National Program for Diabetes Research (PNRD/ARD).
209
C.Vatier was the recipient of a PhD grant from the Conseil Régional d'Ile de France
(Cardiovasculaire-Obésité-210
Diabète Domaine d'Intérêt Majeur). C.T received grants from the Société Francophone du Diabète.
211
C. Vatier, JF. Gautier and C. Vigouroux designed the study, managed the metreleptin therapy, performed the
212
metabolic clamps, collected and analysed the data and wrote the manuscript. S. Fetita, C. Tchankou and JP.
213
Riveline performed the metabolic clamps. P. Boudou performed the biochemical tests. L. Deville and I.
214
Madelaine managed the metreleptin delivery. J. Young, L. Mathivon, F. Travert, D. Morin, J. Cahen, F.
215
Andreelli, Y. Reznik, E. Mongeois, MC. Vantyghem and C. Vigouroux referred the patients and collected data.
216
O. Lascols performed the genetic analyses. All authors approved the final version of the manuscript.
217
218
SUPPORTING INFORMATION
219
Additional Supporting Information may be found in the online version of this article :
220
File S1. Supplemental methods and references.
221
Figure S1. Longitudinal effects of metreleptin therapy in the 16 patients.
222
Figure S2. Effects of metreleptin on insulin secretion in patients with LMNA mutations.
223
Table S1. Baseline characteristics of the 16 studied patients.
224
Table S2. Use of antidiabetic medications during metreleptin therapy.
225
Table S3. Insulin secretion and insulin sensitivity indexes before and one year after metreleptin therapy.
226
227
228
REFERENCES
229
1. Shimomura I, Hammer RE, Ikemoto S, Brown MS, Goldstein JL. Leptin reverses insulin resistance and
230
diabetes mellitus in mice with congenital lipodystrophy. Nature 1999; 401: 73-76.
231
232
2. Colombo C, Cutson JJ, Yamauchi T et al. Transplantation of adipose tissue lacking leptin is unable to
233
reverse the metabolic abnormalities associated with lipoatrophy. Diabetes 2002; 51: 2727-2733.
234
235
3. Javor ED, Cochran EK, Musso C, Young JR, Depaoli AM, Gorden P. Long-term efficacy of leptin
236
replacement in patients with generalized lipodystrophy. Diabetes 2005; 54: 1994-2002.
237
238
4. Chong AY, Lupsa BC, Cochran EK, Gorden P. Efficacy of leptin therapy in the different forms of
239
human lipodystrophy. Diabetologia 2010; 53: 27-35.
240
241
5. Simha V, Subramanyam L, Szczepaniak L et al. Comparison of efficacy and safety of leptin
242
replacement therapy in moderately and severely hypoleptinemic patients with familial partial lipodystrophy of
243
the Dunnigan variety. J Clin Endocrinol Metab 2012; 97: 785-792.
244
6. Park JY, Javor ED, Cochran EK, DePaoli AM, Gorden P. Long-term efficacy of leptin replacement in
246
patients with Dunnigan-type familial partial lipodystrophy. Metabolism 2007; 56: 508-516.
247
248
7. Diker-Cohen T, Cochran E, Gorden P, Brown RJ. Partial and generalized lipodystrophy: comparison of
249
baseline characteristics and response to metreleptin. J Clin Endocrinol Metab 2015; 100: 1802-1810.
250
251
8. Ebihara K, Kusakabe T, Hirata M et al. Efficacy and safety of leptin-replacement therapy and possible
252
mechanisms of leptin actions in patients with generalized lipodystrophy. J Clin Endocrinol Metab 2007; 92:
532-253
541.
254
255
9. Guettier JM, Park JY, Cochran EK et al. Leptin therapy for partial lipodystrophy linked to a
PPAR-256
gamma mutation. Clin Endocrinol (Oxf) 2008; 68: 547-554.
257
258
10. Muniyappa R, Brown RJ, Mari A et al. Effects of Leptin Replacement Therapy on Pancreatic beta-Cell
259
Function in Patients With Lipodystrophy. Diabetes Care 2014; 37: 1101-1107.
260
261
11. Kahn SE, Prigeon RL, McCulloch DK et al. Quantification of the relationship between insulin
262
sensitivity and beta-cell function in human subjects. Evidence for a hyperbolic function. Diabetes 1993; 42:
263
1663-1672.
264
265
12. Vatier C, Bidault G, Briand N et al. What the genetics of lipodystrophy can teach us about insulin
266
resistance and diabetes. Curr Diab Rep 2013; 13: 757-767.
267
268
13. Oral EA, Simha V, Ruiz E et al. Leptin-replacement therapy for lipodystrophy. N Engl J Med 2002;
269
346: 570-578.
270
271
14. Beltrand J, Beregszaszi M, Chevenne D et al. Metabolic correction induced by leptin replacement
272
treatment in young children with Berardinelli-Seip congenital lipoatrophy. Pediatrics 2007; 120: e291-e296.
273
274
15. Lee YH, Magkos F, Mantzoros CS, Kang ES. Effects of leptin and adiponectin on pancreatic beta-cell
275
function. Metabolism 2011; 60: 1664-1672.
276
277
16. Yu X, Park BH, Wang MY, Wang ZV, Unger RH. Making insulin-deficient type 1 diabetic rodents
278
thrive without insulin. Proc Natl Acad Sci U S A 2008; 105: 14070-14075.
279
280
17. Vigouroux C, Magré J, Vantyghem MC et al. Lamin A/C gene: sex-determined expression of mutations
281
in Dunnigan-type familial partial lipodystrophy and absence of coding mutations in congenital and acquired
282
generalized lipoatrophy. Diabetes 2000; 49 : 1958-1962.
283
284
18. Caron M, Auclair M, Donadille B et al. Human lipodystrophies linked to mutations in A-type lamins
285
and to HIV protease inhibitor therapy are both associated with prelamin A accumulation, oxidative stress and
286
premature cellular senescence. Cell Death Differ 2007; 14: 1759-1767.
287
288
19. Garg A, Speckman RA, Bowcock AM. Multisystem dystrophy syndrome due to novel missense
289
mutations in the amino-terminal head and alpha-helical rod domains of the lamin A/C gene. Am J Med 2002;
290
112: 549-55.
291
292
20. Unger RH, Roth MG. A new biology of diabetes revealed by leptin. Cell Metab 2015; 21: 15-20.
293
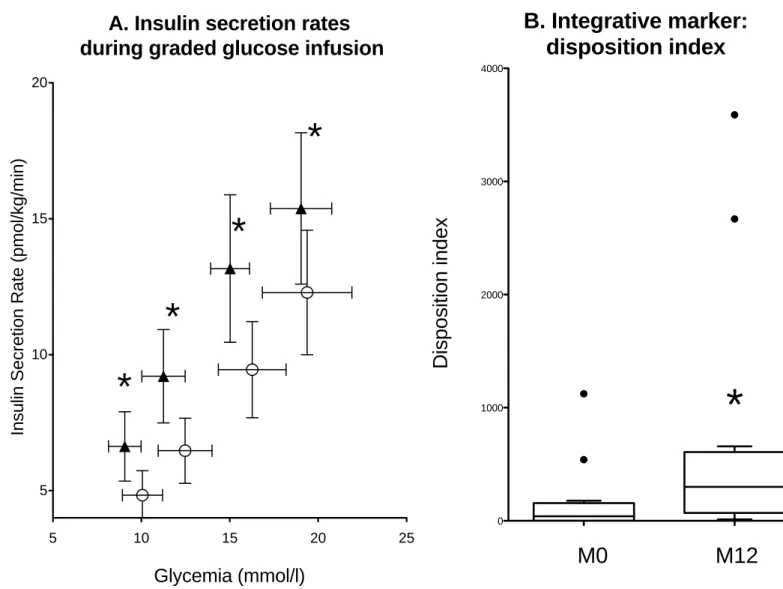
FIGURE 1 LEGEND
Effect of metreleptin therapy on insulin secretion
A. Insulin secretion rates (ISR) during graded glucose infusion were calculated for each of the four glucose infusion steps (of 4, 8, 10 and 12 mg/ kg of body weight of glucose per min) and plotted against the corresponding mean glucose concentration, in patients 5 to 16. Mean values obtained at baseline are represented as empty circles, and those obtained at one year-metreleptin therapy as filled triangles. Whiskers represent SEM. * p<0.05 versus M0
B. Disposition index, indicating the insulin secretion capacity relative to insulin sensitivity, was calculated in the same patients as the product of M value measured during the euglycemic hyperinsulinemic clamp by AIR. Rectangles represent 25th and 75th percentile values, with the median values depicted in-between. Whiskers represent the lowest datum still within 1.5 IQR of the lower quartile, and the highest datum still within 1.5 IQR of the upper quartile (Tukey boxplot).
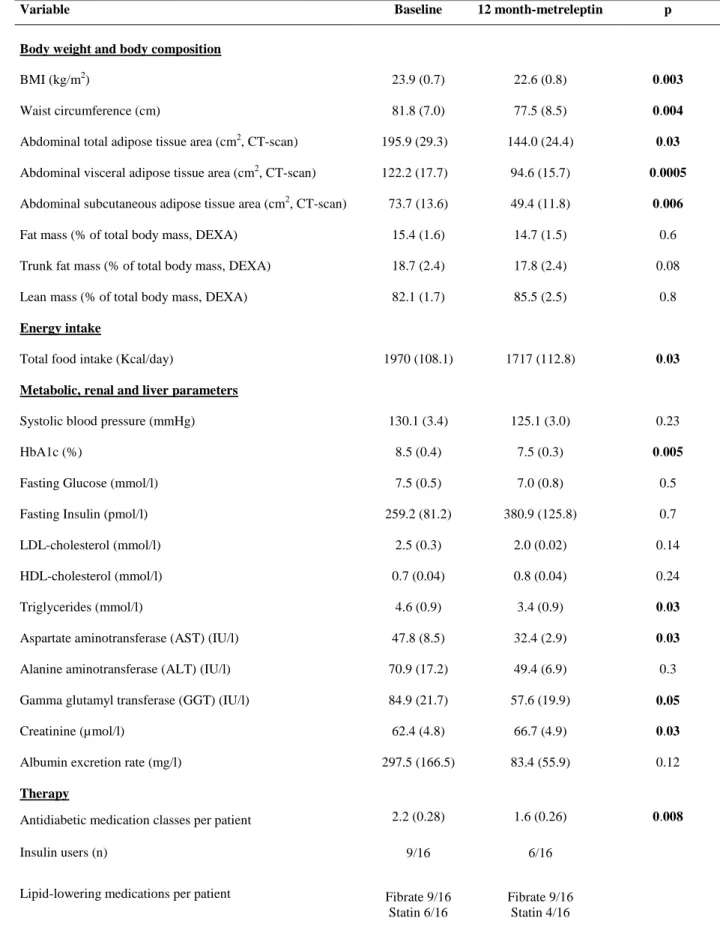
Table 1: Metabolic markers at baseline and after one year of metreleptin treatment in the sixteen studied patients
Variable Baseline 12 month-metreleptin p
Body weight and body composition
BMI (kg/m2)
Waist circumference (cm)
Abdominal total adipose tissue area (cm2, CT-scan) Abdominal visceral adipose tissue area (cm2, CT-scan) Abdominal subcutaneous adipose tissue area (cm2, CT-scan) Fat mass (% of total body mass, DEXA)
Trunk fat mass (% of total body mass, DEXA) Lean mass (% of total body mass, DEXA)
Energy intake
Total food intake (Kcal/day)
Metabolic, renal and liver parameters
Systolic blood pressure (mmHg) HbA1c (%)
Fasting Glucose (mmol/l) Fasting Insulin (pmol/l) LDL-cholesterol (mmol/l) HDL-cholesterol (mmol/l) Triglycerides (mmol/l)
Aspartate aminotransferase (AST) (IU/l) Alanine aminotransferase (ALT) (IU/l) Gamma glutamyl transferase (GGT) (IU/l) Creatinine (µmol/l)
Albumin excretion rate (mg/l)
23.9 (0.7) 81.8 (7.0) 195.9 (29.3) 122.2 (17.7) 73.7 (13.6) 15.4 (1.6) 18.7 (2.4) 82.1 (1.7) 1970 (108.1) 130.1 (3.4) 8.5 (0.4) 7.5 (0.5) 259.2 (81.2) 2.5 (0.3) 0.7 (0.04) 4.6 (0.9) 47.8 (8.5) 70.9 (17.2) 84.9 (21.7) 62.4 (4.8) 297.5 (166.5) 22.6 (0.8) 77.5 (8.5) 144.0 (24.4) 94.6 (15.7) 49.4 (11.8) 14.7 (1.5) 17.8 (2.4) 85.5 (2.5) 1717 (112.8) 125.1 (3.0) 7.5 (0.3) 7.0 (0.8) 380.9 (125.8) 2.0 (0.02) 0.8 (0.04) 3.4 (0.9) 32.4 (2.9) 49.4 (6.9) 57.6 (19.9) 66.7 (4.9) 83.4 (55.9) 0.003 0.004 0.03 0.0005 0.006 0.6 0.08 0.8 0.03 0.23 0.005 0.5 0.7 0.14 0.24 0.03 0.03 0.3 0.05 0.03 0.12 Therapy
Antidiabetic medication classes per patient 2.2 (0.28) 1.6 (0.26) 0.008 Insulin users (n) 9/16 6/16
Lipid-lowering medications per patient Fibrate 9/16 Statin 6/16
Fibrate 9/16 Statin 4/16
Values are expressed as mean (SEM). p values are depicted in bold when considered significant (p < 0.05).
Total, visceral and subcutaneous abdominal adipose tissue areas were evaluated form 1cm-reconstructed CT-scan slices at the L4 level. DEXA: dual energy x-ray absorptiometry
Figure 1: Effect of metreleptin therapy on insulin secretion
Baseline (M0)
After one-year metreleptin therapy (M12)
A. Insulin secretion rates
during graded glucose infusion
5 10 15 20 25 5 10 15 20
*
*
*
*
Glycemia (mmol/l)
In
s
u
lin
S
e
c
re
ti
o
n
R
a
te
(
p
m
o
l/
k
g
/m
in
)
0 1000 2000 3000 4000B. Integrative marker:
disposition index
M0 M12
D
is
p
o
s
it
io
n
i
n
d
e
x
*
Additional Supporting Information
File S1. Supplemental methods and references
Methods
Biochemical analyses
HbA1c was measured using high performance liquid chromatography and plasma insulin using a immuno-radiometric assay (BI-INSULIN IRMA, Cis Bio-International, Gif-Sur-Yvette, France).
The values of LDL-cholesterol were determined from total cholesterol, triglycerides and HDL-cholesterol levels using the Friedewald formula (LDL-cholesterol = total cholesterol minus HDL-cholesterol minus triglycerides (mg/dl) /5), when triglycerides levels were below 400 mg/dl (n=9 patients).
Evaluation of body composition
Total fat and lean masses, and body fat segmental distribution, were measured by dual energy x-ray absorptiometry (DEXA), and abdominal subcutaneous and visceral adipose tissue surfaces (SAT and VAT) were calculated from 1 cm-reconstructed CT-scan slices at the L4 level as previously described [1].
Caloric and macronutrient intakes were evaluated by three-day food records performed at M0 and M12.
Metabolic investigations
Metabolic investigations were performed after a 12h-overnight fast at M0 and M12. When fasting glycemia was above 7 mmol/l, a 2h-insulin infusion was performed before the investigations. Intravenous glucose tolerance tests (IVGTT, n=16), hyperglycemic and euglycemic hyperinsulinemic clamps (n= 4 and 12, respectively), and graded glucose infusion tests (glucose ramping, n=12) were performed as previously described [2-6].
Acute insulin response to an intravenous bolus of glucose (AIR) (n=16 patients)
In all patients, a solution of 20% glucose of [weight (kg) x (200 – fasting glycemia (mg/dl)) x 1.5] / 200 ml was given within 30 seconds intravenously and measurements of plasma glucose and insulin were performed at -5, 0, 2, 4, 6, 8 and 10 min. AIR was defined as the incremental area under the curve of plasma insulin concentration above baseline between 2 and 10 min after intravenous glucose administration according to the trapezoid method. Baseline insulin (InsB) was the mean insulin level between -5 and 0min [(Ins-5min+Ins0min)/2]. AIR=
[(IT0min+ IT2min)/2 – IT0min] +[( IT2min + IT4min)/2 – IT0min]+ [(IT4min + IT6min)/2 – IT0min]+ [(IT6min +
IT8min)/2 – IT0min]+ [(IT8min + IT10min)/2 – IT0min] and expressed as pmol/kg/min.
Hyperglycemic clamp (patients 1 to 4)
Following the intravenous bolus of glucose for the AIR determination, we maintained plasma glucose at 200 mg/dl for 180 min by infusing 20% glucose at varying rates according to blood glucose measurements reformed at 5min-intervals. Blood samples were collected at 160th, 170th and 180th min for the measurement of plasma insulin and C peptide concentrations. We calculated the glucose disposal rate from the glucose infusion rate during the last 20 min of the hyperglycemic plateau after accounting for inter-individual differences in glucose space [3] (in mg/kg body fat-free mass/min). Glucose space correction was calculated as (G2-G1) x 0.095 with G2 and G1 being the glucose concentrations in mg/dl at the end and at the beginning of each 5-min period during the last 20 min of the clamp. The ratio of the glucose disposal rate to insulin concentration at the 200 mg/dl-hyperglycemic plateau (M/I) was used as an estimate of insulin sensitivity.
Euglycemic hyperinsulinemic clamp (patients 5 to 16)
The insulin-stimulated glucose disposal rate (M-value) was measured during a 100 min-step of 80 mU/m2/min insulin infusion, while blood glucose was clamped at 100 mg/dl using variable infusion of 20% glucose. Blood samples were collected before the clamp and every 10 min during the last 20 min, for the measurement of plasma glucose and insulin. The M-value was calculated according to DeFronzo et al. [3], after accounting for inter-individual differences in glucose space, and was expressed in mg/kg of fat-free mass/min, using the formula described above. We also calculated the M/I ratio, which adjusted the M-value to the mean insulin concentration during the last 20 min of the test.
Glucose ramping (graded glucose infusion test) (patients 5 to 16)
This test consisted of four consecutive 40-min intravenous infusion of 4, 8, 10 and 12 mg/kg/min of glucose as previously described [2,4]. Blood samples were collected every 10 minutes during the whole procedure (200 min). The insulin secretion rates (ISR), which evaluate the beta-cell sensitivity to glucose, were assessed from the changes in C-peptide concentrations and the pre-hepatic insulin secretion rate for each of the four glucose infusion steps. ISR was derived by deconvolution, assuming a two-compartmental model of C-peptide clearance kinetic, using the ISEC software version 3.4a designed by Hovorka R et al (see [5] for more details). Mean ISR for each glucose infusion step was adjusted to fat-free mass and plotted against the
corresponding mean glucose concentration, thereby establishing a dose-response relationship between plasma glucose and insulin secretion rate for each patient.
The disposition index (patients 5 to 16) was calculated as the product of AIR by M-value measured during euglycemic hyperinsulinemic clamps [6].
Statistical analyses
Statistical analyses were performed using GraphPad PRISM (GraphPad Software, Inc, CA, USA) and Statview (SAS Institute Inc., CA, Austria) statistical softwares. We used the Fisher exact test to compare categorical variables and the non-parametric Mann Whitney U test. Analysis of variance (ANOVA) and Wilcoxon rank-sum test for quantitative variables were performed for comparisons over time. The relationship between ISR and glucose levels during glucose ramp was analyzed using mixed model analysis of covariance. Correlations of different measures of glucose metabolism with body composition or age were evaluated using Spearman’s rank correlation test or linear regression analysis. P values <0.05 were considered significant.
References
1. Boufassa F, Goujard C, Viard JP et al. Immune deficiency could be an early risk factor for altered insulin sensitivity in antiretroviral-naive HIV-1-infected patients: the ANRS COPANA cohort. Antivir Ther 2012; 17: 91-100.
2. Gautier JF, Wilson C, Weyer C et al. Low acute insulin secretory responses in adult offspring of people with early onset type 2 diabetes. Diabetes 2001; 50: 1828-1833.
3. DeFronzo RA, Tobin JD, Andres R. Glucose clamp technique: a method for quantifying insulin secretion and resistance. Am J Physiol 1979; 237: E214-E223.
4. Sobngwi E, Boudou P, Mauvais-Jarvis F et al. Effect of a diabetic environment in utero on predisposition to type 2 diabetes. Lancet 2003; 361: 1861-1865.
5. Hovorka R, Soons PA, Young MA. ISEC: a program to calculate insulin secretion. Comput Methods Programs Biomed 1996; 50: 253-264.
6. Kahn SE, Prigeon RL, McCulloch DK et al. Quantification of the relationship between insulin sensitivity and beta-cell function in human subjects. Evidence for a hyperbolic function. Diabetes 1993; 42: 1663-1672.
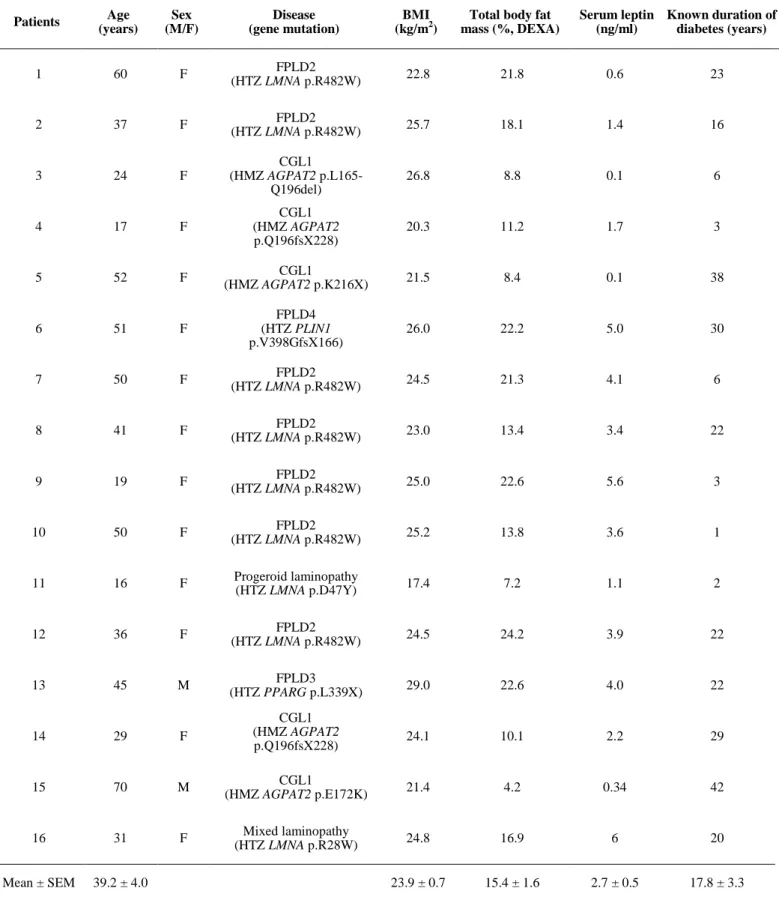
Table S1: Baseline characteristics of the sixteen studied patients Patients Age (years) Sex (M/F) Disease (gene mutation) BMI (kg/m2)
Total body fat mass (%, DEXA) Serum leptin (ng/ml) Known duration of diabetes (years) 1 60 F FPLD2 (HTZ LMNA p.R482W) 22.8 21.8 0.6 23 2 37 F FPLD2 (HTZ LMNA p.R482W) 25.7 18.1 1.4 16 3 24 F CGL1 (HMZ AGPAT2 p.L165-Q196del) 26.8 8.8 0.1 6 4 17 F CGL1 (HMZ AGPAT2 p.Q196fsX228) 20.3 11.2 1.7 3 5 52 F CGL1 (HMZ AGPAT2 p.K216X) 21.5 8.4 0.1 38 6 51 F FPLD4 (HTZ PLIN1 p.V398GfsX166) 26.0 22.2 5.0 30 7 50 F FPLD2 (HTZ LMNA p.R482W) 24.5 21.3 4.1 6 8 41 F FPLD2 (HTZ LMNA p.R482W) 23.0 13.4 3.4 22 9 19 F FPLD2 (HTZ LMNA p.R482W) 25.0 22.6 5.6 3 10 50 F FPLD2 (HTZ LMNA p.R482W) 25.2 13.8 3.6 1 11 16 F Progeroid laminopathy (HTZ LMNA p.D47Y) 17.4 7.2 1.1 2 12 36 F FPLD2 (HTZ LMNA p.R482W) 24.5 24.2 3.9 22 13 45 M FPLD3 (HTZ PPARG p.L339X) 29.0 22.6 4.0 22 14 29 F CGL1 (HMZ AGPAT2 p.Q196fsX228) 24.1 10.1 2.2 29 15 70 M CGL1 (HMZ AGPAT2 p.E172K) 21.4 4.2 0.34 42 16 31 F Mixed laminopathy (HTZ LMNA p.R28W) 24.8 16.9 6 20 Mean ± SEM 39.2 ± 4.0 23.9 ± 0.7 15.4 ± 1.6 2.7 ± 0.5 17.8 ± 3.3
FPLD: Familial Partial Lipodystrophy; CGL: Congenital Generalized Lipoatrophy; AGL: Acquired Generalized Lipoatrophy; HTZ: heterozygous; HMZ: homozygous; DEXA: dual energy x-ray absorptiometry
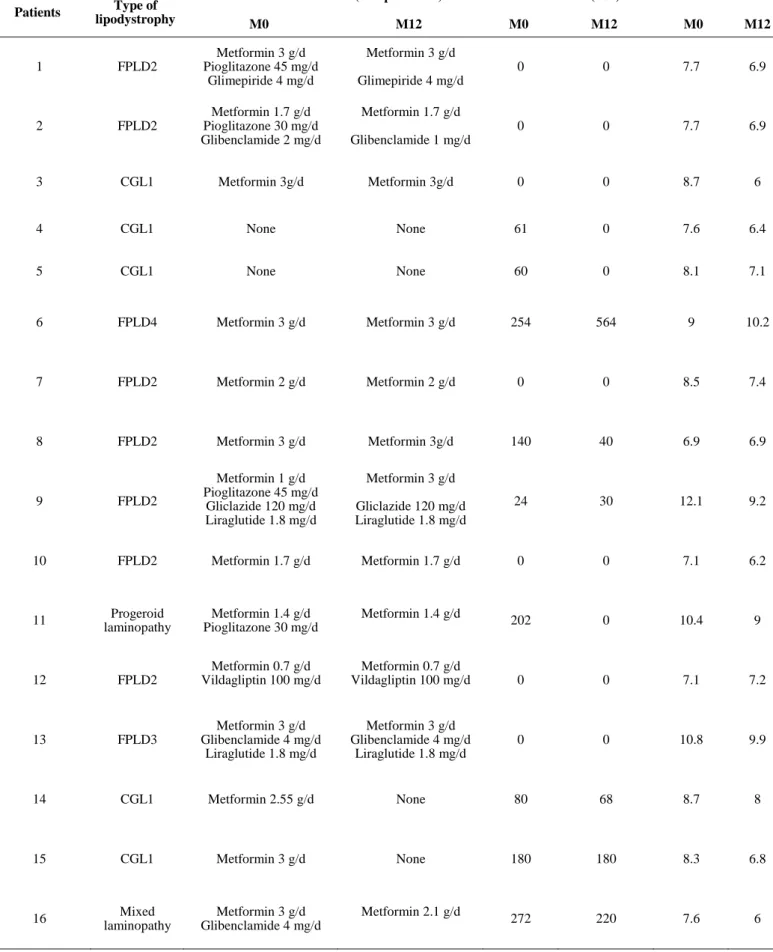
Table S2: Use of antidiabetic medications during metreleptin therapy
Patients Type of lipodystrophy
Antidiabetic treatment (except insulin) Insulin doses (U/d) HbA1c
M0 M12 M0 M12 M0 M12 1 FPLD2 Metformin 3 g/d Pioglitazone 45 mg/d Glimepiride 4 mg/d Metformin 3 g/d Glimepiride 4 mg/d 0 0 7.7 6.9 2 FPLD2 Metformin 1.7 g/d Pioglitazone 30 mg/d Glibenclamide 2 mg/d Metformin 1.7 g/d Glibenclamide 1 mg/d 0 0 7.7 6.9 3 CGL1 Metformin 3g/d Metformin 3g/d 0 0 8.7 6 4 CGL1 None None 61 0 7.6 6.4 5 CGL1 None None 60 0 8.1 7.1 6 FPLD4 Metformin 3 g/d Metformin 3 g/d 254 564 9 10.2 7 FPLD2 Metformin 2 g/d Metformin 2 g/d 0 0 8.5 7.4 8 FPLD2 Metformin 3 g/d Metformin 3g/d 140 40 6.9 6.9 9 FPLD2 Metformin 1 g/d Pioglitazone 45 mg/d Gliclazide 120 mg/d Liraglutide 1.8 mg/d Metformin 3 g/d Gliclazide 120 mg/d Liraglutide 1.8 mg/d 24 30 12.1 9.2 10 FPLD2 Metformin 1.7 g/d Metformin 1.7 g/d 0 0 7.1 6.2 11 Progeroid laminopathy Metformin 1.4 g/d Pioglitazone 30 mg/d Metformin 1.4 g/d 202 0 10.4 9 12 FPLD2 Metformin 0.7 g/d Vildagliptin 100 mg/d Metformin 0.7 g/d Vildagliptin 100 mg/d 0 0 7.1 7.2 13 FPLD3 Metformin 3 g/d Glibenclamide 4 mg/d Liraglutide 1.8 mg/d Metformin 3 g/d Glibenclamide 4 mg/d Liraglutide 1.8 mg/d 0 0 10.8 9.9 14 CGL1 Metformin 2.55 g/d None 80 68 8.7 8 15 CGL1 Metformin 3 g/d None 180 180 8.3 6.8 16 Mixed laminopathy Metformin 3 g/d Glibenclamide 4 mg/d Metformin 2.1 g/d 272 220 7.6 6
Figure S1 : Longitudinal effects of metreleptin therapy in the 16 patients
D.
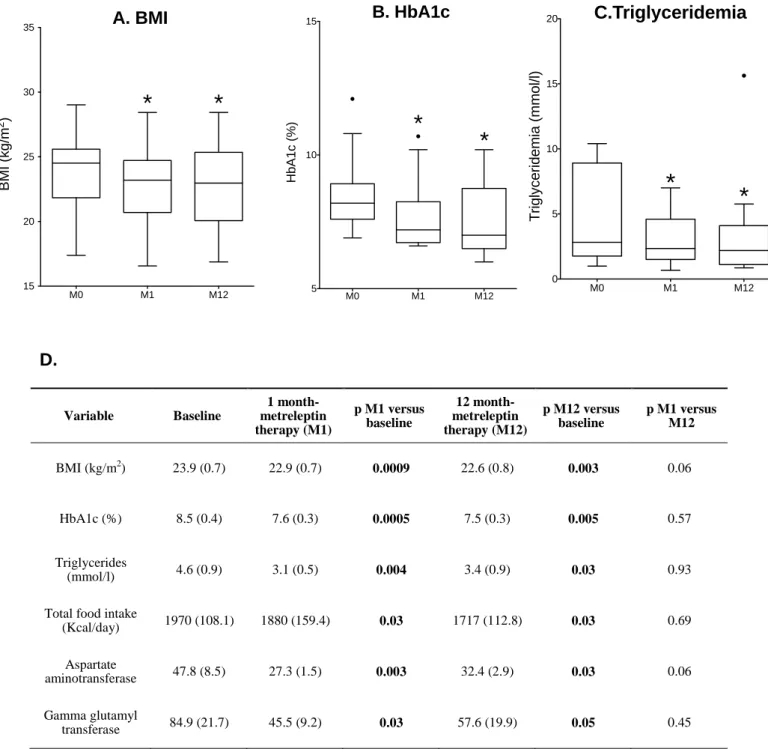
Variable Baseline 1 month-metreleptin therapy (M1) p M1 versus baseline 12 month-metreleptin therapy (M12) p M12 versus baseline p M1 versus M12 BMI (kg/m2) 23.9 (0.7) 22.9 (0.7) 0.0009 22.6 (0.8) 0.003 0.06 HbA1c (%) 8.5 (0.4) 7.6 (0.3) 0.0005 7.5 (0.3) 0.005 0.57 Triglycerides (mmol/l) 4.6 (0.9) 3.1 (0.5) 0.004 3.4 (0.9) 0.03 0.93 Total food intake(Kcal/day) 1970 (108.1) 1880 (159.4) 0.03 1717 (112.8) 0.03 0.69 Aspartate aminotransferase 47.8 (8.5) 27.3 (1.5) 0.003 32.4 (2.9) 0.03 0.06 Gamma glutamyl transferase 84.9 (21.7) 45.5 (9.2) 0.03 57.6 (19.9) 0.05 0.45
A. BMI
M0 M1 M12 15 20 25 30 35*
*
B M I (k g /m 2)B. HbA1c
M0 M1 M12 5 10 15*
*
H b A 1 c ( % )C.Triglyceridemia
M0 M1 M12 0 5 10 15 20*
*
T ri g ly c e ri d e m ia ( m m o l/ l) Supplementary Figure 1 DFigure S2
Effect of metreleptin on insulin secretion in patients with LMNA mutations
A. Insulin secretion rates
during graded glucose
infusion
5 10 15 20 25 0 5 10 15 20 25GLYCEMIA (mmol/l)
In
s
u
lin
S
e
c
re
ti
o
n
R
a
te
(
p
m
o
l/
k
g
/m
in
)
B. Integrative marker:
disposition index
0 1000 2000 3000 4000M0 M12
D
is
p
o
s
it
io
n
i
n
d
e
x
*
*
Baseline (M0)
Table S3
Insulin secretion and insulin sensitivity indexes before and one year after metreleptin therapy
3 A. intravenous glucose tolerance test (IVGTT) followed by hyperglycemic clamps
Patients Type of lipodystrophy
Acute Insulin Response (pmol/kg/min)
M-value/Insulinemia
(mg/kg of fat free mass/min/pmol/l) AIR x M/I
M0 M12 M0 M12 M0 M12
1 FPLD2 182.7 208 0.033 0.058 6.03 12.06
2 FPLD2 31.3 50 0.184 0.125 5.76 6.25
3 CGL1 80.1 532 0.035 0.061 2.80 32.45
4 CGL1 99 81.5 0.037 0.065 3.66 6.43
3 B. Euglycemic hyperinsulinemic clamps and intravenous glucose tolerance test (IVGTT) followed by a glucose ramping
Patients lipodystrophy Type of Acute Insulin Response (pmol/kg/min)
M-value
(mg/kg of fat free mass/min) Disposition index (AIR x M-value)
M0 M12 M0 M12 M0 M12 5 CGL1 5 79.6 6.43 8.28 32.2 658.5 6 FPLD4 10 56.2 0 0.33 0 18.5 7 FPLD2 25.2 29.6 6.96 10.05 175.4 297.5 8 FPLD2 124.2 37.5 0 2.74 0 102.7 9 FPLD2 25.9 46.3 1.82 9.60 47.1 444.1 10 FPLD2 43 385.6 2.12 9.30 91.1 3586.0 11 Progeroid laminopathy 426.4 27.8 0.05 2.05 21.8 57.0 12 FPLD2 155.8 222 7.21 12.03 1123.4 2670.7 13 FPLD3 9.7 15.7 0 0.77 0 12.1 14 CGL1 179.6 97 3.01 3.96 540.6 384.1 15 CGL1 24.2 44.1 3.02 3.96 73.1 174.6 16 Mixed laminopathy 1.0 148 1.99 2.15 1.99 318.2
Supplementary Figure legends
Figure S1
Longitudinal effects of metreleptin therapy in the 16 patients
Values of BMI (A), HbA1c (B) and serum triglycerides (C) are depicted as rectangles which represent 25th and 75th percentile values, with the median values depicted in-between. Whiskers represent the lowest datum still within 1.5 IQR of the lower quartile, and the highest datum still within 1.5 IQR of the upper quartile (Tukey boxplot). M: months after the onset of metreleptin therapy. *: p<0.05 versus M0
Data expressed as mean (SEM) with statistical analyses are presented in (D).
Figure S2
Effect of metreleptin on insulin secretion in patients with LMNA mutations
A. Insulin secretion rates (ISR) during graded glucose infusion were derived by deconvolution as described, for each of the four glucose infusion steps (of 4, 8, 10 and 12 mg per kg of body weight of glucose per min), in 7 patients (patients 7 to 12 and patient 16). ISR expressed in pmol/kg of fat-free mass/min, were plotted against the corresponding mean glucose concentration. Mean values obtained at baseline are represented as empty circles, and those obtained at one year-metreleptin therapy as filled triangles. Whiskers represent SEM.
B. Disposition index, indicating the insulin secretion capacity relative to insulin sensitivity, was calculated in the same patients as the product of M value measured during the euglycemic hyperinsulinemic clamp by AIR. Rectangles represent 25th and 75th percentile values, with the median values depicted in-between. Whiskers represent the lowest datum still within 1.5 IQR of the lower quartile, and the highest datum still within 1.5 IQR of the upper quartile (Tukey boxplot).