Publisher’s version / Version de l'éditeur:
Journal of Thermal Analysis and Calorimetry, 78, 1, pp. 125-133, 2004-09-01
READ THESE TERMS AND CONDITIONS CAREFULLY BEFORE USING THIS WEBSITE.
https://nrc-publications.canada.ca/eng/copyright
Vous avez des questions? Nous pouvons vous aider. Pour communiquer directement avec un auteur, consultez la
première page de la revue dans laquelle son article a été publié afin de trouver ses coordonnées. Si vous n’arrivez pas à les repérer, communiquez avec nous à PublicationsArchive-ArchivesPublications@nrc-cnrc.gc.ca.
Questions? Contact the NRC Publications Archive team at
PublicationsArchive-ArchivesPublications@nrc-cnrc.gc.ca. If you wish to email the authors directly, please see the first page of the publication for their contact information.
Archives des publications du CNRC
This publication could be one of several versions: author’s original, accepted manuscript or the publisher’s version. / La version de cette publication peut être l’une des suivantes : la version prépublication de l’auteur, la version acceptée du manuscrit ou la version de l’éditeur.
For the publisher’s version, please access the DOI link below./ Pour consulter la version de l’éditeur, utilisez le lien DOI ci-dessous.
https://doi.org/10.1023/B:JTAN.0000042160.82063.c4
Access and use of this website and the material on it are subject to the Terms and Conditions set forth at
TG, DTA, FTIR and raman spectral analysis of Zna/Mgb ammonium sulfate mixed crystals
Madhurambal, G.; Mojumdar, S. C.; Hariharan, S.; Ramasamy, P.
https://publications-cnrc.canada.ca/fra/droits
L’accès à ce site Web et l’utilisation de son contenu sont assujettis aux conditions présentées dans le site LISEZ CES CONDITIONS ATTENTIVEMENT AVANT D’UTILISER CE SITE WEB.
NRC Publications Record / Notice d'Archives des publications de CNRC: https://nrc-publications.canada.ca/eng/view/object/?id=78277f8e-577c-4dfe-924c-3182e7a8215a https://publications-cnrc.canada.ca/fra/voir/objet/?id=78277f8e-577c-4dfe-924c-3182e7a8215a
TG, DTA, FTIR and Raman spectral analysis of Zna/Mgb ammonium sulfate mixed crystals
Madhurambal, G.; Mojumdar, S.C.;Hariharan, S.; Ramasamy, P.
NRCC-47320
A version of this document is published in / Une version de ce document se trouve dans : Journal of Thermal Analysis and Calorimetry, v. 78, no. 1, Sept. 2004,
pp. 125-133 doi:10.1023/B:JTAN.0000042160.82063.c4
T
T
G
G
,
,
D
D
T
T
A
A
,
,
A
A
N
N
D
D
F
F
T
T
I
I
R
R
A
A
N
N
D
D
R
R
A
A
M
M
A
A
N
N
S
S
P
P
E
E
C
C
T
T
R
R
A
A
L
L
A
A
N
N
A
A
L
L
Y
Y
S
S
I
I
S
S
O
O
F
F
Zn
a/Mg
bA
A
M
M
M
M
O
O
N
N
I
I
U
U
M
M
S
S
U
U
L
L
F
F
A
A
T
T
E
E
M
M
I
I
X
X
E
E
D
D
C
C
R
R
Y
Y
S
S
T
T
A
A
L
L
S
S
G.Madhurambal1, S. C. Mojumdar2*, S. Hariharan3 and P. Ramasamy4
1
A.D.M. College for Women, Nagapattinam – 611001, Tamilnadu, India 2
Institute for Research in Construction, National Research Council of Canada, M-20, 1200 Montreal Road, Ottawa, Ontario K1A 0R6, Canada, E-Mail: Subhash.Mojumdar@nrc-cnrc.gc.ca, scmojumdar@hotmail.com
3
Govt – College for Men, Thiruppur – 612001, Tamilnadu, India 4
Crystal Growth Center, Anna University, Chennai – 600025, Tamilnadu, India
Abstract
To understand the structural and thermal properties of the mixed crystals, thermogravimetric (TG) and differential thermal analysis (DTA), and FTIR and Raman spectral studies were carried out for the mixed crystals of Zna/Mgb ammonium sulfate of composition namely ‘a’ (fraction by weight of salt Zn[NH4]2[SO4]2.6H2O to the total salt (both Zn[NH4]2[SO4]2.6H2O, Mg[NH4]2[SO4]2.6H2O or it can be explained as ZnaMgb[NH4]2[SO4]2.6H2O, a + b =1), and a = 0.1, 0.25, 0.333, 0.5, 0.666, 0.75 and 0.9 grown by a solution technique. From the correlation and analysis of the results obtained for the various crystals, the desolvation, decomposition, crystalline transition phenomena were identified. By close comparison of the endotherms, obtained for the various crystals, it was found that isomorphous substitution takes place in the crystals. Up to 0.5, Zn2+ ion replaces isomorphous Mg2+ ions in the lattice sites of Mg[NH4]2[SO4]2.6H2O and above 0.5, Mg2+ ions occupies the Zn2+ ion in the lattice sites of Zn[NH4]2[SO4]2.6H2O. Both crystals belong to monoclinic system with P 2(1)/a symmetry. The vibrations of NH4+ ion, SO42- ion, the complex [Mg(OH2)6]2+ the complex [Zn(OH2)6]2+ and the
three different water molecules are identified. The linear distortion of SO42- ion is found to be greater than its angular distortion, while the NH4+ ion has suffered more angular distortion. The possibility of free rotation of the NH4+ ion is ruled out.
Keywords: TG, DTA, Zna/Mgb ammonium sulfate mixed crystals, FTIR and Raman spectra * Author for correspondence
Introduction
Thermogravimetric (TG) and differential thermal analysis (DTA) as well as FTIR and Raman spectral analysis have been applied to investigate the physical and chemical properties such as structure, crystalline transition, second order transition, fusion, vaporization, sublimation, absorption, adsorption, desorption, decomposition, oxidation, degradation and solid state reactions of the studied compounds. The cubic mineral longbeinite, K2Mg2(SO4)3 and its isomorphous A+1 B2+ (SO4)3 where A+1 = K, Rb, Cs, Ti, NH4 and B2+ = Mg, Ca, Zn, Cd, Mn, Fe, Co and Ni. In the above series of compounds, the ferroelectricity was observed only for (NH4)2Cd2(SO4)2 [1-5].
The reveal of the relationship between the structure and thermolysis of metal complexes, the study of the influence of metal and ligand nature upon the process of thermal decomposition is of the interests [6–13]. It is not surprising therefore, that many authors have investigated the nature of metal and ligand bonds by examination of their thermal and spectral properties [14-17]. In our previous papers, we described the thermoanalytical properties of Mg(II), Cu(II), Ni(II), Co(II) and Fe(III) complexes with pyridine and its derivatives [18–30]. Little information is known about the Zn/Mg ammonium sulfate, mixed crystals. Therefore, this paper describes the preparation and structural deformation arising due to the formation of mixed crystals of Zn/Mg ammonium sulfate in varying proportions based on their thermoanalytical (TG and DTA) and spectral (FTIR and Raman) properties.
Experimental
Synthesis of the compounds
The double salts Zn[NH4]2[SO4]2.6H2O and Mg[NH4]2[SO4]2.6H2O were synthesized and their purities were checked by standard methods of analysis. As the growth process is slow, the atoms or the constituent particles take definite position during growth. The mixed crystals of ‘a’ (fraction by weight of salt Zn[NH4]2[SO4]2.6H2O to the total salt (both Zn[NH4]2[SO4]2.6H2O and Mg[NH4]2[SO4]2.6H2O) values 0.1, 0.25, 0.333, 0.5, 0.666, 0.75 and 0.9 were grown by slow evaporation through ‘solution’ technique by mixing suitable amounts of zinc ammonium sulfate and magnesium ammonium sulfate for the desired ‘a’ values. The concentrations used for the crystal growth were 2.0-3.0 x 10⁻² M.
Measurements
Thermal Analysis was carried out using a STANTON Red Craft STA 1500. Simultaneous thermal analysis series were designed to give TG and DTA data simultaneously. The Simultaneous Unit eliminates the problem of correlating TG and DTA data for the same materials and is more superior to the individual technique.
The FTIR spectrum has been recorded on a Perkin Elmer 283 Spectrophotometer using KBr pellet technique.
Results and discussion
Thermal analysis
The Results of TG analysis is presented in the Table 1. The TG and DTA curves of the compounds
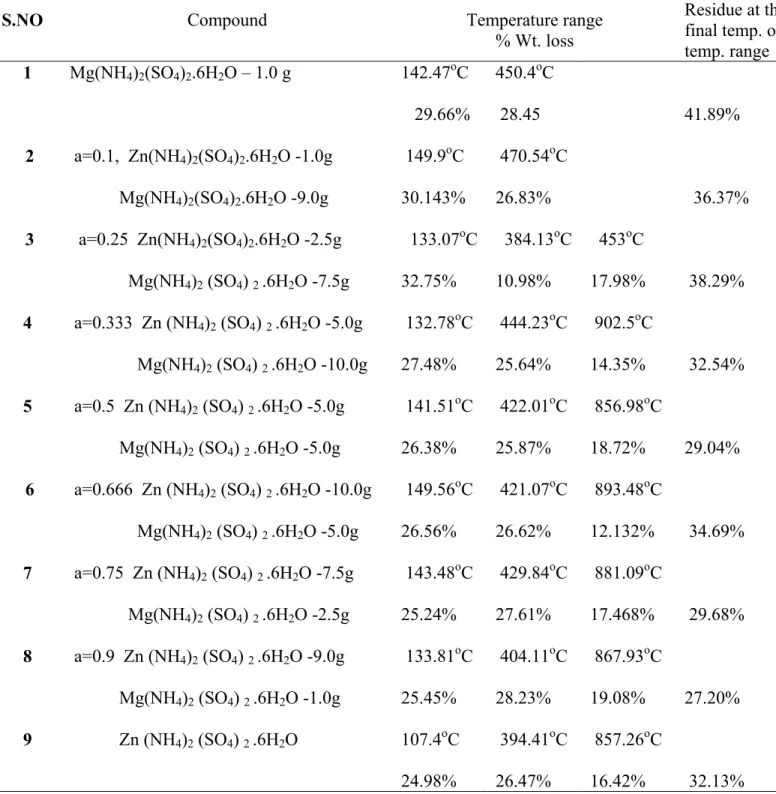
For all the compounds, the analysis of thermograms reveal that the loss of weight in the temperature range of 133 oC -150 oC correspond to the elimination of water of hydration equivalent to 6H2O molecules. A plateau in TG curves and endothermic peaks in DTA at the temperature 384 oC may be due to the phase transition up to ‘a’ value 0.25. The inflection occurring between 432 oC- 469 oC with a weight loss of 24% corresponds to the evolution of SO2 + ½ O2 [31, 32]
Above the temperature 469 oC, the compound MgO.(NH4)2SO4 is formed. In the case of (NH4)2(SO4)2.6H2O, additional inflection occurs in the loss of ammonia molecules which is different from that of Mg salt. The slight variation in the percentage may be attributed to the isomorpous substitution.
In the temperature range 133 oC – 150 oC, 3 inflections correspond to the following reactions:
ZnaMgb(NH4)2(SO4)2 .6H2O ZnaMgb(NH4)2(SO4)2.4H2O
ZnaMgb(NH4)2(SO4)2.4H2O ZnaMgb(NH4)2(SO4)2.H2O
ZnaMgb(NH4)2(SO4)2. H2O ZnaMgb(NH4)2(SO4)2
In the temperature range 384 oC – 395 oC crystalline transition may take place due to the internal structural change.
At 478 oC following decomposition reaction took place.
ZnaMgb(NH4)2(SO4)2 ZnaMgbO.(NH4)2SO4 +SO2 + 1/2 O2 [31, 32].
By comparison of the TG and DTA curves for the mixed crystals with that of the pure samples, it was understood that similar nature of curve occurs up to a = 0.5 and the decrease in inflection shows that isomorphism substitution of zinc ion takes place in the Mg(NH4)2(SO4)2.6H2O crystals. Above a = 0.5,
the curve may be compared with that of Zn(NH4)2(SO4)2.6H2O and this gives an idea that, Mg ion occupies the lattice sites of Zn ion.
FTIR spectral analysis
Internal modes of NH4+ and SO42- ions: The normal modes of vibration of a free NH4+ ion under perfect Td symmetry have frequencies of 3033, 1685, 3134 and 1397 cm-1 for γ1(A1), γ2(E), γ3(F2) and γ4(F2) modes, respectively. Of these γ1 and γ2 are active only in Raman while γ3 and γ4 are active both in Raman and FTIR. In the crystal, since the NH4+ ion occupy sites of lower symmetry than that of the free ion, anisotropic crystal fields may remove degeneracy of normal modes and allow inactive modes to become active. The γ1 mode appears around 3015 cm-1 in most of the polarizations. However, its appearance as doubletin αzz, αyz and αxzsettings suggests the effect of correlation field splitting. The γ2(E) mode has appeared as a doublet (which means frequencies 1714 and 1685 cm-1)in all polarizations. The presence of this FTIR inactive mode as a broad brand in FTIR is probably due to strain induced by the crystal fields. The splitting of γ2 in Raman and γ4in both Raman and FTIR spectra suggests that the angular distortion of the NH4+ ion is greater than the linear distortion.
In hydrogen bonded inorganic systems the observation of combinations of bending modes (γ2, γ4) with the internal rotation mode γ6 indicates that the ion is not rotating freely in the crystalline lattice. For a free tetrahedral SO42- ion, the γ1, γ2, γ3 and γ4, modes are expected to have frequencies at 981, 451, 1104 and 613 cm-1, respectively. The splitting of this non-degenerate mode into a doublet (956 and 985cm-1) is indicative of strong interaction between vibrating sulfate ions, a weak bond observed at 980 cm-1 in FTIR is assigned to this mode. The removal of degeneracy of the stretching mode with appreciable shift from the free ion values indicates that the linear distortion is greater than the angular distortion. This finds support from crystal structure data.
Vibrations of [Mg(OH2)6]2+: The Assignments of bands to the vibrations of the complex has been done
based on the fact that the stretching modes will appear at higher frequencies. In FTIR, this mode is also detected at 400 cm-1 the splitting of the γ2(Eg) mode into a doublet is due to sight symmetry effect. Complete removal of degeneracy of the γ5(+2g) mode results in the appearance of a triplet in the region (164 to 2003) cm-1. This indicates distortion of the complex octahedron due to lack of symmetry of neighbours to which water molecules are hydrogen bonded.
Vibrations of [Zn(OH2)6]2+: The Complex unit [M(OH2)6]z+ possesses the centre of symmetry. The appearance of FTIR inactive modes γ1(A1g) and γ2(Eg) and the lifting of degeneracy of γ2(Eg) and γ3(+2g) modes indicates that the complex is distorted considerably. The mode is detected in the ranges 358-338 cm-1 and 233–135 cm -1 are due to the mixed crystals of [Zn/Mg(OH2)6]2+.The lattice modes are represented in the region 100 – 55 cm-1.
Internal Modes of Water: The Unit cell contains four sets of three crystallographically non-equivalent
water molecules. As the O-H…O distance determines the strength of hydrogen bonding, the water molecules H2O(II) and H2O(III) corresponding to mean bond lengths 0.2818, 0.2745 and 0.2738 nm respectively are expected to have different characteristic vibration frequencies. The shift in O-H stretching and bending frequencies are indicative of the strength of hydrogen bonding. In most of the settings, separate bonds for the stretching and bending vibrations of the three different water molecules have been observed.
Librational Modes of Water: The librational modes of water which fall in the range (500 – 900) cm-1 are expected to be weak due to the low polarizabilities. In inorganic salts hydrates having linear hydrogen bonds, the rocking mode will appear at higher frequencies than the wagging modes. The bands have been assigned in the order (γr > γt > γw) (subscripts r, w and t refer to the rocking, wagging and twisting modes of water). They are detected as broad bands only in FTIR spectra. The shift in bands and intensity variations are due to the variations in strength of the different bonds.
External Modes: The external modes of NH4+ ions will fall at higher frequencies than that of the SO42- ions. The bands observed at 327 and 130 cm-1 have been assigned to the librational and translational modes of NH4+ ion, respectively while the bands observed at 93 cm-1 and at 77, 64 and 57 cm-1 have been assigned to the librational and translational modes of the SO42- ion respectively. The Torsional mode of NH4+ ion is observed at 366 cm-1 as expected.
The spectral data from FTIR reveals that there is shift in the frequencies in the mixed crystals of ‘a’ (0.75, 0.5, 0.25) values.
Conclusions
Thermal (TG and DTA) and spectral (FTIR and Raman) studies were carried out for the pure and mixed crystals of composition namely a = 0.1, 0.25, 0.333, 0.5, 0.666, 0.75 and 0.9 grown by solution technique. From the correlation and analysis of the results obtained for the various crystals, the desolvation, decomposition and crystalline transition phenomena were observed. By close comparison of the peaks obtained for the various crystals, it was found that isomorphous substitution takes place in the crystals. The incorporation of Zn salt replaces Mg ion in the lattice sites up to a = 0.5 and above 0.5, Mg ion occupies the lattice sites of Zn ions. All compounds 1 - 9 are hydrated and showed reasonable stability in air. The thermal decomposition of the compounds 1-9 is multistage processes and was initiated by elimination of water. Thermal stability was studied by TG and DTA analysis. The stoichiometry of thermal decomposition can also be influenced by the changes of experimental conditions and origin and preparation history [12, 13]. For the Mixed crystals of ZnaMgb (NH4)2(SO4)2.6H2O up to a = 0.25, the studies have been carried out at the temperature 384 oC for its non-linear optical properties.
The normal modes of vibration of a free NH4+ ion under perfect Tα symmetry have frequencies of 3033, 1685, 3134 and 1397 cm-1 for γ1(A1), γ2(E), γ3(F2) and γ 4(F2) modes, respectively. The Unit cell contains
four sets of three crystallographically non-equivalent water molecules in all crystals. As the O-H…O distance determines the strength of hydrogen bonding, the water molecules H2O(I), H2O(II) and H2O(III) corresponding to mean bond lengths 0.2818, 0.2745 and 0.2738 nm respectively are expected to have different characteristic vibration frequencies. The librational modes of water which fall in the range (500 – 900) cm-1 are expected to be weak due to the low polarizability. In inorganic salts hydrates having linear hydrogen bonds, the rocking mode will appear at higher frequencies than the wagging modes. The bands have been assigned in the order (γr > γt > γw). The shift in bands and intensity variations are due to the variations in strength of the different bonds. The linear distortion of the SO42- ion is greater than its angular distortion. NH4+ ion is not rotating freely and it has suffered more angular than linear distortion.
References
1. R.V. Khamiski, “crystallization from solutions”, consultants Bureau, New York, (1969), p.82
2. R.C. Mackenzie, “Differential Thermal Analysis”, Academic (1970; vol.2, 1972), Press vol.I
3. A. Blazek “Thermal Analysis”, Van Norstrand Reintrol, 1973.
4. J. W. Mellor “A comprehensive treatise on inorganic & Theoretical Chemistry Vol. IV p.335-347, 633-641.
5. A. Eh. Tutton, Phil. Trans, 1 (1916) 216.
6. E. Jóna, M. Kubranová, P. Šimon and J. Mroziñski, J. Thermal Anal., 46 (1996) 1325. 7. Jóna, E., A. Sirota, P. Šimon and M. Kubranová, Thermochim. Acta, 258 (1995) 161. 8. F. Hanic, I. Horváth and G. Plesch, Thermochim. Acta, 145 (1989) 19.
9. J. Skoršepa, K. Györyová and M. Melník, J. Thermal Anal., 44 (1995) 169. 10. E. Jóna, M. Hvastijová and J. Kohout, J. Thermal Anal., 41 (1994) 161.
11. G. D'ascenzo, U. B. Ceipidor, E. Cardarelli, and A. D. Magri, Thermochim. Acta, 13 (1975) 449. 12. T. Šramko, G. Liptay and E. Jóna, J. Thermal Anal., 12 (1977) 217.
13. Y. Masuda, Thermochim. Acta, 39 (1980) 235.
14. L. Mao, S. J. Rettig, R. C. Thompson, J. Trotter and S. Xia, Can. J. Chem., 74 (1996) 433. 15. R. W. Matthews and R. A. Walton, Inorg. Chem., 10 (1971) 1433.
16. A. L. Magri, A. D. Magri, F. Balestrieri, E. Cardarelli, G. D`Ascenzo and A. Panzanelli, Thermochim. Acta, 48 (1981) 253.
17. A. L. Magri and A. D. Magri, Thermochim. Acta, 38 (1980) 225.
19. S. C. Mojumdar, M. Melník and E. Jóna, Polish J. Chem., 73 (1999) 293. 20. S. C. Mojumdar, M. Valko and M. Melník, Chem. Papers, 52 (1998) 650.
21. S. C. Mojumdar, M. Melník, E. Jóna, and D. Hudecová, Chem. Papers, 53 (1999) 265. 22. S. C. Mojumdar, M. Melník and E. Jóna, Chem. Papers, 53 (1999) 309.
23. S. C. Mojumdar, D. Hudecová, M. Melník and E. Jóna, Chem. Papers, 54 (2000) 38. 24. S. C. Mojumdar, M. Melník and E. Jóna, Thermochim. Acta, 352 (2000) 129. 25. S. C. Mojumdar and M. Melník, Chem. Papers, 54 (2000) 1.
26. S. C. Mojumdar, J. Therm. Anal. Cal., 64 (2001) 629.
27. S. C. Mojumdar, M. Melník and E. Jóna, J. Thermal Anal. Cal., 56 (1999) 533.
28. S. C. Mojumdar, I. Ondrejkovicová, L. Nevidanská and M. Melník, J. Anal. Appl. Pyrolysis, 64 (2002) 59.
29. S. C. Mojumdar, K. Lebruškováand D. Valigura, Chem. Papers,74 (2003) 905.
30. E. Jóna, M. Kubranová, S.C. Mojumdar and M. Kopcová, Chem. Papers, 56 (2002) 295.
31. S. Satoshi, C. Contreras, H. Juarez, A. Aguilera and J. Serrato, Int. J. INORG. MATER., 3 (2001) 625-632.
32. S. S. Sueyoshi and C. A. C. Soto, J. Eur. Ceram. Soc. 18 (1998) 1145-1152.
Table 1 TG data of compounds 1-9
S.NO Compound Temperature range
% Wt. loss Residue at the final temp. of temp. range 1 2 3 4 5 6 7 8 9 Mg(NH4)2(SO4)2.6H2O – 1.0 g a=0.1, Zn(NH4)2(SO4)2.6H2O -1.0g Mg(NH4)2(SO4)2.6H2O -9.0g a=0.25 Zn(NH4)2(SO4)2.6H2O -2.5g Mg(NH4)2 (SO4) 2 .6H2O -7.5g a=0.333 Zn (NH4)2 (SO4) 2 .6H2O -5.0g Mg(NH4)2 (SO4) 2 .6H2O -10.0g a=0.5 Zn (NH4)2 (SO4) 2 .6H2O -5.0g Mg(NH4)2 (SO4) 2 .6H2O -5.0g a=0.666 Zn (NH4)2 (SO4) 2 .6H2O -10.0g Mg(NH4)2 (SO4) 2 .6H2O -5.0g a=0.75 Zn (NH4)2 (SO4) 2 .6H2O -7.5g Mg(NH4)2 (SO4) 2 .6H2O -2.5g a=0.9 Zn (NH4)2 (SO4) 2 .6H2O -9.0g Mg(NH4)2 (SO4) 2 .6H2O -1.0g Zn (NH4)2 (SO4) 2 .6H2O 142.47oC 29.66% 149.9oC 30.143% 133.07oC 32.75% 132.78oC 27.48% 141.51oC 26.38% 149.56oC 26.56% 143.48oC 25.24% 133.81oC 25.45% 107.4oC 24.98% 450.4oC 28.45 470.54oC 26.83% 384.13oC 10.98% 444.23oC 25.64% 422.01oC 25.87% 421.07oC 26.62% 429.84oC 27.61% 404.11oC 28.23% 394.41oC 26.47% 453oC 17.98% 902.5oC 14.35% 856.98oC 18.72% 893.48oC 12.132% 881.09oC 17.468% 867.93oC 19.08% 857.26oC 16.42% 41.89% 36.37% 38.29% 32.54% 29.04% 34.69% 29.68% 27.20% 32.13%
Caption to the figures
Fig. 1 TG and DTA curves of Mg(NH4)2(SO4)2.6H2O
Fig. 2 TG and DTA curves of Zn/Mg(NH4)2(SO4)2.6H2O (a=0.1)
Fig. 3 TG and DTA curves of Zn/Mg(NH4)2(SO4)2.6H2O (a=0.25)
Fig. 4 TG and DTA curves of Zn/Mg(NH4)2(SO4)2.6H2O (a=0.333)
Fig. 5 TG and DTA curves of Zn/Mg(NH4)2(SO4)2.6H2O (a=0.50)
Fig. 6 TG and DTA curves of Zn/Mg(NH4)2(SO4)2.6H2O (a=0.66)
Fig. 7 TG and DTA curves of Zn/Mg(NH4)2(SO4)2.6H2O (a=0.75)
Fig. 8 TG and DTA curves of Zn/Mg(NH4)2(SO4)2.6H2O (a=0.9)
Fig. 9 TG and DTA curves of Zn(NH4)2(SO4)2.6H2O