Publisher’s version / Version de l'éditeur:
Applied Optics, 38, 12, pp. 2478-2485, 1999
READ THESE TERMS AND CONDITIONS CAREFULLY BEFORE USING THIS WEBSITE.
https://nrc-publications.canada.ca/eng/copyright
Vous avez des questions? Nous pouvons vous aider. Pour communiquer directement avec un auteur, consultez la première page de la revue dans laquelle son article a été publié afin de trouver ses coordonnées. Si vous n’arrivez pas à les repérer, communiquez avec nous à [email protected].
Questions? Contact the NRC Publications Archive team at
[email protected]. If you wish to email the authors directly, please see the first page of the publication for their contact information.
NRC Publications Archive
Archives des publications du CNRC
This publication could be one of several versions: author’s original, accepted manuscript or the publisher’s version. / La version de cette publication peut être l’une des suivantes : la version prépublication de l’auteur, la version acceptée du manuscrit ou la version de l’éditeur.
For the publisher’s version, please access the DOI link below./ Pour consulter la version de l’éditeur, utilisez le lien DOI ci-dessous.
https://doi.org/10.1364/AO.38.002478
Access and use of this website and the material on it are subject to the Terms and Conditions set forth at
Two-dimensional imaging of soot volume fraction in laminar diffusion
flames
Snelling, David R.; Thomson, Kevin A.; Smallwood, Gregory J.; Gülder,
Ömer L.
https://publications-cnrc.canada.ca/fra/droits
L’accès à ce site Web et l’utilisation de son contenu sont assujettis aux conditions présentées dans le site LISEZ CES CONDITIONS ATTENTIVEMENT AVANT D’UTILISER CE SITE WEB.
NRC Publications Record / Notice d'Archives des publications de CNRC:
https://nrc-publications.canada.ca/eng/view/object/?id=0f702b54-dbf0-4bcd-8a75-da36b47336fe https://publications-cnrc.canada.ca/fra/voir/objet/?id=0f702b54-dbf0-4bcd-8a75-da36b47336feTwo-dimensional imaging of soot
volume fraction in laminar diffusion flames
David R. Snelling, Kevin A. Thomson, Gregory J. Smallwood, and O¨ mer L. Gu¨lder
A technique for acquiring two-dimensional soot-volume-fraction measurements in laminar flames has been demonstrated. The technique provides a map of very low noise concentration over a range of wavelengths~250 –1100 nm!. A noise level of 0.0007 in extinction and a spatial resolution of 30 – 40mm for soot concentration were achieved with an arc lamp source that was filtered to provide greater spatial coherence and a CCD detector. The broadband arc lamp source also allowed us to avoid the added noise resulting from speckle with coherent laser sources. Beam steering, due to refractive-index gradients in the flame, was measured and compared with theoretical predictions. The optical arrangement to min-imize the effect of beam steering is described. As a result the beam steering had no effect on the soot measurements in the flames examined. Flame-transmission maps obtained with this system in an ethyleneyair laminar diffusion flame are presented. Tomographic analysis from use of an Abel inversion of the line-of-sight data to obtain radial profiles of soot concentration is described.
OCIS codes: 120.0120, 120.1740, 110.0110, 110.4280.
1. Introduction
In combustion research, measurements of soot vol-ume fraction are important in studies of soot forma-tion and radiaforma-tion processes and for monitoring postflame particulates.1 Light extinction is a
com-monly used diagnostic technique for measuring soot volume fraction. Although tomographic reconstruc-tion from light extincreconstruc-tion can be used to calculate soot profiles in radially symmetric laminar flames, this technique has the drawback of measuring a line-of-sight average that is not suitable for turbulent flame studies. Elastic scattering of light has been widely investigated for soot measurements, but the fact that the signal is proportional to the square of the particle diameter means that the technique is more useful for particle sizing than volume-fraction measurements. More important, for agglomerated soot particles ~which are definitely not spherical!, it has become increasingly clear in the last few years2,3 that the
approach of applying Mie theory by assuming spher-ical soot particles results in large errors.
Laser-induced incandescence~LII! has emerged as a promising technique for measuring spatially and temporally resolved soot volume fraction in flames.4 –9
In LII the soot is heated by a short-duration laser pulse to produce incandescence. With sufficiently high laser energies, numerical models of the heat transfer indicate that the soot particles reach tem-peratures of 4000 – 4500 K.5,6,10 –12 The resultant
ra-diation, which is blue shifted relative to soot radiation at normal flame temperatures and is of short duration, can readily be detected. LII typi-cally has a temporal resolution of 10 ns and can be used to perform both point measurements and two-dimensional~2-D! planar visualization of soot. Nu-merical modeling of the LII signal indicates that, in appropriate conditions, the signal is approximately proportional to the soot volume fraction. However, LII does not presently provide absolute soot volume fractions and must be calibrated against other tech-niques.
To calibrate LII, and establish that the LII signal is linear with a soot volume fraction across a wide dy-namic range, requires a calibration source whose soot volume fraction is known as accurately as possible. Laminar coflow diffusion flames, which are radially symmetric 2-D flames with good stability, provide such a source. The axial symmetry of these flames permits tomographic techniques to be used to obtain detailed maps of soot concentration. These tech-niques put additional demands on the precision of the line-of-sight data.
When this research was performed, all the authors were with the Combustion Group, Institute for Chemical Process and Environ-mental Technology, National Research Council of Canada, Build-ing M-9, Ottawa, Ontario K1A OR6, Canada. K. A. Thomson is now with the Department of Mechanical Engineering, University of Waterloo, Waterloo, Ontario N2L 3G1, Canada.
Received 8 July 1998; revised manuscript received 14 October 1998.
In addition to LII calibration, accurate soot mea-surements are required for other projects. In fact much of the research on soot formation and oxidation has been conducted with a standard coflow laminar diffusion flame almost identical to the burner that we have used. The dependence of these soot fields on flame temperature, fuel type, and added diluents are an important source of information for understand-ing soot-formation mechanisms.1
Most previous studies of soot have relied on se-quential interrogation of the flame with narrow laser beams to provide spatial resolution.1 Typical
frac-tional noise levels~i.e., the observed sample standard deviation divided by the sample mean! of 0.005 in the transmission measurements have been achieved over the fairly lengthy scans that are necessary to map a flame. This achievement results in signal dynamic ranges of #50:1 for the typical maximum attenuation ~;0.25! found in these flames. In addition, the soot-concentration gradients in these flames are often high and flame movements or spatial reading errors of as little as 50 mm can be significant. Yet most research has been performed with laser beams with a spatial resolution of 1 mm or greater. With these problems in mind we have set out to design and build an optical system that would provide significantly more accurate line-of-sight attenuation 2-D maps of soot concentration in laminar flames. Greenberg and Ku13have described a system that provides for
monochromatic 2-D transmission measurements with noise levels approaching 0.0025 and acquisition rates of 30 Hz. Their system has worked well in mapping reduced-gravity diffusion flames where data-acquisition time is critical,14but has a limited
dynamic range. Our objective was to record images at very low noise levels in order to measure very low soot concentrations. This measurement required a light source that would avoid coherent effects. To achieve a dynamic range of better than 250:1 for a maximum attenuation of 0.25, the design goal was a fractional noise level of,0.001 in the transmission measurements with an image capture time of no more than a few seconds. The target radial spatial resolution was 50mm.
This performance is demonstrated with an arc lamp source that was filtered to provide greater spatial co-herence, and a CCD detector. The arc lamp avoids the spectral coherence of laser sources and allows for a wide range of visible and near-IR wavelengths to be used. With sufficient soot-concentration levels, it is advantageous to perform concentration measurements with IR wavelengths. At these longer wavelengths the assumption that the soot particle radiation inter-action is in the Rayleigh regime is more warranted. In addition, neglect of the scattering contribution to the extinction, which is commonly done in interpreting the results, is better justified at longer wavelengths.
The effect of beam steering in the flame was stud-ied, and the optical arrangement to minimize the effect of this steering on the transmission maps is described. Flame-transmission maps obtained with this system in an ethyleneyair laminar diffusion
flame are presented. Tomographic analysis of the line-of-sight data by use of an Abel inversion tech-nique, to obtain soot radial profiles is described.
2. Flame and Beam Steering
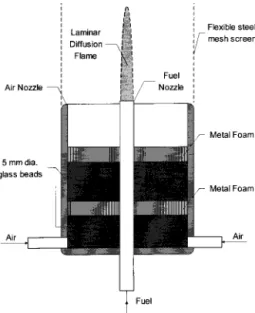
The laminar diffusion flame burner used in these studies is of a design similar to that previously used by us15 and other soot investigators1,3,7,11 and is
shown in Fig. 1. The burner consists of a fuel tube with a 10.9-mm inner diameter, centered in an air nozzle 100-mm in diameter. Before exiting the noz-zle the air passes through packed beds of glass beads and porous metal disks to prevent flame instabilities. The C2H4 fuel flow rate is 3.23 3 1026 m3ys ~just
under the smoke-point fuel flow rate!, and the air flow is 4.73 3 1023 m3ys. The C
2H4 used is research
grade~99.99% pure! and supplied by Matheson. Air is provided from an in-house compressor and filtered. A flame enclosure made of flexible steel mesh protects the flame from air movements in the room while ap-propriate holes provide optical access. The burner assembly is attached to a positioning platform with accurate and repeatable vertical and horizontal movement capability.
The spatial integrity of 2-D soot attenuation im-ages can potentially be compromised by beam steer-ing due to refractive-index gradients. To measure this beam steering, a He–Ne laser beam traversed the flame and was incident on a Beam View imaging system equipped with a Cohu 4800 camera. The 543.5-nm He–Ne laser beam had a Gaussian diame-ter~1ye2! of 0.8 mm. The flame-to-camera distance
was 1.5 m. The position of the undeflected laser beam was recorded in the absence of the burner. With the burner in place the beam displacement was measured as a function of the radial position of the laser beam relative to the burner center. The Beam View software recorded the centroid of the laser beam intensity profile. The results of these experiments
Fig. 1. Schematic diagram of the laminar diffusion flame assem-bly.
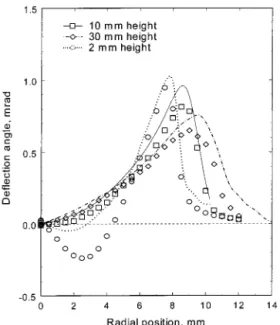
are shown in Fig. 2 for three different heights in the burner.
The laser deflection angle ur in the flame is
de-scribed by16 ur5 2
*
0 zS
1 nDS
]n ]rD
] z< 2*
0 z]d ]r] z, (1)where n5 1 1 d is the refractive index and z is the coordinate along the beam. In flames,d is generally small~,0.0003!, and the approximation in Eq. ~1! is accurate. We have used the coherent anti-Stokes Raman spectroscopy ~CARS! technique to measure temperature profiles in this flame,17and these
pro-files, shown in Fig. 3, have been used to calculate the theoretical beam deflection with Eq.~1!. In the ab-sence of detailed composition information we have neglected the combustion products and assumed the gas to be dry air. By doing this we underestimate the refractive index. However, the major variation comes from the temperature gradient. The error in this assumption will be small to the air side of the reaction zone where the major species is nitrogen and, as we will show, where the beam steering is greatest. The CARS temperature data were fitted to a curve by using the loess function in MathCad, and the refractive index at 570 nm was calculated fromd 5 0.00027 @288yT~r!#,18 where 288 is the reference
temperature in degrees Kelvin and T~r! is the flame temperature in degrees Kelvin as a function of radial position. The constant term in the expression for thed value is a weak function of wavelength varying from 0.000291 at 300 nm to 0.000274 at 1000 nm. Results of the numerical integration of Eq. ~1! over the flame path are shown in Fig. 2 where the devia-tion is calculated in the radial~horizontal! direction. There were much smaller observed deflections in the
vertical direction that result from the much lower temperature gradients in this direction.
The calculated beam deflection is typically 10 –25% greater than the observed values, as shown in Fig. 2. Given the approximations involved in the model, this agreement is satisfactory and the model correctly predicts the radial location of the maximum deflec-tion. At the 2-mm height, close to the burner center, the agreement is much poorer and the calculated value greatly underestimates the observed deflec-tions. This underestimation is not surprising since at these low heights the gas at the burner centerline is almost pure ethylene~which has a refractive index ;2.2 times higher than that of air!, and diffusion results in a greater admixture of air andyor combus-tion products as the flame front is approached. Thus at a 2-mm height in the burner the refractive index decreases with increasing radial position both be-cause of increases in temperature and bebe-cause of in-creasing dilution of the ethylene with air. In these circumstances the model substantially underpredicts the beam deflection.
The predicted beam deflection and CARS flame temperatures are shown in Fig. 3. With increasing height in the flame the visible sooting region of the flame narrows, as indicated by the reducing radial location of the maximum temperature point. How-ever, the diameter of the visible flame increases with height, as the combustion products diffuse outward. An examination of Fig. 3 shows that the radial loca-tion of the maximum beam steering also increases with height. The maximum beam steering at each height is located in the 500 –770-K temperature range. This behavior is to be expected since the refractive-index gradients scale approximately as~1y
Fig. 2. Experimental observations~symbols! and theoretical pre-dictions~curves! of beam steering in laminar diffusion flame.
Fig. 3. Theoretical beam steering and CARS temperature profiles in laminar diffusion flame.
T2!dTydr, and the low-temperature regions of the flame thus dominate the beam steering.
These beam deflections will compromise the spatial integrity of 2-D soot measurements in that flame im-ages will be displaced from reference imim-ages taken in the absence of the flame. In fact, if illuminated by a collimated light beam, the flame will produce a shad-owgraph image16where the intensity variations
re-sult from the spatial gradient of the beam deflections. Imaging the source of the beam disturbance on the detector image plane can minimize the shadowgraph effect. A residual shadowgraph image remains whose effect varies with the ratio of the length of the source~the flame in our case! to the focal length of the imaging lens. Howes and Buchelle19 show that if
the refractive-index gradient is a linear function of distance, the image is distortionless provided that the center of the test section ~the flame in our case! is imaged at the detector surface. A 2-D soot optical system incorporating virtually distortionless imaging is described below. This system is also the optical arrangement selected by Greenberg and Ku.13
3. Two-Dimensional Soot Attenuation Optics
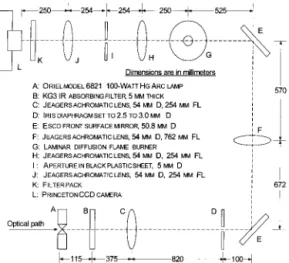
The optical layout of the soot-imaging experiments is shown in Fig. 4. The arc of the Hg lamp is focused on an aperture with a 3.0-mm diameter with an achro-matic lens with a 254-mm focal length. The light passing through this aperture is then collimated with lens F and is incident on the flame. The postflame optics consist of two further 254-mm achromats~H and J! the first of which focuses the light onto aper-ture J and the second of which recollimates the light. As noted by Greenberg and Ku13 this arrangement
provides a telecentric imaging system with constant magnification ~1.0 in this case!. The CCD camera position is such that the center of the flame and the detector plane are optically conjugate to minimize the effects of beam steering in the flame.
The spatial filtering of the light source sets a limit on the resolution attainable in the flame. The full angle divergence of the effective light source is,3.4
mrad, which provides a maximum resolution of 0.0034dfyM in the flame, where dfis the diameter of
the sooting part of the flame and M is the magnifica-tion. For our setup M5 1 and df, 10 mm so that
the resolution in the flame and at the detector is better than 34 mm, which is ;1.5 camera pixels. The detector is a Princeton Instruments CCD Model EEV-TE-11523 1242 with a Model ST138 controller. The detector array size is 1152 3 1242 pixels with a square pixel size of 22.4mm.
Aperture J in Fig. 4 greatly reduces the flame ra-diation reaching the detector. Aperture J is suffi-ciently large to avoid schlieren effects resulting from beam steering in the flame. The operating wave-length is selected by the choice of the interference filter, which is part of the filter pack in front of the CCD. A 20-nm bandwidth filter centered at 577 nm was used in these experiments. Two neutral-density filters whose combined transmission was 0.0016 were added to reduce flame radiation. The maximum signal from the flame alone was approxi-mately 200 counts ~from the region of the highest-temperature soot! compared with the typical lamp signal of 30,000 counts. This background was sub-tracted from lamp-plus-flame exposure to give the lamp-only signal. This flame signal, while negligi-ble, can be further reduced by decreasing the diam-eter of aperture I~Fig. 4!, which is larger than needed to avoid schlieren effects. We also compared the flame radiation to the lamp intensity at 825 nm. At 825 nm the maximum flame radiation was 500 counts and the lamp signal 30,000 counts with an aperture, I, size of 2.5 mm.
The objective of ,0.001 noise in the transmission measurements dictates that the fractional shot noise in the flame images be lower than 0.001. The target fractional shot noise is 0.0003 and requires a signal of .1y0.00032 photoelectrons or ;106 counts @for our detector sensitivity of;10 photoelectronsyanolog-to-digital-converter~ADC! count#. In practice we have summed a 25-pixel region in the vertical direction, giving a spatial resolution of;500 mm in that direc-tion, which improves the signal-to-noise over that of a single pixel by;250.5or ;5. Thus a single-pixel signal level of 200,000 counts or greater is sufficient to render the detector shot noise insignificant. Since the ADC of our CCD is limited to 64,000 counts, five sequential images were acquired and summed to pro-vide the required final image signal-to-noise ratio.
To account for potential intensity drifts in the lamp, we recorded reference images~Io! both before
and after the flame image I. If the intensity varied linearly with time, an average of these two references would provide an accurate image to ratio the flame image to. Observation of regions of the image well beyond the flame shows that in practice there were often small residual differences between the I and averaged Ioimages. A statistical analysis of
sequen-tial images showed that the distribution of intensities within an image~the standard deviation of the indi-vidual pixel values! was much more repeatable than the total image-to-image intensity. The
ity was better after the lamp had warmed up for 60 min, when the standard deviation of a ratioed image had fallen to that expected from the shot noise limit of the individual images. The ratio image IyIowas
divided into strips of 500-mm height taken at height intervals of 2 mm. As a result of the above statisti-cal observation we performed a secondary normaliza-tion, using the area of the image well to one side of the flame, where full transmission would be expected, which was normalized to 1.0.
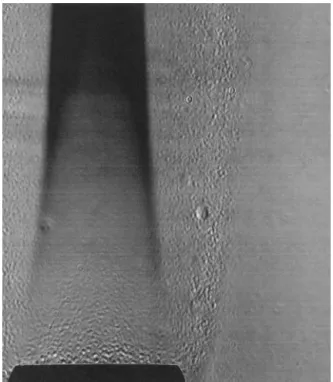
A typical ratio image of the flame is shown in Fig. 5. The weak attenuation by soot can be faintly seen and the tip of the burner is clearly visible. The cir-cular structures observable in the ratio image are also present in the I and Ioimages. However, unlike the individual images, these structures disappear, or become much less prominent, in certain regions of the ratio images. A comparison of Figs. 2 and 5~using the burner tip dimensions to set the scale in Fig. 5! es-tablishes that these blemishes are most prominent in the region of maximum beam steering and disappear in regions of the flame where there is little beam steering. The circular defects in the individual im-ages appear to be due to diffraction effects arising from scattering by surface defects and dust on the optics. A detailed examination of the structures in the ratio image indicates that these blemishes appear to result from the effect of ratioing two diffraction patterns that are slightly displaced in the horizontal direction producing a slightly oval image with alter-nating light and dark bands. Thus the appearance of these diffraction phenomena in the ratio image are indicative of the effect of beam steering in the flame that is only partially compensated for by ensuring
that the burner center and the CCD detector are optically conjugate.
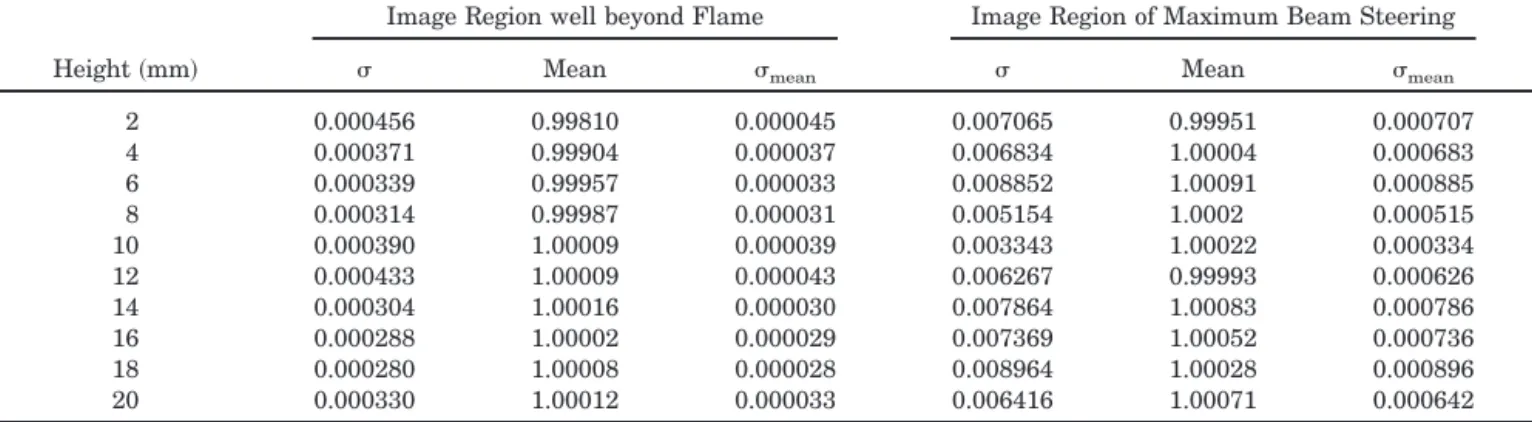
Figure 6 shows the intensity profile of three of the strips taken from low-extinction regions of a flame image along with a MathCad loess smooth fit to the data, which represents the intensity in the superpixel ~25 vertically by one horizontally!. This image has been normalized as outlined above by using the noise-free region beyond the flame boundary ~beyond 12 mm radially at a height of 8 mm!. A single normal-ization factor is used for each image. The regions in which the noise is high are clearly coincident with the appearance of structures in the ratio image and cor-respond to regions of maximum beam steering. Both Figs. 5 and 6 show that the noise is low in the region of soot absorption. We routinely perform sta-tistical analysis on the baseline data of each of the strips. The noisy and noise-free regions were ana-lyzed separately to give the mean, the standard de-viation, and the standard deviation of the mean for each of the strips. ~The standard deviation is the noise of a superpixel.! A typical sample is shown in Table 1 where one can see that the mean intensity in the ratioed image is not only constant for each strip but also the same in both of the regions analyzed. The noise~single standard deviation! in the signal is typically 0.0004 in the region beyond the flame and 0.007 in the region of maximum beam steering. The standard deviation of the means is typically a factor of 10 less than 0.007 since approximately 100 pixels were averaged in each region. From Table 1 it can be seen that, in the region of maximum beam steer-ing, the mean intensity is 1.0 with an uncertainty of 0.0007, indicating that there is no absorption in this
Fig. 5. Image of sooting flame ratioed to the reference image recorded in the absence of the flame.
Fig. 6. Three strips of the transmittance of a C2H4yair diffusion
flame taken from a 2-D image showing the original data and the MathCad loess smooth of the data.
region. This analysis was carried out for each im-age, and the routine transmission measurements were established to a precision of much less than the required 0.001. The single-pixel noise in the sooting region of the flame is expected to be close to that of the noise-free region of the image ~0.0004!, since beam-steering effects are small there. For the Abel inversion, to be discussed in Section 4, it was found that the maximum resolution was attained for an inversion step size of ;100 mm ~4 pixels!. The ob-served transmissions were therefore smoothed by us-ing the loess function to obtain a final resolution of 100mm. This 4-superpixel average will result in a further factor of 2 reduction in the single-superpixel noise values of Table 1. The averaged intensity of the before and after reference image was typically within 0.005 of the flame image in the region beyond the flame. The constancy of the means in the ratio image to,0.001 with changing location supports the earlier observation that the spatial distribution of intensity within the image is more stable that the absolute intensity.
4. Abel Inversion Algorithm
The one-dimensional tomography is performed with a three-point Abel inversion method. The algorithm used is that of Dasch20 who compared Abel,
onion-peeling, and filtered backprojection methods and found the three-point Abel method to be the best because of its low noise, robustness, and speed.
For particles in the Rayleigh limit,~pdyl! , 0.3, the soot volume fraction fvis given by
fv5
ln~t!l
6pLE~m!, (2)
wheret is the transmission, l the wavelength, L the path length, and E~m! 5 2Im@~m22 1!y~m21 2!#; m
is the complex refractive index of soot, m5 k 1 ni. Equation~2! can be written in its differential form as
d ln~t! dr
F
l
6pLE~m!
G
5 fv~r!. (3)Each strip of the 2-D transmission measurements provides experimental values oft versus r, the dis-placement from burner center. The Abel inversion of these data returns the quantity d ln~t!ydr versus r, which, when Eq.~3! is used, can be converted to ra-dial profiles of the soot volume fraction. Using the dispersion relationship from Dalzell and Sarofim21to
calculate the refractive index of soot at 577 nm, we obtain m5 1.59 1 0.566i and E~m! 5 0.258.
Dasch20has shown that the noise ~expressed as a
ratio of the noise in the inversion to noise in the chordal projections! in the inversion is inversely pro-portional to the spacing between the data@ln~t! val-ues#. We have found that data spacing of 100 mm provides the optimum resolution. Any further de-crease in step size inde-creased the inversion noise with-out adding further definition to the soot profiles, even in the regions of maximum soot gradients. The cen-ter of the transmission curves was located first by smoothing the data and then, starting from the two edges of the flame, by finding the pixel values for which the intensity was 2y3 of the maximum value. We then averaged the left- and right-hand values to locate the center of the transmission curves. The precision of this algorithm in locating a burner center was greatly increased by the low noise in the data. Figure 7 shows Abel inverted data in flame regions of low soot extinction, which is the worst-case outcome. It can be seen from Figs. 6 and 7 that peak absorption of as little as 1% provides sufficient signal-to-noise for the inversion.
Figure 8 is a typical example of the inverted trans-mission data in a region of high soot concentration. The excellent agreement between the two halves of the inversion is attributable to the symmetry of the flame and the absence of noise in the transmission measurements.
If we assume a spacing of 0.1 mm and a maximum noise of 0.0005 in thet value of the 25 3 4 superpixel @and hence ln~t! values# projections, the theoretical noise in the Abel inversion@d ln~t!ydr#, when the data from Dasch20, are used, is 0.003 on the burner center,
decreasing monotonically to 0.0003 at r5 2.0 mm.20
When converted to soot concentration, these noise values imply an uncertainty in the soot concentration
Table 1. Statistics of Noise-Free and Noisy Regionsa
Image Region well beyond Flame Image Region of Maximum Beam Steering
Height~mm! s Mean smean s Mean smean
2 0.000456 0.99810 0.000045 0.007065 0.99951 0.000707 4 0.000371 0.99904 0.000037 0.006834 1.00004 0.000683 6 0.000339 0.99957 0.000033 0.008852 1.00091 0.000885 8 0.000314 0.99987 0.000031 0.005154 1.0002 0.000515 10 0.000390 1.00009 0.000039 0.003343 1.00022 0.000334 12 0.000433 1.00009 0.000043 0.006267 0.99993 0.000626 14 0.000304 1.00016 0.000030 0.007864 1.00083 0.000786 16 0.000288 1.00002 0.000029 0.007369 1.00052 0.000736 18 0.000280 1.00008 0.000028 0.008964 1.00028 0.000896 20 0.000330 1.00012 0.000033 0.006416 1.00071 0.000642 a s, standard deviation
of 0.35, 0.075, and 0.035 for r5 0, 0.5, and 2.0 mm, respectively. This theoretical noise behavior as-sumes that the rms noise is constant independent of the projection. From the discussion of beam-steering effects it is clear that this assumption is not true. In these experiments the noise is a minimum on the centerline and increases as the projections approach the region of maximum beam steering. However, the theoretical values are consistent with the data in Figs. 6 and 7, which show that the noise is observable at the burner center but falls rapidly
with increasing r. The asymptotic noise estimate of ;0.04 ppm for r $ 2.0 is consistent with our obser-vations, but the centerline prediction of 0.4 ppm over-estimates the observed error, probably for the reasons noted above. Since the noise in the inver-sion is inversely proportional to the projection spac-ing, a projection spacing of 0.2 mm could lower the noise a factor of 2 with minimal loss of resolution in most parts of the flame.
5. Soot-Concentration Maps
The soot concentration in the C2H4yair flame was
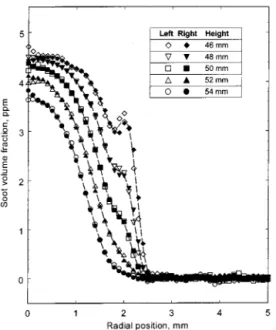
mapped with three separate images to cover the ;70-mm height of the flame. A complete flame mea-surement of soot concentration is shown in Fig. 9~a!, where we have shown one half of the symmetric flame. In Fig. 9~b! the difference between two soot-concentration maps taken on different days is shown. This plot shows a systematic difference between the flames recorded on different days. A detailed exam-ination of the data for the two flames showed that the flame height of one flame was approximately 1.0 – 1.5% larger. This slightly larger flame had approx-imately 2.5% more total soot and the location of its maximum soot contour was consistently at a radial position 30 – 40mm greater in the 25– 40-mm-height region ~where the differences are maximum!. Ob-servation of such a minor change in flame diameter provides a measure of the effective spatial resolution. Since the Abel inversion was performed at a 100-mm spacing, the position of the maximum soot contour at the selected heights was obtained by curve fitting the
Fig. 7. Abel inversion of the transmittance curves of Fig. 6 show-ing the soot volume fraction determined from the right- and left-hand side of the image and a smoothed fit of both data sets.
Fig. 8. Abel inversion of the transmittance curves taken in the region of moderate soot concentration of the C2H4yair diffusion
flame showing the soot volume fraction determined from the right-and left-hright-and side of the image right-and a smoothed fit~broken lines! of both data sets.
Fig. 9. Three-dimensional map of soot concentration in the C2H4y
air diffusion flame showing~a! a complete flame data set and ~b! the difference between data sets taken on different days.
data. These differences, which were consistent across the multiple images necessary to measure a complete flame, attest to the low noise and repeat-ability of the data on a given day. In these laminar diffusion flames the flame width is expected to be proportional to the height,22and the small differences
observed are consistent with this. These small vari-ations in flame profiles may result from daily atmo-spheric pressure changes.
6. Conclusions
We have demonstrated a technique for acquiring 2-D maps of flames that provide very low noise. Two-dimensional attenuation measurements at 577 nm are presented, and the lamp is shown to have suffi-cient intensity to overcome flame radiation at 825 nm. Extension to wavelengths shorter than 577 is straightforward since flame radiation drops dramat-ically whereas lamp intensity decreases more slowly with decreasing wavelength. The technique has the potential to cover wavelengths from 250 to 1100 nm ~the limit of the silicon detector!. A noise level of 0.0007 in extinction and a spatial resolution of 30 – 40 mm for soot concentration were attained. The broadband arc lamp source also allowed us to avoid added noise resulting from speckle with coherent la-ser sources. Beam steering, due to refractive-index gradients, was measured and compared with theoret-ical predictions. The effect of beam steering was minimized through careful optical arrangement and had no effect on the soot measurements in the flames examined. In addition to substantially improved sensitivity and spatial resolution, the 2-D technique provides a significant time saving over point mea-surements of transmission.
We gratefully acknowledge partial funding pro-vided by the Canadian Government’s Program on En-ergy Research and Development ~PERD! ~Project 15113! and the help provided by S. Morgan, a co-op student from University of British Columbia, in set-ting up the experiment.
References
1. H. E. Bockhorn, Soot Formation in Combustion~Mechanisms and Models! ~Springer-Verlag, New York, 1994!.
2. G. M. Faeth and ¨U. ¨O. Ko¨ylu¨, “Soot morphology and optical properties in nonpremixed turbulent flame environments,” Combust. Sci. Technol. 108, 207–229~1995!.
3. R. A. Dobbins, R. J. Santoro, and H. G. Semerjian, “Analysis of light scattering from soot using optical cross sections for ag-gregates,” in Proceedings of the 23rd International Symposium on Combustion ~The Combustion Institute, Pittsburgh, Pa., 1990!, pp. 1525–1532.
4. D. L. Hofeldt, “Real-time soot concentration measurement
technique for engine exhaust streams,” SAE Paper 930079 ~Society of Automotive Engineers, Warrendale, Pa., 1993!. 5. C. J. Dasch, “New soot diagnostics in flames based on laser
vaporization of soot,” in Proceedings of the 20th International Symposium on Combustion~The Combustion Institute, Pitts-burgh, Pa., 1984!, pp. 1231–1237.
6. L. A. Melton, “Soot diagnostics based on laser heating,” Appl. Opt. 23, 2201–2208~1984!.
7. B. S. Mewes and J. M. Seitzman, “Soot volume fraction and particle size measurements with laser-induced incandes-cence,” Appl. Opt. 36, 709 –717~1997!.
8. R. L. Vander Wal and K. J. Weiland, “Laser-induced incandes-cence: Development and characterization towards a mea-surement of soot-volume fraction,” Appl. Phys. B 59, 445– 452 ~1994!.
9. S. Will, S. Schraml, and A. Leipertz, “Two-dimensional soot-particle sizing by time-resolved laser-induced incandescence,” Opt. Lett. 20, 2342–2344~1995!.
10. N. P. Tait and D. A. Greenhalgh, “PLIF imaging of fuel fraction in practical devices and LH imaging of soot,” Ber. Bunsenges. Phys. Chem. 97, 1619 –1625~1993!.
11. S. Will, S. Schraml, and A. Leipertz, “Comprehensive two-dimensional soot diagnostics based on laser-induced incandes-cence ~LII!,” in Proceedings of the 26th International Symposium on Combustion~The Combustion Institute, Pitts-burgh, Pa., 1996!, pp. 2277–2284.
12. M. E. Case and D. L. Hofeldt, “Soot mass concentration mea-surements in diesel engine exhaust using laser-induced incan-descence,” Aerosol Sci. Technol. 25, 46 – 60~1996!.
13. P. S. Greenberg and J. C. Ku, “Soot volume fraction imaging,” Appl. Opt. 36, 5514 –5522~1997!.
14. P. S. Greenberg and J. C. Ku, “Soot volume fractions in normal and reduced gravity laminar acetylene diffusion flames,” Com-bust. Flame 108, 227–230~1997!.
15. ¨O. L. Gu¨lder and D. R. Snelling, “Influence of nitrogen dilution and flame temperature on soot formation in diffusion flames,” Combust. Flame 92, 115–124~1993!.
16. F. J. Weinberg, Optics of Flames ~Butterworths, London, 1963!.
17. ¨O. L. Gu¨lder, D. R. Snelling, and R. A. Sawchuk, “Influence of hydrogen addition to fuel on temperature field and soot for-mation in diffusion flames,” in Proceedings of the 26th Inter-national Symposium on Combustion ~The Combustion Institute, Pittsburgh, Pa., 1996!, pp. 2351–2357.
18. D. R. Lide, ed., CRC Handbook of Physics and Chemistry, 72nd ed.~CRC Press, Boca Raton, Fla., 1991!.
19. W. L. Howes and D. R. Buchelle, “Optical interferometry of inhomogeneous gases,” J. Opt. Soc. Am. 56, 1517–1528~1966!. 20. C. J. Dasch, “One-dimensional tomography: a comparison of Abel, onion-peeling, and filtered backprojection methods,” Appl. Opt. 31, 1146 –1152~1992!.
21. W. H. Dalzell and A. F. Sarofim, “Optical constants of soot and their application to heat flux calculations,” J. Heat Transfer
91,100 –104~1969!.
22. F. G. Roper, “The prediction of laminar diffusion flame sizes: Part 1. Theoretical model,” Combust. Flame 29, 219 –226 ~1977!.