HAL Id: hal-00615331
https://hal.archives-ouvertes.fr/hal-00615331
Submitted on 19 Aug 2011
HAL is a multi-disciplinary open access archive for the deposit and dissemination of sci-entific research documents, whether they are pub-lished or not. The documents may come from teaching and research institutions in France or abroad, or from public or private research centers.
L’archive ouverte pluridisciplinaire HAL, est destinée au dépôt et à la diffusion de documents scientifiques de niveau recherche, publiés ou non, émanant des établissements d’enseignement et de recherche français ou étrangers, des laboratoires publics ou privés.
agro-based particleboards by near infrared spectroscopy
Paulo Ricardo Gherardi Hein, Ana Carolina Maioli Campos, Rafael Farinassi
Mendes, Lourival Marin Mendes, Gilles Chaix
To cite this version:
Paulo Ricardo Gherardi Hein, Ana Carolina Maioli Campos, Rafael Farinassi Mendes, Lourival Marin Mendes, Gilles Chaix. Estimation of physical and mechanical properties of agro-based particleboards by near infrared spectroscopy. European Journal of Wood and Wood Products, Springer Verlag, 2010, 69 (3), pp.431-442. �10.1007/s00107-010-0471-5�. �hal-00615331�
Estimation of physical and mechanical properties of
agro-based particleboards by near infrared
spectroscopy
(Beurteilung physikalischer und mechanischer Eigenschaften von agro-basierten Spanplatten mittels Nahinfrarot-Spektroskopie)
Paulo Ricardo Gherardi Hein
CIRAD – PERSYST Department, Research unit: Production and Processing of Tropical Woods, TA B-40/16, 73 rue Jean-François Breton, 34398 Montpellier, France.
email: phein1980@gmail.com
Ana Carolina Maioli Campos, Rafael Farinassi Mendes, Lourival Marin Mendes
Ciência e Tecnologia da Madeira – Departamento de Ciências Florestais, Universidade Federal de Lavras – Campus Universitário, CP 3037, Lavras, Minas Gerais, Brazil, CEP 37200-000
Gilles Chaix
CIRAD - BIOS Department, Research unit: Diversité génétique des espèces forestières, TA B-40/16, 73 rue Jean-François Breton, 34398 Montpellier, France.
Abstract Partial least square regression (PLS-R) calibrations based on near infrared (NIR) spectroscopic data were developed in order to predict mechanical and physical properties of agro-based particleboards. The panels were manufactured using Eucalyptus and Pinus wood particles and sugar cane bagasse. The following panel properties were evaluated according to standard methods: modulus of elasticity (MOE), modulus of rupture (MOR), internal bonding (IB) strength, water absorption (WA24H), and thickness swelling (TS24H) after 24 hours of immersion. NIR spectra information was measured on samples cut from each particleboard and correlated with their physical and mechanical properties by PLS-R to build predictive NIR models. The NIR models for IB, WA24H and TS24H presented satisfactory coefficient of determination (0.73; 0.72 and 0.75, respectively.) The key role of resins (adhesives), cellulose, and lignin for NIRS calibrations of mechanical and physical properties of the particleboards is shown. These models can be useful to quickly verify such properties in unknown agro-based particleboards.
Zusammenfassung
Partial Least Square Regression (PLS-R) Kalibrierungen auf der Grundlage von nahinfrarot- (NIR)-spektroskopischen Daten wurden zur Bestimmung der mechanischen und
physikalischen Eigenschaften von agro-basierten Spanplatten entwickelt. Die Platten wurden aus Eukalyptus- und Kiefernholz- und Bagassespänen hergestellt. Die folgenden
Eigenschaften wurden mittels Standardprüfverfahren beurteilt: Elastizitätsmodul (MOE), Biegefestigkeit (MOR), Querzugfestigkeit (IB), Wasseraufnahme (WA24H) und
Dickenquellung (TS24H) nach 24-stündiger Wasserlagerung. NIR-Spektren wurden an Proben aus jeder Spanplatte gemessen und mit den mittels PLS-R bestimmten physikalischen und mechanischen Eigenschaften korreliert, um daraus Modelle zu entwickeln. Die NIR-Modelle für IB, WA24H und TS24H ergaben zufrieden stellende Bestimmtheitsmaße (0,73, 0,72 bzw. 0,75). Aufgezeigt wurde die Schlüsselrolle der Harze, Zellulose und Lignin für die NIRS-Kalibrierung der mechanischen und physikalischen Eigenschaften von Spanplatten. Diese Modelle können sich zur schnellen Überprüfung dieser Eigenschaften von agro-basierten Spanplatten als nützlich erweisen.
1 Introduction
Particleboard is a wood-based panel product manufactured from particles of wood or other ligno-cellulosic materials and a binder under pressure and temperature (Nemli and Aydın 2007). The increasing demand for new raw materials in wood engineering industries have led researchers to investigate non-wood ligno-cellulosic biomass utilization in composite
manufacturing (Guntekin and Karakus 2008). Transforming residues from agro-industry into high quality industrial panel products provides a prospective solution for more effective residues utilization. Since large quantities of the sugar cane bagasse, containing both crushed rind and pith fibres, remain after sugar extraction (Xu et al. 2009), this underutilized low-quality material could play an important role in the manufacture of agro-based particleboards (Ashori and Nourbakhsh 2008).
In this perspective, many research units have explored potential suitability of the alternative resources for particleboard manufacturing (Nemli and Aydın 2007). Considering the several possibilities to combine components and binders and their yields to produce particleboards, a huge number of samples need to be quickly evaluated in order to verify if these new products have acceptable technological properties. The determination of physical and mechanical
properties of particleboards is cost and time-consuming restricting the researchers in the experimental production of panels. In addition, because of the variability within the particleboards, a large number of samples must be tested in order to obtain more accurate characterization.
To overcome these budget and technical constraints, a suitable technique for characterization of a huge range of materials including agro-based engineering products is the near infrared (NIR) spectroscopy (Burns and Ciurczak 2001). The technique is based on vibrational
spectroscopy, which measures the interaction of electromagnetic NIR radiation with chemical bonds of the constituents of the sample (Pasquini 2003). According to Workman (2008) NIR radiation interacts with polar molecules and especially with O-H functional groups such as in water, C-H as in biomass, but also with C-O and C-O-H bonds and C=C double bonds
frequently found in biomass. In short, the sample is measured in a NIR spectrophotometer and the analyses rely on developing a calibration that relates the spectra of a large number of samples to their known reference value, for instance lignin or extractive content of wood samples. This calibration is then used to predict the lignin or extractive content of further samples based on their NIR spectrum. It is implicit in this technique that the “training” sets on which the calibrations are based contain the whole range of variation in the samples to be further analysed (Raymond 2002; Tsuchikawa 2007; Mora and Schimleck 2008). The main advantage of NIR spectroscopy technique is that, after calibration, more than one parameter per sample can be determined at once. Moreover, this technique enables the characterization of a huge number of samples.
The particleboard industry has experienced an expressive increase on the request concerning the performance of their products and depends upon new solutions for controlling the quality of their products. Currently some scientific contributions have shown the potential of
combining spectroscopic data with multivariate data analysis as a rapid and reliable tool for characterizing engineered wood products. For instance, Kniest (1992) used NIR spectroscopy to characterize urea resined wood particles while Niemz et al. (1994) evaluated resin content in chip mixtures by NIR-spectroscopy. Meder et al. (2002) developed regressions with good potential for stiffness prediction of individual ply veneers using NIRS. Rials et al. (2002) used NIRS technique for predicting the mechanical properties of medium-density fiberboards. Dolezel-Horwath et al. (2005) used spectroscopy and chemometric modelling to control production of wet-processed hardboards. They used online UV-vis-NIR spectroscopy for a full-scale industrial hardboard production to collect spectra from fibre materials, intermediate
fibremats and from final hardboards and found strong relationships between UV-vis-online-spectra of the fibremats and the water uptake of the corresponding fibreboards. Kelley et al. (2005) used NIRS to evaluate changes in the chemical composition of loblolly pine medium density fiberboard furnish as a function of age and refining pressure. Kent et al. (2006) investigated the effects of fungal decay on the properties of oriented strand board (OSB) sheathing-grade structural panels manufactured with Populus tremuloides, including weight loss, specific gravity, dowel-bearing strength, shear strength, and alkali solubility. They used NIR spectroscopy in combination with multivariate statistical methods to study the decay process and reported that their predictive NIRS models showed promissory results to evaluate weight loss, shear strength, dowel-bearing strength, and solubility. Adedipe and Dawson-Andoh (2008) evaluated moisture content of yellow-poplar veneer sheets combining the NIR spectroscopic data with reference data by PLS-R. They reported predictive models with high coefficients of correlations demonstrating the feasibility of NIRS technique to evaluate physical properties in engineering products. Hein et al. (2009a) used NIRS on wood-cement panels to develop PLS models for internal bond, modulus of rupture and thickness swelling after immersion in water for 24h.
Although the feasibility of NIR spectroscopy to determine a range of properties of wood-based panels has been demonstrated in the above mentioned studies, further studies are required for a better understanding of how NIRS is able to evaluate technological properties in agro-based panel products on the basis of vibrational spectroscopic analysis. Thus, the aim of this study was to develop calibrations based on near infrared spectroscopic data in order to predict mechanical and physical properties of agro-based particleboards produced from Eucalyptus and Pinus wood particles and sugar cane bagasse, under different manufacturing conditions.
2 Material and Methods
2.1 Preparation of agro-based particleboards
The agro-based particleboard samples used in this work were produced from different contents of Eucalyptus and Pinus wood particles with sugar cane bagasse, obtained from experimental plantations located at the southeast of Minas Gerais State, Brazil. Wood
particles were sampled from 31 year old Pinus oocarpa with an average basic density of 0.50 g/cm3, and 8 year old Eucalyptus urophylla with an average basic density of 0.56 g/cm3. The average density of sugar cane bagasse was 0.1 g/cm³. The raw materials were taken to the
Experimental Unit of Wood Panel Production of the Universidade Federal de Lavras (Brazil), where they underwent milling. The produced particles (~5 mm x ~1 mm x ~0.5 mm) were classified at the mill by a shaker (0.8 mm x 0.8 mm) to remove most of the fines and dried to a mean moisture content of 3% in a convection oven.
Different proportions of sugar cane bagasse, Pinus and Eucalyptus particles were combined in seven composition classes of particleboards (Fig. 1). The target board density and dimensions for all panels were 0.70 g/cm³ and 480 mm x 480 mm x 15 mm, respectively. Particleboards were produced with phenol-formaldehyde or urea-formaldehyde resin. Based on the oven-dried particle weight, 6, 9, and 12 percent of resin, plus 1 percent of wax were applied to the particles using an atomizing spray and rotary blender. Total press time was 8 minutes at 180 °C (phenol-formaldehyde) and 160 °C (urea-formaldehyde) and a pressure of 4 N/mm². Three replicates were produced for each type of panel. Thus, a total of 126 panels were produced according to the scheme presented in Fig. 1. The same panel samples were investigated by Campos et al. (2009) to evaluate their composition by near infrared spectroscopy.
2.2 Test specimens and sampling
Fourteen specimens were cut from the center of each panel for determination of physical and mechanical properties and also for NIR scanning. The specimens were stabilized in a climate chamber (20 ± 2°C; 60 ± 3% relative humidity), where they were also submitted to
mechanical tests and NIR spectral scanning. Under these conditions, samples reached equilibrium moisture content of 12%. The dimensions of the specimens varied according to property determination standard and are presented in Fig. 2.
Due to limitations imposed by the spectrometer equipment, the specimens for NIR scanning should present the dimensions suitable for the spectrometer measuring cell (50 mm x 50 mm x 10 mm). Therefore, except for the internal bond test specimen, no other specimen dimension would allow NIR scanning prior to laboratory test. The integrity of solid specimens is
completely compromised after being subjected to testing procedures such as bending and immersion in water, not allowing the achievement of sample-cut and scanning after laboratorial tests. Thus, it was opted to use external specimens for NIR spectral data acquisition to calibrate the models for the mechanical and physical properties.
The physical properties, water absorption and thickness swelling after immersion for 24 hours (WA24H and TS24H, respectively), were performed according to the ASTM Standard 1982: D1037-100. The mechanical properties analyzed were: internal bond (IB), determined
according to D1037-28 ASTM standard (1982), modulus of elasticity (MOE) and modulus of rupture (MOR), both determined by bending test according to DIN 52362 (1982) standard. A universal testing machine (DL - 30 kN model, EMIC, Paraná, Brazil) was used to perform the mechanical tests.
2.4 Spectra acquisition
NIR spectra were measured in a spectrometer (NIR 900 PLS model, Femto instrument Ind & Com, São Paulo, Brazil) in the diffuse reflectance mode. This NIR spectrometer is based on a Czerny-Turner monochromator and uses continuous diffraction to perform the reflectance analysis of solids using a tungsten-halogen 55W light source. The NIR spectra were recorded at wavelengths between 1,100 and 2,500 nm at 2-nm intervals. Two samples were obtained per particleboard for NIR scanning (Fig. 2). Spectra information was taken directly from the sample surface. Four scans were measured from each sample-cut (totaling eight scans per panel) and averaged into a single NIR spectrum. This spectrometer measures the diffuse reflected light through a window diameter of approximately 10 mm. The procedure consisted of turning the sample in the equipment measuring cell enabling the light beam to capture different spots of the specimen heterogeneous surface, providing more representative averaged spectrum and reducing the data noise.
2.5 Calibration and validation statistics
Partial Least Squares (PLS) regression analyses were developed to describe the relationship between the NIR spectra and the panel properties using the Unscrambler (CAMO AS, Norway) software version 9.7. PLS calibrations were performed using external validation based on two subsets (calibration set and validation set) with a maximum of 12 latent variables. The selection of the samples of each subset was made manually. The sample set was ranked in ascending order and the data set was split into two uniformly distributed subsets. This procedure allowed higher control of the variability within each subset.
First derivatives (13-point filter and a second order polynomial) and second derivatives (25-point filter and a third order polynomial) were applied on the NIR spectra data using Savitzky and Golay (1964) algorithm. The Martens’ uncertainty test (Westad and Martens 2000) was
used to select the wavenumbers with significant regression coefficients that were further used to recalculate the models. The student residuals versus leverage value plot analyses were used to identify outlier samples, as described by Hein et al. (2009b). The selection of the number of latent variables (LV´s) was based on residual variance plot and the optimal LV, with
minimum residual variance.
2.6 Selection of the validation model
To compare the models’ calibration and validation the following statistics were used: (i) coefficient of determination of calibration (R²c); (ii) coefficient of determination of prediction (or validation) (R²p); (iii) standard error of calibration (SEC); (iv) standard error of cross-validation (SECV); (v) standard error of prediction (or cross-validation) (SEP); (vi) ratio of
performance to deviation (RPD) and (vii) the number of latent variables (LV) as suggested by Fujimoto et al. (2008) and Jones et al. (2008). The formulas for SEC, SECV, and SEP are given in Workman (2008). These statistics should be as low as possible whereas coefficient of determination should be high. The SEC statistic is a useful estimate of the optimal accuracy obtainable for a given set of wavelengths used to develop a calibration equation, while the calculation of SECV is a method useful for determining the “best” number of latent variables to use in building a calibration equation by cross-validation and it is an estimate of the SEP. The cross-validation (CV) method is based on an iterative (repetitive) algorithm that selects samples from a sample set population to develop the calibration equation and then predicts on the remaining unselected samples (Workman 2008). The SEP is also termed the standard error of prediction, and allows for comparison between NIR-observed predicted values and
laboratory values (reference values) during the validation test.
The RPD value is the ratio of the SECV or SEP to the standard deviation (sd) of the used reference values (AACC 1999). This statistic provides a basis for standardizing the error of prediction (Williams and Sobering 1993) and makes it possible to compare different calibration parameters such as NIR spectra information measured from different boards.
3 Results and Discussion
3.1 Laboratory data
The use of particleboards for structural purpose, with security and economy, requires the prior knowledge of their mechanical and physical properties. For many practical reasons, the
modulus of elasticity, the modulus of rupture and internal bond are among the technological properties of engineering wood products which may ensure their suitability as structural elements. The MOE is a parameter that indicates the rigidity of a material subjected to a determined strain, and MOR indicates the limit of the material, subjected to maximum strain until rupture, while IB measures the degree of adhesion between the particles in samples submitted to the strain of perpendicular traction (Maloney 1993). For structural use, the panels should present resistance to exposure to water, changes in humidity, and weathering. The absorption of water and swelling in thickness are, respectively, the expression percentage of the amount of water absorbed and swelling in thickness when a stabilized sample is immersed in water for 24 hours according to ASTM D 1037-96a test method (ASTM 1982).
Table 1 shows the descriptive statistics of the agro-based particleboard properties. The panels presented a large range of values for each property. The modulus of elasticity ranged from 0.49 to 1.23 10³ N/mm² while the modulus of rupture varied from 5.04 to 18.72 N/mm². The internal bond was the mechanical property which presented the highest variability (CV=38%). Technical problems with 27 panels for the internal bond measurements occurred and it was decided to remove them from the data set (see Table 1). The water absorption after immersion for 24 hours presented an averaged value of 43% ranging from 8 to 96%, the highest range of variation. The thickness swelling after immersion for 24 hours also presented a very important range of variation. The variability between particleboards and the effects of the different raw material contents on these properties are out of the scope of the present paper.
Table 2 presents the coefficients of variation (%) of the averaged values of the laboratory measurements for water absorption after immersion for 24 hours (WA24h), thickness swelling after immersion for 24 hours (TS24h), modulus of elasticity (MOE), modulus of rupture (MOR), and internal bond (IB) by composition class of particleboards. This information (Table 2) allows knowing the repeatability of the reference methods and the variation within panels. In general, the coefficients of variation presented moderate to low values (below 20%), indicating little variability within the particleboards. The variability of the properties between particleboards (Table 1) is important for this study: the higher the property
variability, the more chances to get a better statistics for the calibration model. However, the variability within panels (Table 2) can result in noisy and low precision reference values, compromising calibration performance. To improve NIRS models calibration output it is also recommended to obtain NIR spectra from the same sample that will be further used for reference analysis. Unfortunately, as explained in the Material and Methods section, this was
not possible. Nevertheless, the representativeness of the spectra samples was the major limitation of this paper.
3.2 NIR infrared spectra and mathematical pre-treatments
As a complex material, particleboards can be described as a combination of different kinds and contents of chemical substances, anatomical tissues, and solid materials (Campos et al. 2009). Hence, the spectra reflect the energy captured (or reflected) by chemical bonds from different resins (phenol-formaldehyde and urea-formaldehyde) and resin levels, wood components nature and contents (cellulose, lignin, hemicelluloses, extractives) and their interactions. The assignments of absorption bands normally associated with ligno-cellulosic fibres and resins are summarized in Table 3. The index (Table 3) refers to the numbers assigned to the absorption bands presented in Fig. 3 and the regression coefficients presented in Figures 4 and 5. In Figures 3, 4 and 5, the bands correspondent to lignin are shown by squares, to cellulose by full circles, to water by dotted circles and to resin by triangles.
The resins play a key role in NIR spectra. These adhesives are important for the mechanical and physical properties and contribute to the NIR information. The structural formulae of phenol-formaldehyde and urea-formaldehyde resins are presented in Körner et al. (1992). Phenols show absorptions in NIR spectra with first overtones of the O-H near 1,400-1,440 nm range (Workman and Weyer 2007) while urea shows absorption in the 2,012-2,353 nm range which includes the strong combination doublet of the -NH2 group and is free from water vibrations (Dessipri et al. 2003).
Many papers deal with evaluating the resin content in particleboards by means of FTIR or FTNIR spectroscopy (Niemz et al. 1994, 1992; Kniest 1992; Körner et al. 1992). For instance, Körner et al. (1992) quantified the portion of agglutinant in particleboards based on their IR spectra and presented a set of wavenumbers for the detection of commercial glues in
particleboards, showing interaction at 6,024, 6,410 and 6,493 nm for urea-formaldehyde and at 6,024 and 6,250 nm for phenol-formaldehyde resin of the panels. Using the NIR range, Niemz et al. (1992) state that wavelengths of 2,020 nm, 1,900 nm and 2,110 nm turned out to be the most suitable one for urea resin detection in wood chips mixtures. More recently, Dessipri et al. (2003) demonstrated the interaction between formaldehyde and urea on the spectra at the 2,150 and 2,197 nm due to the NH2 combination bands, and at 2,247 nm which is attributed to the CH2 combination band of the methylol group.
According to Campos et al. (2009), NIR spectra vary depending on the surface roughness, particles size and shape of the panels, among other factors. This complex information demands sophisticated statistical tools, to allow proper interpretations and enhance NIR spectral data applications. The application of mathematical pre-treatments (pre-processing or data transformation) seeks to improve the signal quality, suppress part of the noise or physical information and to provide evidence of absorbance peaks in NIR spectra. Fig. 3 shows the original NIR spectrum as well as the first and the second derivative of a NIR spectrum from an agro-based particleboard. The untreated and pre-treated NIR spectra of all samples were averaged.
3.3 PLS-R Calibration models
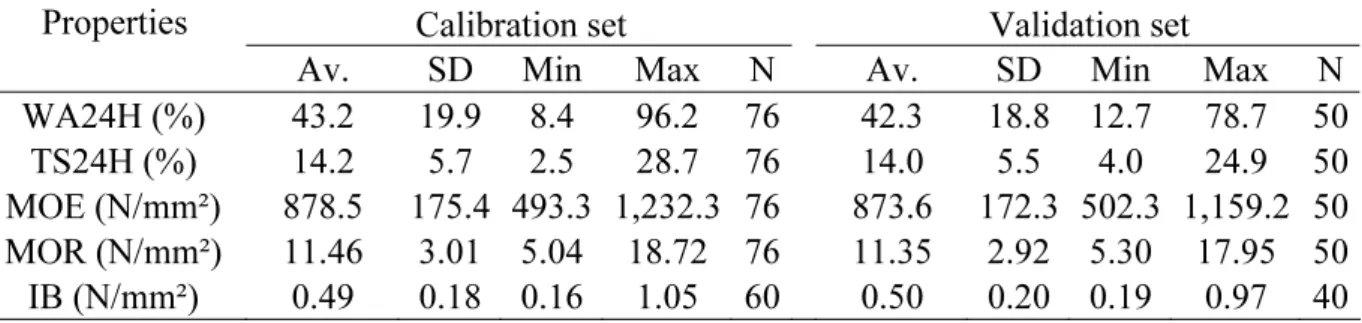
Table 4 presents the descriptive statistics for the selected calibration and validation sets. According to Mora and Schimleck (2008) the calibration models must include all possible sources of variation that can be encountered later in real applications because the goal is to estimate the concentrations in new samples. By selecting the subsets manually it was
guaranteed that the validation set had extreme values comprehended in the variation interval of the calibration set.
3.3.1 Mechanical Properties
The PLS-R models were calculated from the untreated and pre-treated NIR spectra data from 1,100 to 2,500 nm in order to predict MOE, MOR, and IB of particleboards. The model statistics are presented in Table 5.
The PLS-R models for MOE and MOR provided low to moderate coefficients of
determination (R²p from 0.42 to 0.62) and RPD values ranging from 1.3 to 1.6. In regard to the internal bond, the model statistics were stronger (R²p from 0.68 to 0.73) with quite similar SEP’s (0.097 to 0.11 N/mm²) and RPD values varying from 1.8 to 2.0. According to Williams and Sobering (1993) a RPD greater than 2.5 is considered satisfactory for screening, although it has been shown that a RPD of approximately 1.5 indicates that NIR spectroscopy can be used as an initial screening tool (Schimleck et al. 2003). In this study, the predictive PLS-R models for MOE, MOR and IB presented acceptable statistics for initial screening.
Delwiche and Reeves (2004) recommended the application of mathematical pre-treatments during the modeling in order to improve the statistics of the PLS regression models. The IB PLS-R models based on the derivatives of the NIR spectra presented higher RPD values and required less LV’s. However, regarding the MOE calibrated models, first and second
derivatives of the NIR spectra did not enhance the model performance. For the MOR
calibrations, first and the second derivative of the NIR spectra provided the same RPD value (RPD=1.6). The bias presented in Table 5 shows that there are no systematic deviations between reference and based values. Fig. 4 shows the relationship between the NIR-fitted and the laboratory-measured IB values, and the spectral plot of the weighted regression coefficients for the PLS-R model developed from the second derivatives of the NIR spectra. The open circles represent the calibration samples while filled circles represent the validation set (Fig. 4A). The gray rectangles (Fig. 4B) indicate the uncertainty limits from Martens’ uncertainty tests that were used to calculate the model.
The NIR spectra collected from these particleboards represent a great variety of interactions of the radiation along the wavelength range and the properties of the particleboards. In turn, MOE, MOR and IB properties are affected by many variables of the production process of the panels, among which the density and composition of panels, the adhesive contents, the panel compression ratio, the paraffin content and the size of the particles reflected in the slenderness index (Kelly 1977).
Although the feasibility of the NIR spectroscopy has been shown for MOE, MOR and IB in this study and in other investigations (Meder et al. 2002; Rials et al. 2002; Wang et al. 2004; Kelley et al. 2005), it was still unclear how this technique can evaluate mechanical properties on the basis of vibrational spectroscopic analysis. The assignments of absorption bands indicated in Fig. 4B are useful to understand which components affect the calibrations. Here, the regression coefficients showed that resin (adhesive) (triangles 3, 10, 13, 14 and 16), aromatic groups in lignin (squares 1, 2 and 6) and cellulose (circle 7 and 17) played a major role in PLS calibration for internal bond (Fig. 4).
NIR spectra from a complex material such as these panels are consequently not merely driven by the underlying chemistry, but also by the solid structure (Gierlinger et al. 2004). The results presented in Fig. 4 show that such mechanical properties are directly linked with resins and chemical and physical properties of the engineering wood products.
3.3.2 Physical properties
Water absorption and thickness swelling were tested to evaluate the water resistance
properties of the particleboards by PLS-R models based on their NIR spectra. Table 6 shows the statistics associated with the PLS-R models to estimate these physical properties.
The PLS models to estimate the water absorption after immersion for 24 hours presented were acceptable showing good statistics with R²p from 0.66 to 0.72 and RPD values from 1.7 to 1.9. The SECV’s were quite similar (11.4 to 11.7%), while higher differences were observed for the SEP’s (9.9 to 11.1%). For this physical property, the PLS-R models required five to six latent variables.
Regarding the models to estimate the thickness swelling after immersion for 24 hours, the statistics were also good. The PLS models present R²p ranging from 0.64 to 0.75, SEP from 2.6 to 3.2% and RPD values varying from 1.7 to 2.1. Fig. 5 shows the NIR fitted versus laboratory-measured TS24H values plot (A) and the regression coefficients for PLS-R model predicting TS24H with the first derivative spectra data (B). The assignments of absorption bands indicated in Fig. 5B show that resin (triangles 5, 11, 12, 14 and 16), cellulose (circles 7 and 17) and aromatic groups in lignin (squares 1, 2 and 6) also play an important role in the calibration of thickness swelling after 24 hours. Moisture content of the panels (dotted circle 9) influenced the calibration of TS24H. These results confirm the role of these chemical components in determining (in part) the thickness swelling, due to their hydrophilic functional groups that associate with water. As elucidated earlier, the physical aspect of solid material are also a source of NIR spectral variance. Therefore, not only the chemical components underlined here play a role in water absorption, but also the sponge effect caused by capillarity and adsorption of water within the porous solid (particleboard).
In regard to the mathematical pre-treatments of the NIR spectra, Table 5 shows that derivative transformations did not always improve the models statistics of the investigated mechanical properties. The models adjusted for internal bond presented a positive response to first and second derivatives treatments, with higher coefficients of determination (R²c and R²p) and less number of latent variables (conferring more robust models). For the models to predict water absorption (Table 6), it was observed that the first and second derivatives of spectra enhanced the calibration statistics, but the same was not true for the prediction statistics. On the other hand, for the thickness swelling predictive models the mathematical pre-treatments were positive to both calibration and prediction statistics. These results indicate that there is
no rule of thumb regarding mathematical pre-treatments applied to NIR spectra, and testing all possibilities remains the regular procedure.
According to Fujimoto et al. (2008), the higher the RPD value the more reliable is the calibration. Generally, if outliers are removed from the data set, the RPD value tends to increase. However, for WA24H (Table 6) the number of outliers from validation set increases but the R²p decreases and the SEP increases in the validation set. One reasonable explanation would be the removal of extreme values that cooperate with the regression adjusted line. To standardize the removing outliers’ process, the anomalous samples reported in Tables 5 and 6 were identified and removed examining the student residuals and leverage value scatter plot as described in Hein et al. (2009b). For instance, when using untreated NIR spectra, only two samples appeared to be as outliers, while after transformation, new samples become outliers in the TS24H calibrations. Therefore, the effect of removing outliers and transforming NIR spectra on the model statistics is difficult to be interpreted.
Over the last years, the association of near infrared spectroscopy and multivariate analysis has been demonstrated as a rapid and reliable tool for characterizing engineering biomaterials products (Meder et al. 2002; Rials et al. 2002; Dolezel-Horwath et al. 2005; Kelley et al. 2005; Kent et al. 2006; Adedipe and Dawson-Andoh 2008; Campos et al. 2009; Hein et al. 2009a). Although it is well known that both spectral noise and reference method affect the accuracy and the precision of NIR predicted values (Rodrigues et al. 2006), in this study, different samples (cut from the same board) were used for NIR spectra acquisition and for determination of the reference data. In principle this procedure would cause a
representativeness problem disabling the use of NIRS. Notwithstanding, good correlations were obtained and the results confirm the above-mentioned studies which showed that it is possible to evaluate a range of properties in wood-based panels using near infrared
spectroscopy and multivariate analysis techniques. Based on the significant absorption bands and regression coefficients of the models, these results showed that resin, cellulose and lignin play a major role in the calibration of particleboard properties.
The above results are useful to generate a better understanding on how this technique is able to evaluate mechanical and physical properties in engineering products on the basis of vibrational spectroscopic analysis.
The results of this study showed that partial least square regression based on near infrared spectra to evaluate physical and mechanical properties in particleboards manufactured from Eucalyptus and Pinus wood particles and sugar cane bagasse are promising. The PLS calibrations presented satisfactory correlations between NIR spectra and particleboard properties such as modulus of elasticity, modulus of rupture, internal bond strength, water absorption and thickness swelling after immersion for 24 hours. The predictive models showed satisfactory results with coefficient of determination ranging from 0.42 to 0.75 and RPD values from 1.3 to 2.1. The internal bond strength was the mechanical property which presented the best statistics while the physical property which presented the higher calibration statistics was the thickness swelling after immersion for 24 hours. The results confirm that near infrared spectroscopy technique can be a useful tool in order to verify quickly if unknown particleboards present acceptable properties. Based on the significant absorption bands and regression coefficients of the models, such results indicate that resin, cellulose and aromatic groups in lignin are components that play an important role in the calibrations for internal bond and thickness swelling after immersion for 24 hours. Further studies are
indispensable to generate a deeper understanding of how near infrared spectroscopy is able to evaluate mechanical and physical properties of wood products.
Acknowledgment The authors express their thanks to the Universidade Federal de Lavras, Departamento de Ciência e Tecnologia da Madeira, for supporting the experimental work and, particularly, to Dr. Paulo F. Trugilho for enabling the NIRS analysis. Special thanks to the reviewers for their remarkable advices. The research was funded by CNPq (Conselho Nacional de Desenvolvimento Científico e Tecnológico, Brazil) and FAPEMIG (Fundação de Amparo à Pesquisa do Estado de Minas Gerais, Brazil). P.R.G. Hein was supported by CNPq (process no. 200970/2008-9).
Conflict of interest The first author is supported by CNPq and the co-authors have not a financial relationship with the organization that sponsored the research. We declare that there is no conflict of interest.
References
American Association of Cereal Chemists (1999) AACC, Method 39-00, 15
Adedipe OE, Dawson-Andoh B (2008) Predicting moisture content of yellow-poplar (Liriodendron tulipifera L.) veneer using near infrared spectroscopy. Forest Prod J 58:28-33
American society for testing and materials (1982) ASTM, D 1037. Standard methods of evaluating properties of wood-base fiber and particles materials. Annual Book of the ASTM Standards. Philadelphia, PA, USA.
Ashori A, Nourbakhsh A (2008) Effect of press cycle time and resin content on physical and mechanical properties of particleboard panels made from the underutilized low-quality raw materials. Ind Crop Prod 28:225-230
Burns D, Ciurczak EW (2001) Handbook of Near-Infrared Analysis, Second Ed., Marcel Dekker, New York Campos ACM, Hein PRG, Mendes RF, Mendes LM, Chaix G (2009) Near infrared spectroscopy to evaluate composition of agro-based particleboards. BioResources 4(3):1058-1069
Delwiche SR, Reeves III JB (2004) The effect of spectral pretreatments on the PLS modelling of agricultural products. J Near Infrared Spec 12:177-182
Dessipri E, Minopoulou E, Chryssikos GD, Gionis V, Paipetis A, Panayiotou C (2003) Use of FT-NIR spectroscopy for on-line monitoring of formaldehyde-based resin synthesis. Eur Polym J 39:1533-1540
Dolezel-Horvath E, Hutter T, Kessler R, Wimmer R (2005) Feedback and feedforward control of wet-processed hardboard production using spectroscopy and chemometric modelling. New challenges for a maturing science. Anal Chim Acta 544:47-59
Fujimoto T, Kurata Y, Matsumoto K, Tsuchikawa S (2008) Application of near infrared spectroscopy for estimating wood mechanical properties of small clear and full length lumber specimens. J Near Infrared Spec 16:529-537
Gierlinger N, Schwanninger M, Wimmer R (2004). Characteristics and classification of Fourier-transform near infrared spectra of the heartwood of different larch species (Larix sp.). J Near Infrared Spec 12:113-119 Guntekin E, Karakus B. (2008) Feasibility of using eggplant (Solanum melongena) stalks in the production of experimental particleboard. Ind Crop Prod 27:354-358
Hein PRG, Sá VA, Bufalino L, Mendes LM. (2009a) Calibrations based on near infrared spectroscopic data to estimate wood-cement panel properties. BioResources 4(4):1620-1634
Hein PRG, Lima JT, Chaix G. (2009b) Robustness of models based on near infrared spectra to predict the basic density in Eucalyptus urophylla wood. J Near Infrared Spec 17(3):141-150
Jones PD, Schimleck LR, Daniels RD, Clark A, Purnell RC (2008) Comparison of Pinus taeda L. whole-tree wood property calibrations using diffuse reflectance near infrared spectra obtained using a variety of sampling options. Wood Sci Technol 42:385-400
Kelley SS, Elder T, Groom LH (2005) Changes in the chemical composition and spectroscopy of loblolly pine medium density fiberboard furnish as a function of age and refining pressure. Wood Fiber Sci 37:14-22 Kelly MW (1977) A critical literature review of relation particles between processing parameters and physical properties of particleboard. U.S. Forest Products Laboratory, Madison
Kent SM, Leichti RJ, Morrell JJ, Rosowsky DV, Kelley SS (2006) Analytical tools to predict changes in properties of oriented strandboard exposed to the fungus Postia placenta, Holzforschung 60:332-338
Kniest C (1992) Characteristic of urea resined wood particles by NIR spectroscopy. Holz Roh Werkst 50:73-78 Körner S, Niemz P, Wienhaus O, Henke, R (1992) Orientating tests for detecting the glue portion/wood particles ratio by means of FTIR-spectroscopy. Holz Roh Werkst 50:67-72
Maloney T M (1993) Modern Particleboard and Dry-process Fiberboard Manufacturing, 2nd edn. M. Freeman, San Francisco
Meder R, Thumm A, Bier H (2002) Veneer stiffness predicted by NIR spectroscopy calibrated using mini-LVL test panels. Holz Roh Werkst 60:159-164
Minopoulou E, Dessipri E, Chryssikos GD, Gionis V, Paipetis A, Panayiotou C (2003) Use of NIR for structural characterization of urea-formaldehyde resins. Int J Adhes Adhes 23(6):473-484.
Mora CR, Schimleck LR (2008) On the selection of samples for multivariate regression analysis: application to near-infrared (NIR) calibration models for the prediction of pulp yield in Eucalyptus nitens. Can J Forest Res 38(10):2626-2634.
Nemli G, Aydın A (2007) Evaluation of the physical and mechanical properties of particleboard made from the needle litter of Pinus pinaster Ait. Ind Crop Prod 26:252-258
Niemz P, Körner S, Wiehaus O, Flamme W, Balmer M (1992) Applying NIR spectroscopy for evaluation of the hardwood/softwood ratio and resin content in chip mixtures. Holz Roh Werkst 50:25-28
Niemz P, Dutschmann F, Stolken B (1994) Using NIR-spectroscopy for evaluating resin content in CHIP mixtures. Holz Roh Werkst 52:6-8
DIN 52362 (1982) Testing of wood chipboards, bending test, determination of bending strength. Normen für Holzfaserplaten Spanplatten Sperrholz
Pasquini C (2003) Near infrared spectroscopy: fundamentals, practical aspects and analytical applications. J Brazil Chem Soc 14(2):198-219
Raymond AC (2002) Genetics of Eucalyptus wood properties. Ann For Sci 59:525-531
Rials TG, Kelley SS, So CL (2002) Use of advanced spectroscopic techniques for predicting the mechanical properties of wood composites. Wood Fiber Sci 34:398-407
Rodrigues J, Alves A, Pereira H, Perez DS, Chantre G, Schwanninger M (2006) NIR PLSR results obtained by calibration with noisy, low-precision reference values: Are the results acceptable? Holzforschung 60(4):402-408 Savitzky A, Golay MJE (1964) Smoothing and differentiation of data by simplified least-squares procedures. Anal Chem 36(8):1627-1639
Shenk JS, Workman JJ, Westerhaus MO (2001) Application of NIR Spectroscopy to Agricultural Products. In: Burns DA, Ciurczak EW (eds) Handbook of Near-Infrared Analysis, Marcel Dekker Inc., New York, pp.419. Schimleck LR, Evans R (2004) Estimation of Pinus radiata D. Don tracheid morphologicalcharacteristics by near infrared spectroscopy. Holzforschung 58:66-73
Schimleck LR, Jones PD, Peter GF, Daniels RF, ClarkIII A (2004) Nondestructive estimation of tracheid length from sections of radial wood strips by near infrared spectroscopy. Holzforschung 58:375-381
Schimleck LR, Mora C, Daniels RF (2003) Estimation of the physical wood properties of green Pinus taeda radial samples by near infrared spectroscopy. Can J Forest Res 33:2297-2305
Tsuchikawa S (2007) A Review of Recent Near Infrared Research for Wood and Paper. Appl Spectrosc Rev 42: 43-71
Wang Z, Wang Y, Jiao Q (2004) Modern near infrared spectroscopic technique: a novel non-destructive method to test properties of wood-based panels. World For Res 17:22-24
Westad F, Martens H (2000) Variable selection in near infrared spectroscopy based on significance testing in partial least square regression. J Near Infrared Spec 8:117-124
Williams PC, Sobering DC (1993) Comparison of commercial near infrared transmittance and reflectance instruments for analysis of whole grains and seeds. J Near Infrared Spec 1:25-33
Workman JJ (2008) NIR spectroscopy calibration basics. In: Burns DA, Ciurczak EW (eds) Handbook of Near-Infrared Analysis, 3rd edn. CRC Press, Boca Raton, pp.123-150
Workman JJ, Weyer L (2007) Practical Guide to Interpretive Near-Infrared Spectroscopy. CRC Press, New York Xu X, Yao F, Wu Q, Zhou D (2009) The influence of wax-sizing on dimension stability and mechanical
Table 1 - Summary of the measured properties of agro-based particleboards including water absorption (WA24H, %) and thickness swelling (TS24H, %) after immersion for 24 hours, modulus of elasticity (MOE, N/mm²), modulus of rupture (MOR, N/mm²), and internal bond (IB, N/mm²).
Tabelle 1 - Gemessene Eigenschaften agrobasierter Spanplatten einschließlich der Wasseraufnahme (WA24H,%) und der Dickenquellung (TS24H,%) nach 24-stündiger Wasserlagerung, Elastizitätsmodul (MOE, N / mm² ), Biegefestigkeit (MOR, N / mm²) und Querzugfestigkeit (IB, N / mm²).
WA24H TS24H MOE MOR IB
Average 42.83 14.11 876.6 11.42 0.494 Min 8.36 2.55 493.3 5.043 0.162 Max 96.18 28.7 1,232.3 18.719 1.055 CV* (%) 45.2 39.6 19.8 25.9 37.9 No. of boards 126 126 126 126 100 * CV = coefficient of variation
Table 2 - Coefficients of variation (%) of the averaged values of laboratory determination of water absorption (WA24H) and thickness swelling (TS24H) after immersion for 24 hours (TS24H), modulus of elasticity (MOE), modulus of rupture (MOR), and internal bond (IB) by composition class of particleboards.
Tabelle 2 - Variationskoeffizienten (%) der gemittelten Werte für die Wasseraufnahme (WA24H) und Dickenquellung (TS24H) nach 24-stündiger Wasserlagerung, Elastizitätsmodul (MOE), Biegefestigkeit (MOR) und Querzugfestigkeit (IB) nach Spanplattenzusammensetzung.
Coefficient of variation (%) Composition
Class Resin WA24H TS24H MOE MOR IB
1-C75P25 16.3 7.2 4.1 4.6 7.5 2-C50P50 8.1 11.6 15.5 16.5 10.4 3-C25P75 12.7 15.8 20.2 18.6 15.9 4-C75E25 12.5 5.1 8.1 8.7 12.4 5-C50E50 25.9 11.5 9.4 11.8 12.2 6-C25E75 5.2 8.7 7.9 10.9 8.6 7-C100 Phenol-For maldehyd e 18.1 21.6 7.3 12.0 20.3 1-C75P25 18.1 8.6 6.5 12.4 - 2-C50P50 7.6 9.4 9.5 8.4 - 3-C25P75 11.0 14.1 16.0 16.7 - 4-C75E25 34.5 9.6 5.6 5.8 17.6 5-C50E50 24.8 8.6 7.8 8.3 13.8 6-C25E75 17.1 13.7 10.6 9.8 15.4 7-C100 Urea-Formaldehyde 22.0 8.7 12.4 13.1 14.9 Total average 16.7 10.8 10.1 11.3 13.5
Table 3 - NIR absorption bands assigned to cellulose, lignins, resins and water contained in agro-based particleboards. Numbers assigned to the bands and regression coefficients presented in Figures 3, 4 and 5.
Tabelle 3 - NIR-Absorptionsbanden von Cellulose, Lignin, Harz und Wasser in agro-basierten Spanplatten enthalten. Die Nummern beziehen sich auf die Banden und Regressionskoeffizienten in den Abbildungen 3, 4 und 5.
nm Bond vibration Structure Index Ref.
1170 2nd overtone asymmetric stretching CH, HC=CH Lignin 1 a
1360 CH deformation + CH stretching 2nd overtone CH3 - b 1410 OH stretching 1st OT lignin or first overtone of an O-H
stretching vibration of phenolic hydroxyl groups
Lignin 2 c
1417 C-H combination, aromatic associated C-H Lignin 2 a
1428 1st overtone OH stretching (amorphous region in cellulose) Cellulose - d
1470 1st overtone NH asymmetric stretching Resin 3 a
1485 1st overtone NH symmetric stretching Resin 3 a
1490 1st overtone OH stretching Cellulose 4 b,e 1500 1st overtone NH asymmetric + NH symmetric Resin 5 a
1548 1st overtone OH stretching (crystalline regions in cellulose) Cellulose - d
1672 1st overtone CH stretching Lignin 6 d 1685 1st overtone CH stretching (aromatic associated CH) Lignin 6 a,e
1724 1st overtone CH stretching Hemicellulose - d
1780 1st overtone CH2 stretching Cellulose 7 a,e
1820 OH stretching + CO stretching 2nd overtone Cellulose 8 a,b
1830 OH stretching + CO stretching 2nd overtone combination Cellulose 8 d 1940 OH combination of the asymmetric stretching and bending Water 9 a
1980 OH stretching + OH deformation combination band Water - d
1990 Asymmetric NH stretching + amide II combination band Resin 10 a 2040 Symmetric NH stretching + amide II Resin 11 a
2080 Asymmetric NH stretching + amide III Resin 12 a
2110 not assigned Resin 13
2180 Symmetric NH stretching +NH2 rocking and/or 2nd overtone
amide I + amide III Resin 14 a
2200 CH stretching and C=O combination Lignin 15 a 2220 Symmetric NH stretch + NH2 rocking Resin 16 f
2335 CH stretching + CH2 deformation combination band (and 2nd
overtone of CH2 streching)
Cellulose 17 a,(c) 2347 CH (1st overtone CH2 symmetric stretching and δ CH2)
combination
Cellulose 17 a 2352 CH bending and stretching combination band Cellulose 17 a
2461 CH stretching + CC stretching Cellulose - b
a Workman and Weyer (2007), b Schimleck and Evans (2004), c Shenk et al. (2001), d Fujimoto et al. (2008), e
Table 4 - Descriptive statistics, including average (Av.), standard deviation (SD), minimum (Min) and maximum (Max) values and number of averaged values (N) of the physical and mechanical properties for calibration and validation data sets.
Tabelle 4 – Statistische Werte der physikalischen und mechanischen Eigenschaften der für die Kalibrierung und Validierung verwendeten Proben: Mittelwert (Av.), Standardabweichung (SD), Minimal- (min) und Maximal- (Max)-Werte und die Probenanzahl (N)
Properties Calibration set Validation set
Av. SD Min Max N Av. SD Min Max N WA24H (%) 43.2 19.9 8.4 96.2 76 42.3 18.8 12.7 78.7 50
TS24H (%) 14.2 5.7 2.5 28.7 76 14.0 5.5 4.0 24.9 50 MOE (N/mm²) 878.5 175.4 493.3 1,232.3 76 873.6 172.3 502.3 1,159.2 50 MOR (N/mm²) 11.46 3.01 5.04 18.72 76 11.35 2.92 5.30 17.95 50 IB (N/mm²) 0.49 0.18 0.16 1.05 60 0.50 0.20 0.19 0.97 40
Table 5 - Summary of PLS-R models to predict the internal bond (IB, N/mm²), modulus of elasticity (MOE, N/mm²) and modulus of rupture (MOR, N/mm²) of agro-based particleboards.
Tabelle 5 - Zusammenfassung der PLS-R-Modelle zur Berechnung von Querzugfestigkeit (IB, N /mm²³), Elastizitätsmodul (MOE, N /mm²) und Biegefestigkeit (MOR, N / mm²) der agro-basierten Spanplatten.
Prop. PT LV R²c SEC SECV Outlier R²p SEP Outlier Bias RPD - 7 0.79 0.083 0.100 1 0.68 0.110 0 0.0009 1.8 1d 3 0.73 0.094 0.108 0 0.71 0.104 0 0.0016 1.9 IB 2d 2 0.70 0.098 0.105 0 0.73 0.097 1 -0.0024 2.0 - 5 0.57 112.5 122.6 3 0.62 106.1 0 -1.735 1.6 1d 5 0.67 99.5 111.3 4 0.52 125.7 1 0.5450 1.4 MOE 2d 2 0.46 127.1 133.8 2 0.42 131.9 0 0.6098 1.3 - 4 0.64 1.740 1.980 3 0.54 1.950 0 0.0158 1.5 1d 8 0.74 1.490 2.020 3 0.62 1.873 3 -0.0718 1.6 MOR 2d 5 0.65 1.740 2.146 2 0.58 1.814 3 -0.0427 1.6
PT - pre-treatment; 1d - first derivative; 2d - second derivative; LV - number of latent variables; R²c - coefficient of determination for calibration set; SEC - standard error of calibration (N/mm²); SECV - standard error of cross-validation (N/mm²); R²p - coefficient of determination for cross-validation set; SEP - standard error of prediction (or external validation) (N/mm²); and RPD - ratio of performance to deviation.
Table 6 - Summary of PLS-R calibration to predict water absorption after immersion for 24 hours (WA24H, %) and thickness swelling after immersion for 24 hours (TS24H, %) of agro-based particleboards.
Tabelle 6 - Zusammenfassung der PLS-R Kalibrierung zur Berechnung der Wasseraufnahme (WA24H,%) und der Dickenquellung (TS24H,%) von agro-basierten Spanplatten nach 24-stündiger Wasserlagerung
Prop. PT LV R²c SEC SECV Outlier R²p SEP Outlier Bias RPD - 6 0.72 9.85 11.37 2 0.72 9.85 0 0.1925 1.9 1d 5 0.74 9.40 11.35 2 0.70 10.20 2 0.4694 1.8 WA24H (%) 2d 6 0.76 8.97 11.66 2 0.66 11.13 3 -0.1511 1.7 - 8 0.76 2.80 3.37 1 0.64 3.22 0 -0.0966 1.7 1d 6 0.82 2.42 2.73 2 0.75 2.64 4 0.0135 2.1 TS24H (%) 2d 8 0.8 2.45 2.96 2 0.68 3.03 2 0.0194 1.8
PT - pre-treatment; 1d - first derivative; 2d - second derivative; LV - number of latent variables; R²c - coefficient of determination for calibration set; SEC - standard error of calibration (%); SECV - standard error of cross-validation (%); R²p - coefficient of determination for cross-validation set; SEP - standard error of prediction (or external validation) (%); and RPD - ratio of performance to deviation.
Fig. 1 - Schema of the experimental design Abb. 1 - Versuchsplan
Fig. 2 – (A) Standard dimensions of test specimens (mm) obtained from each panel for physical and mechanical properties determination and NIR scanning. Physical properties: Water absorption (WA24H) and thickness swelling (TS24H) after 24 hour immersion;
mechanical properties: modulus of elasticity (MOE), modulus of rupture (MOR), and internal bond (IB). (B) Specimen used for NIR scanning.
Abb. 2 – (A) Standardabmessungen der aus den Platten entnommenen Prüfkörper (mm) zur Bestimmung der physikalischen und mechanischen Eigenschaften und NIR-Messungen. Physikalische Eigenschaften: Wasseraufnahme (WA24H) und Dickenquellung (TS24H) nach 24-stündiger Wasserlagerung; mechanischen Eigenschaften: Elastizitätsmodul (MOE), Biegefestigkeit (MOR) und Querzugfestigkeit (IB). (B) Prüfkörper für NIR-Messungen.
Fig. 3 - Absorbance versus wavelength plot for an untreated NIR spectrum and first and second derivative of the NIR spectrum showing bands assigned to chemical compounds. The scaling factor of the secondary y-axis derivatives was of 10-2. The bands assigned to lignin are shown by squares, to cellulose by full circles, to water by dotted circles and to resins
(adhesives) by triangles.
Abb. 3 - Absorption in Abhängigkeit der Wellenlänge eines NIR-Spektrums und deren erste und zweite Ableitung sowie der den chemischen Verbindungen zugeordnete Banden. Der Skalierungsfaktor der rechten y-Achse für die Ableitungen ist 10-2. Die dem Lignin
zugeordneten Banden sind durch Quadrate dargestellt, diejenigen für Cellulose durch ganze Kreise, diejenigen für Wasser durch gestrichelte Kreise und für Harze (Klebstoffe) durch Dreiecke.
Fig. 4 – (A) NIR predicted versus measured values plot for internal bond (IB) based on the second derivative of NIR spectra, for both calibration (open circles) and validation sets (filled circles); and (B) regression coefficients for PLS model predicting IB.
Abb. 4 - (A) Querzugfestigkeit (IB) berechnet auf Basis der zweiten Ableitung der NIR Spektren in Abhängigkeit der gemessenen Werte. Offene Kreise: Kalibrierungsdaten, gefüllte
Kreise: Validierungsdaten. (B) Regressionskoeffizienten für das PLS Modell zur Berechnung der Querzugfestigkeit IB
Fig. 5 – (A) NIR predicted versus measured values plot for thickness swelling after 24 hours (TS24H) based on the first derivative of NIR spectra, for both calibration (open circles) and validation sets (filled circles); and (B) regression coefficients for PLS model predicting TS24H.
Abb. 5 - (A) Dickenquellung (TS24H) nach 24-stündiger Wasserlagerung berechnet auf Basis der ersten Ableitung der NIR-Spektren in Abhängigkeit der gemessenen Werte. Offene Kreise: Kalibrierungsdaten, gefüllte Kreise: Validierungsdaten; (B) Regressionskoeffizienten für das PLS Modell zur Berechnung der Dickenquellung (TS24H)