Publisher’s version / Version de l'éditeur:
Indian Journal of Engineering and Materials Sciences, 3, pp. 63-69, 1996-04-01
READ THESE TERMS AND CONDITIONS CAREFULLY BEFORE USING THIS WEBSITE.
https://nrc-publications.canada.ca/eng/copyright
Vous avez des questions? Nous pouvons vous aider. Pour communiquer directement avec un auteur, consultez la
première page de la revue dans laquelle son article a été publié afin de trouver ses coordonnées. Si vous n’arrivez pas à les repérer, communiquez avec nous à PublicationsArchive-ArchivesPublications@nrc-cnrc.gc.ca.
Questions? Contact the NRC Publications Archive team at
PublicationsArchive-ArchivesPublications@nrc-cnrc.gc.ca. If you wish to email the authors directly, please see the first page of the publication for their contact information.
NRC Publications Archive
Archives des publications du CNRC
This publication could be one of several versions: author’s original, accepted manuscript or the publisher’s version. / La version de cette publication peut être l’une des suivantes : la version prépublication de l’auteur, la version acceptée du manuscrit ou la version de l’éditeur.
Access and use of this website and the material on it are subject to the Terms and Conditions set forth at
Hydration of ordinary Portland cement/high alumina cement pastes
containing phosphonate compounds
Gu, P.; Beaudoin, J. J.; Ramachandran, V. S.
https://publications-cnrc.canada.ca/fra/droits
L’accès à ce site Web et l’utilisation de son contenu sont assujettis aux conditions présentées dans le site LISEZ CES CONDITIONS ATTENTIVEMENT AVANT D’UTILISER CE SITE WEB.
NRC Publications Record / Notice d'Archives des publications de CNRC: https://nrc-publications.canada.ca/eng/view/object/?id=0cace62e-a996-4968-98d4-ecfb396092e3 https://publications-cnrc.canada.ca/fra/voir/objet/?id=0cace62e-a996-4968-98d4-ecfb396092e3
http://www.nrc-cnrc.gc.ca/irc
H ydra t ion of ordina ry Port la nd c e m e nt /high a lum ina c e m e nt pa st e s
c ont a ining phosphona t e c om pounds
N R C C - 3 9 2 4 8
G u , P . ; B e a u d o i n , J . J . ; R a m a c h a n d r a n , V . S .
A p r i l 1 9 9 6
A version of this document is published in / Une version de ce document se trouve dans:
Indian Journal of Engineering and Materials Sciences, 3, pp. 63-69, April 01,
1996
The material in this document is covered by the provisions of the Copyright Act, by Canadian laws, policies, regulations and international agreements. Such provisions serve to identify the information source and, in specific instances, to prohibit reproduction of materials without written permission. For more information visit http://laws.justice.gc.ca/en/showtdm/cs/C-42
Les renseignements dans ce document sont protégés par la Loi sur le droit d'auteur, par les lois, les politiques et les règlements du Canada et des accords internationaux. Ces dispositions permettent d'identifier la source de l'information et, dans certains cas, d'interdire la copie de documents sans permission écrite. Pour obtenir de plus amples renseignements : http://lois.justice.gc.ca/fr/showtdm/cs/C-42
Indian Journal of Engineering & Materials Sciences
Vol. 3, April 1996, pp. 63-69
Hydration of ordmary Portland cement/high alumina cement pastes
containing phosphonate compounds
PingQu,JJb・。オセッゥョ &V S Ramachandran
Materials Laboratory, Institute for Research in Construction, National ResearchCouncil Ottawa,Ontario, Canada, KIAOR6
Received 28 June 1995; accepted 6 October 1995
The hydration process of ordinarylPortiand c.ement (OPC)-high alumina cement (HAC) paste sys-tems with and without the phosphonate compounds, aminotri(methylene-phosphonic acid) (AlMP),
I-hydroxyethylidene-l, l-diphosphonic acid.(HEDP) and diethylenetriaminepenta
(methylene-phos-phonic acid) (DTPMP), was investigated using conduction calorimetric and impedance
measure-ments. Conduction calorimetry provides relevant data on the heat development characteristics of the cement hydration reactions and the impedance spectroscopy characterizes changes in the micros-tructural development and ionic concentration of the pore solution resulting from the hydration
reactions. The presence of 0.05% phosphonatehas little effect on the OPCIHAC paste system. At
the 0.2% level, a reduction in the rate of heat evolution is observed. This indicates that the phos-phonate compounds interfere with the gypsum-cement reactions especially in the pastes containing
0.2% AlMP andHEDP resulting in Portland cement hydration (mainly the
e,s
and C,S phases)re-tardation inailOPCIHAC blended system.
Concrete admixtures are integral constituents of concrete. They play a significant role in modem concrete technology. An understanding of me-chanisms of admixture interaction in cement and concrete systems is useful for optimization of mil( design. It can also be of significant benefit in identification of alternative applications for con-crete. Recently, phosphonate compounds have at-tracted attention because of their super-retarding capability with respect to ordinary portland ce-ment (OPC) and high alumina cece-ment (HAC) hy-dration. Phosphonate compounds,
amiriotri(meth-ylene-phosphonic acid)(ATMP),
l·hydroxyethyli-dene-I, l-diphosphonic acid) (HEDP), and
dieth-ylene-triamiriepenta(methylene-phosphonic acid)
(DTPMP), appear to' be much more efficient
re-tarders than many others used in concrete
prac-ticet-3.
It is known that the setting of OPC blended with HAC is accelerated. The setting time varies with the proportion of these two cements". This special pr6pertyhas been useful in various applic-ations including sealing of leaks, production of em-ergency bulkheads to seal off mine fires, rapid wall and road pavement repair. These blends pro-vide strength within few hours. However, relat-ively poor strength development and sulphate
re-sist\Ulce is observed at later times'. OPC/HAC paste systems have been studied using high fre-quency ac impedance spectroscopy (ACIS)··7 and conduction calorimetryS to characterize the
hydra-tion process.In this study, these investigations are
extended to OPC/HAC paste systems containing phosphonate compounds. The primary objective
is to develop new and effective admil(tures for·
OPC/HAC based repair materials using phos-phonate.
Experimental Procedure
The OPC and HAC (Fondu) used in this study was obtained from the St. Mary's Cement Co.
The chemical composition is given in Table 1.
The phosphonate compounds used were manu-factured and supplied by Monsanto Chemical Co. . (St. Louis, Missouri, USA). Three phosphonate Table I-Cbemical composition (mass,%)of OPC'(Type 10)
and HAC
Cao Al,O, SiO, ·Fe,O, MgO SO, Na,O K,O OPe 62.49 4.05 21.82 2.77 3.69 2.48 0.12 0.44 HAC 38.50 39.00 4.50 12.00 0.60 0.15 0.10 0.15 'This is similar toType 1cement 01 ASTM and Type 10 cement of CanadianStandard AS.
64 INDIAN 1. ENG. MATER. SCI., APRIL 1996
"
1 5 . - - . , , - - - ,'2
Hydndlontime,h
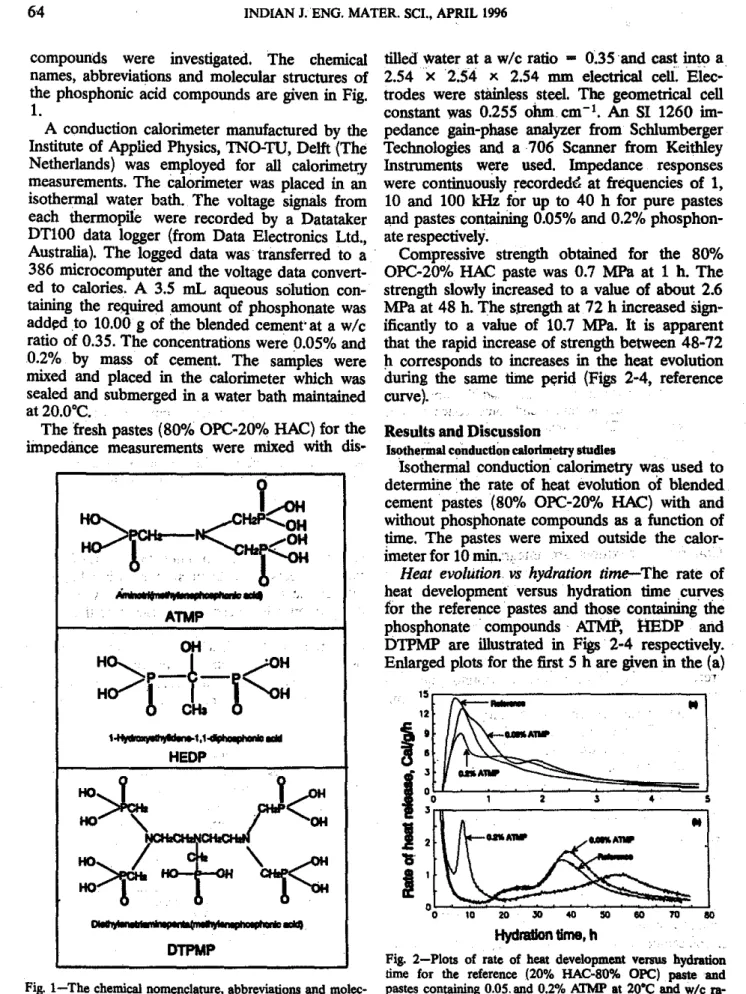
Fig. 2-Plots of rale of heat development ve... hydration time for the reference (20% HAC-SO% OPC) paste and pasles containing 0.05. and 0.2% ATMP at 20·C and wlc ra-tio - 0.35. (a) enlarged plot for the first 5 h; and (b) ex-lended plot up to 70 h . . . .
Results and Discussion
Iaothennal conductlim calorimetry studt..
IsothemiaI conduction calorimetry was used to determine the rate of heat evolution of blended cement pastes (80% OPC-20"10 HAC) with and without phosphonate compounds as a function of time. The pastes were mixed outside the calor-imeterfor 10
min.·.··
Heat evolution vs hydration time-The rate of heat development versus hydration time curves for the reference pastes and those containing the phosphonate .compounds' ATMP, f1EDP and DTPMP are illustrated in Figs 2-4 respectively. Enlarged plots for the first 5 h are given in the (a)
. ' : j l
.
Y,AH
セ
Ami...'...""""'... "ATMP
OH 'Z^イセMゥMイセZ
11 ...PゥエIゥセNQNQTーィッᆬゥoi . . .HEDP
Zセ
y<:
OM:>t"
c
Iio
fl',<:
DIII.,...
..,..IIa(i...-*'DTPMP
compounds were investigated. The chemical tilledwater at a w/c ratio - 0.35 and cast into a names, abbreviations and molecular structures of 2.54 x 2.54 x 2.54 mm electrical ceU::Elec-the phosphonic acid compounds are given in Fig. trades were stilin1ess steel. The geometrical cell
1. constant was 0.255 ohm cm-I . An SI 1260
im-A conduction calorimeter manufactured by the pedance gain-phase analyzer from Schlumberger Institute of Applied Physics, lNO-TU, Delft (The Technologies and a 706 Scanner from Keithley Netherlands) was employed for all calorimetry Instruments were used. Impedance responses measurements. The calorimeter was placed in an were continuously recordedd at frequencies of I, isothermal water bath. The voltage signals from 10 and 100 kHz for up to 40 h for pure pastes each thermopile were recorded by a Datataker and pastes containing 0.05% and 0.2% phosphon-DTI00 data logger (from Data Electronics Ltd., ate respectively.
Australia). The logged data was' transferred to a' Compressive strength obtained for the 80% 386 microcomputer and the voltage data convert- OPC-20% HAC paste was 0.7 MPa at 1 h. The ed to calories. A 3.5 mL aqueous solution con- strength slowly increased to a value of about 2.6 taining the required amount of phosphonate was MPaat 48 h. The strength at 72 h increased sign-addlld to 10.00 g of the blended cement' at a w/c ificantly to a value of 10.7 MPa. It is apparent ratio of 0.35. The concentrations were 0.05% and that the rapid increase of strength between 48-72 0.2% by mass of cement. The samples were h corresponds to increases in the heat evolution mixed and placed in the calorimeter which was during the same time セイゥ、 (Figs 2-4, reference sealed and submerged in a water bath maintained curve).' '"
at20.0°C. Ii "L
The fresh pastes (80% OPC-20"/0 HAC) for the impedance measurements were mixed with
dis-Fig. I-The chemical nomenclature, abbreviations and
molec-ular structures ofthephospbonate admixtures usedinthis
PING GUet al.:HYDRATION OF OPC/HAC PASTE SYSTEMS 65
..
QNイMセMMZ]]]⦅MMMMMMMBB..
..
....
-15r====:---.,.,.,
..
f:
I
:ou.-.--===:::.=:::::;.::::::::::::.=J.
J
'15. •
I
セoセセセセRPセセQZZZZTP[ZZZZZZ
..
[[セエNj
..
Hydlldlc....time. h HydndIon
time.
hFig. 3-Plots of rate of heal developmenl verous hydration
time for the reference (20% HAC-Sot. OPC) paste and paotes containing 0.05 and. 0.2% HEDP al 20'Candwle ra-tio - 0.35. (a)enlarged p10l for the first 5 h;and (b)
ex-. tended p10l upto70 h
Fig. 4-PIoI8 of IllIe of heat developllleDl vell1lS hydration time for the' reference (20% HAC-SO% OPC) paote and pastes containing 0.05 and 0.2% DTPMP al 20'C andwle ra-lio - 0.35. (a) enlarged p101 for the firsl 5 h; and (b)
ex-tended plOI upto70 h
Table 2-Characterizaiion of the conductio'; caIorimetIy peaks fo;hydratiog OPc!HAc blendedsystems
SO% OPC- Paste Pasle ' Pasle Paste Paste Pasle
20% HAC containing containing containing eonlaining containing' containing
cemenl 0.05% 0.2% 0.05% 0.2'1, 0.05% 0.2%
paste ATMP ATMP HEDP HEDP DTFMP DTFMP
i'eak I 30 min; 30 min; 30min; 30min;. 30 min; 30 min; 30 min;
13.7 caVgIIi 12.6 caVg/h 9.0 ealig/h 14.4 caVg/h 12.S caVg/h 14.5 caVg/h 10.6 eallg/h i'eakH
i'eakm (or sboulder) i'eakIV
nolelearly Dol.clearly S.Ih: notelearly 9.5h; nOlelearly nOlelearly
dellDea- defined definCd' defined aellned defined
'25h; :lSh; nOlelearly nolelearly nblelearly 25h: nOlelearly 0.5ScaVg/h 0.64caVg/h defined defined defined 0.59caVg/h , defined
37.6 h; 39h: 55h; 53h; 62.6h; 3S.Sh; SOh;
1.47caVg/h 1.7caVg/h 0.99caVg/h 1.35 caVg/h 0.73caVg/h l.46caVg/h 1.0caVg/h
/ '
part
of
thefigures.
Extended plots including dataup to 70 h are given in the (b) part of the figures. The reference curves (Figs 2-4), indicate that rate
of heat evolution reaches a
maximum
at about 20min corresponding to a value of 13.7 caVgIh. The . rate then decreases to about 4-5 caVgIh at 1 to
1.5 h where a slight shoulder peak is observed.
The rate continuously decreases to near zero and
begins to increase at 15 h. A further incn!ase in
the rate, is also observed at 30 h leading to
a
max-imum (Co. 1.4 caVgIh) at 40 h. Subsequently, the rate decreases to a value approaching zero;
The rate of'heat evolution curves for pastes containing phosphonate compounds (Figs 2-4) have some similarities to that of the reference curve. They all display a first maximum rate of
heat releasl1 at about 30 min; the pastes
contain-ing a high dosage Qf admixture have a, smaller
maximum value. Peak v8lueS
of
2.7 and 0.7 caVgIh
are recorded at' 5-10 h hydrationOmci
forpastes containing 0.2% AlMP. and HEDP re-spectively. The rate of heat release curve then decreases quickly to a minimum at 15-20 h and slowly increases to a maxinium at 55-60 h. Con-duction calorimetry peaks for the systems studied are charactetizedin Table 2 for comparison. Four
different rates
of
heat development peaks orshoul-der peaks can be_ゥ、・ョエゥヲゥセ。ウ follows:
Peak I-Itbeginswhen cement is in contact with water and a maximum is reached at about 30 min with' an amplitude ranging from 9-15 caVgIh. It sometimes shows a shoulder with an amplitude of
66 INDIAN J. ENG. MATER. SCI.. APRIL 1996
;-,
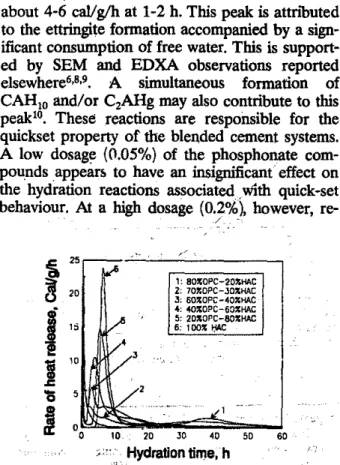
Fig.. 5-Plots of rate of heat.development versus
hyd;ation
time for OPCIHAC pastescontaining various percentages of HAC ranging between 20-100 B.20·C up.o 60 h (w/cratio
=0.40). The numbers repre,ent -( I) pM.e, containing 20% HAC; (2) 30%, (3) 40%, (4) 60%,HUIᄋXPᄋOセHVI pure HAC
, ' .1
about 4-6 callg/h at 1-2 h. This peakisattn'buted
to the ettringite formation accompanied by a
sign-ificant consumption of free water. This is
support-ed by SEM and EDXA observations reportsupport-ed
elsewhere6,8,9. A simultaneous formation of
CAHIOand/or C2AHg may also contribute to this
peaklO• These reactions are responsible for the
quickset property of the blended cement systems. A low dosage (0.05%) of the phosphonate com-pounds appears to have an insignificant effect on the hydration reactions associated. with quick-set
behaviour. At a high dosage (0.2%), however,
re-/ '
duction in the rate of heat evolution is clearly
seen.
Peak II-This peak is relatively' sharp and ap-pears at 3·10 h. It occurs in both pastes contain-ing 0.2% ATMP and HEDP. This peak appears to be related to the HAC hydration process as illus-trated in Fig. 5 where the conduction calorimetric curves for pure OPC, HAC and OPC/HAC sys-tems are plotted. The characteristic peak of HAC hydration at 3-10 h is observed in all pastes con-taining more than 30%. of HAC. The, rate Pi. heat evolution increases with an increase of HAC in the
blend. This peak is not observed for the 20%
HAC-80% OPC paste andisattributable to the
for-mation of calcium aluminate from the HAC. It
is reasonable to assume that at low HAC
con-tent, it will first hydrate to form ettringite in the early period and less HAC is available to exhibit
the peak at 3·10 h. The occurrence of peak
n
inthose pastes containing 0.2% of A:I'MP and
HEOP indicates the presence of excess of HAC. A high dosage (0.2%) of phosphonate compounds apparently reduces the gypsum reactivity resulting in less ettringite formation, so that some HAC is available. to form calcium aluminate hydrates at
3-10 h. At 0.2%A:I'MPlower peak intensity at early
times indicates less ettringite formation.
Peak
m;..
This appears to be a shoulder peakthat merges with peak IV occurring at approxi-mately 38 h. It usually starts at 15-20 h. and reaches a maximum at about 25 h with a value of 0.5-0.6 callg/h. This peak may relate to an
ettrin-. \ 60 1: 80l{OPC-20nHAC 2: 70nOPC-JoXHAC J:60::COPC-40XHAC 4: 4O:COPC-60:CHAC 5: 20nOf'C-80nHAC 6: tOO"":lAC 2 J 10 20 JO 40 50 '''' Hydration time,h
"-'.'
,i
25 cJ 20i "
1
10 z: 'IS 5I
Fig.6-SEM microgmphs ( x 5400) taken from an 80%OPC- . 20%HAC pMte (B) B' 30 min, (b) B' 8 h, (C)B' 24 h and (d) B'
'67 70 80 (0) 50 40 50 '0
-'0 0§
0 10 '0 '0 '0 '0 80 10 80 80 50 (.)1
'0 30i!
'0...
...
-f
'0 0 0 '0 '0 50 .0 ᄋセdᄋ liP 10 80 10 '0 «) '0 '0 30 '0 n """" '0 0 0 '0 '0 30, .0 '0 .0 70 80 '50イ[[[ZZZMMMMMMMMMMBGtBBGセMMML fi '00セセセBG⦅BG⦅BBBBBB⦅
_.'OO<HZ .E: - 10KHZ E lSQ ••• 1KHZ:IS
tOOI :
;'0MセMM[ZGo[MセMBBGLセoMセMセSoZMMMMNj HydrationOme,h Hydration time,hpedance and conduction calorimetry measure-ments enhances understanding of the hydration mechanism in the OPCIHAC paste system.
20% HAC-80% OPC paste-The curves of im-pedance vs hydration time for 20% HAC-80%
OPC paste at w/c = 0.35, recorded at various
frequencies are illustnlted in Fig. 9. They are charllcterized by a rapid increase of impedance at about 50 min followed by a decrease and a
rela-tive plateau region to 15 h of hydration. A second
rapid decrease of impedance is followed by a sec-ond plateau. The impedance value eventually in-creases again as hydration continues beyond 40 h8. This is quite different from previous data for systems prepared at higher w/c·. The w/c ratio,
Fig. 8,...Plots of total heat evolvedVer8ua hydration time for the reference paste (20% HAC-80% OPC) and pastes con-tainingvarious concentrations of ,phosphonate compounds at 20"C and wlc ratio - 0.35. (atATMP; (b) HEDP and (c)
DTPMP '
Fig. 9-Impedance response vs. hydration time for 20% HAC-80% OPC pastes prepared atwlc - 0.35 PING GUet al,: HYDI\ATION OF OPC/HAC PASTE SYSTEMS
o 10 15 20 25 30 35 40 45 50 5560
2B,d@9
gite-monosulphoalwitinate transformation. SEM micrographs of an 80% OPC-20% HAC paste at 30 min and 48 h (Figs 6a-6d) reveal a morpho-logical change in the hydration products from needle-like to plate-like. The conversion is
possi-ble even though the solubility of ettringite (1.1
x
10-40 moIIL) is less than that of
monosulphoalu-minate(1.7
x
QWセRXュッャャlIQャas
gypsum is in Iimitedamount in the studied system.
Peak IV-OPC hydration is responsible for Ibis
peak occurring at 38h or later". It has a maxi-mum value of about 1-2caVgIh. X-ray diffraction analysis, was used to' determine the presence of Ca(OHh in a 20% HAC-80% OPC paste
hydrat-ed 24 and 48 h. There was no clear evidence of
a Ca(OHh peak at 24 h.
A
Ca(OHh peak wasdetectable at 48 h (Fig. 7). The formation of lime
isaitributed to the hydration ,of
e.s
andc,s.
Phosphonate compounds (0.05%) show a small retardation effect on OPCIHAC paste hydration (except HEDP which exhibits a further delay of
Ileaks mandIV).Asignificant delay ofpeakIVto
50-,62.6 h occurs at 0.2% phosphonate content
(Table 2). '
Total heat evolutiim-The plots of total heat evolved versus hydration time for. the reference paste and those containing various concentrations ofATMP, HEDP and DTPMPwe given
in
Figs 8a-8c respectively. A 'comparison at 72 h reveals that the pastes containing ATMP have the .largest amount of total heat release (62.6 and 60.8 callg) among the three admixtures. 'Those containing HEDP possess the lowest values, 55.9 and 43.0 callg, for dosages of 0.05 and 0.2% respectively.Impedance meuurements
Impedance measurements provide a means of characterizing the microstructural development and changes in ionic concentration of pore' solu-tion in blended cement systems. Combining
im-Fig. 7-X-ray diffraction traces for an 80% OPC-20%HAC paste at hydration times of (a) 24 h, and (b) ,48 h. The wlc
ratio isHINUPセ Symbols representing various phases are(0) C3S, (e) C,S, (x) CA, (+) C,A, (.0.) Ettringite, ('A,)
68 INDIAN J. ENG. MATER. SCI., APRIL 1996 quality of mixing water and composition of the
cement are major influencing factors since they affect the microstrucfural development and ionic concentration of the pore solution. There are also significant microstructural differences in pastes
with w/c
<
0.4012• These include permeability.
pore continuity, etc.· . .
Pastes containing 0.05%phosphonate-Plots of impedance versus hydration time for 20% HAC-80% OPC pastes containing 0.05% A1MP, HEDP and DTPMP are given in Figs lOa-c, respectively. The impedance behaviour for all pastes is very
si-milar.Italso shows a rapid increase of impedance
at about 50 min followed by a decrease and a plateau. A second decrease of impedance occurs at 10 h and the second plateau at 15 to 30 h. The paste impedance then slowly increases as hydra-tion continues.
Pastes containing 0.2%phosphonate-The im-pedance of pastes containing 0.2% AlMP, HEDP and DlPMP is given in Figs lla-c respectively. A
high phosphonate dosage results in a longer
in-duction period and a deiay in the appearance of first peak in the impedance curves. A second peak is recorded in the pastes containing 0.2%
A1MPand HEDP. The curve for DTPMP is
simi-lar to those for pastes containing the low dosage.
The impedance-hydration time curves can be
sub-divided into four periods-(l) an induction period. The reference paste and pastes containing 0.05% phosphonate have a 45"50 min induction period. The high dosage pastes have a longer in-duction period of 2.5 h; (2) this period covers the hydration time immediately after the rapid rise in impedance to the end of first plateau. The refer-ence paste and pastes containing 0.05% phos-phonate undergo a rapid increase in impedance at 0.75·1.5 h reachiJ:).g a maximum value at 1.5·2 h.
The rapid increase· of impedance (Figs lOa-c)
corresponds to the first rate of heat release peak in conduction calorimetry studies (Figs 2-4), in concert with densification of the pastes and con-sumption of free water due to the formation of
ei-tringite, CAHIO and/or C2AH•. It· is noted that
the changes in microstructure and ionic concen-tration of pore solution are always recorded later than the heat release event itself. Differences in the impedance versus time curves for· the pastes containing 0.2% A1MP and HEDP may be attri-buted to the hydration of HAC as indicated by the relatively sharp rate of heat release peak (TI); (3) this period includes a decrease in paste im· --pedance at 10-15 h and a plateau at 10-30 h. The decrease in impedance is explained in terms of
-·100KHZ -10KHZ ···1KHZ 10 20
'"
- - 100KHZ..
ii
'00 -10KHZ .5 150 • _. 1KHZ E .<: 100 01
so. 11:. 00 10 '0 JO .0 .00 - - 100KHZ .JOO - 10KHZ ···It<HZ '00 100 0 '0 JO '0 0 10 Hydration time, h '0 _. 100KHZ - 10KHZ ... 1KHZ JO '0 Hydration time, h 10 0-iセ
_. 100KHZ 0 - 10KHZ MNZZZZZNセセNMMN •.. 1KHZ 0 0 セセN o o 10 ot:-_ _セ ⦅ セ ⦅ セ N セ ⦅ M ] M__
...J o 10 20 30 40 .0o
0セ
-M⦅セL ⦅Nッセ]
__
30 40 SPPMセMM-g
セ --100KHZセ
:::
iGセセセBLLMM
セ ZZZセG
1
.'0
'0Fig. lO-lmpedance response vs. hydration time for 20%
HAC-80%OPC pastes containing 0.05%(bymass) phosphon-ate-tal ATMP, (b) HEDP, and (c) DTPMP. Pastes prepared
atwlc セ 0.35
Fig. ll-Impedance response VS, hydration time for 20%
HAC-80%OPC pastes containing 0,2%(by mass) phosphon-ate--(a) ATMP,(b)HEDP,and(c) DTPMP. Pa,tes prepared at
PING GU et 01.: HYDRATION OF OPC/HAC PASTE SYSTEMS 69
Conclusions
Impedance spectroscopy and conduction calor-inletry are effective complimentary tools for
in-vestigating changes in the hydration process of blended OPCIHAC systems. Low dosages of phosphonate admixtures generally appear to have
little effect on the hydration reactions in opcセ
HAC binary cement systems associated with quick-setting phenomena, e.g., ettringite formation and sinlUltaneous hydration of HAC and OPC. Higher dosages of phosphonate admixtures (0.2%) substantially reduce the rate of heat release asso-ciated with ettringite formation and sinlUltaneous
hydration of HAC in OPC-HAC binary cement
systems. OPC hydration is significantly retarded. Acknowledgement
Thanks are due to M S Lowery, G M Polomark, B Myers, Ed Quinn and Gordon Chan for their help with the experimental work..
References
1 Ramachandran V S, Lowery M S, Wise T & Polomark G M, Mater Struc4 28 (1993) 425.
2 Ramachandran V S& Lowery M S, Effect of
phosphot>-Qte--based compound on thehydration of cement and
ce--ment components, 4th Int Coni on Superplasticizers and
other Admixtures in Concrete, ACI Special Publication
(SP)-148 (1994) 131.
3 Ramachandran V S&WiseT,II Cementa, 92HQYYセI 3.
4 Lea F M& Desch C H, The chemistry ofcement and concrete, Chapt XVI, (Butler & Tarmer Ltd., Frome and London) 1956,426.
5 RobsonTD, ChemInd, 1(1951)2.
6 Gu Ping, F\1 Yan, Xie Ping & Beaudoin J J,J Mater Sci Lett,12 (1993) 1771.
7 Gu Ping, Ramachandran V S, BeaudoinJJ& Quinn Ed, JAdv Cement Based Mater(1995)(In press).
8 Gu Ping Beaudoin J J, Conduction Calorimetry Charac-terization of Physical and Chemical Changes in Ordinary Portland CementlHigh Alumina Cement Pastes Early Hy-dration Times", Submitted to JMaters」セ (1995).
9 Gu Ping, F\1 Yan, Xie Ping & Beaudoin J J, Cem Caner Res,24(4), (1994)682. .
10 BenstedJ, Cem Cone Res, 25(1),(1995) 222.
11 ZhangF,ZhouZ&LouZ,Proc7thIntCongressontheChern-istryofCemen4VollI,Paris, (1980)ll88.
12 Ramachandran V S, Feldman R F& Beaudoin J J, Concrete science,Chaps 1-3 (Heyden & SonInc,PA USA), (1981) 1. .
13 eottinB F, Proc7/hlnlCongresson theChemistryo/Cement,
VollII, Paris, (1980) V1l3. . 14 GuPing RamachandranVS&BeaudoinJJ,MaterSciLerr, 14 (1995) 503. 8.0 12-30 12-26 12-42
Table 3-Comparison of theretardingeffect of phosphonatesin a cement paste
Induction period Time of max. heat
h development, h 2.2 3.4-10.1 3.8-13.2 3.5-21.1 Mass percentage of エィセ additives Reference HEDP 0.03-0.05% ATMP 0.03-0.05% DTPMP 0.03-0.05%
the dissolution ofcalcium hydroxide generated by
Portland cement hydration13.and
ettringitte-mono-sulphoaluminate conversions. Conduction
calorime-try results (Figs. 2-4,peaks ill and IV) support
this argument;14)the last period includes a slight
increase of inlpedance as hydration time, conti-nues beyond 35 h. The continuous hydration of
C3S and C.S results in a denser matrix,
Densifica-tion of the paste is then reflected in an increasein
impedance. The inlpedance behaviour of the
pastes containing thehigh dosage (0.2%) of
phds-phonate does not exhibit distinct periods (3) and (4) (except 0.2% DTPMP). This phenomenon is related to the strong retardation effect of the phosphonates (see the rate of heat release curves, Figs 2-4).
Previous research has revealed that the phos-phonate compounds, XfMP, HEDP and DTPMP, 'have super-retarding effects on Opcl.2. The in-duction period determined by conin-duction calor-inletry increases from 3 to 21 h and the time of maximum heat development from 12 to 42 h at 0.03-0.05% concentration (Table 3). These phos-phonate compounds have a super-retarding effect on OPC since the setting usually occurs at a peri-od between the end of induction periperi-od and the time of maximum heat evolution. However, they have a limited retarding effect for pure HAC paste systems as revealed by inlpedance spectros-copy14.