HAL Id: hal-00302112
https://hal.archives-ouvertes.fr/hal-00302112
Submitted on 14 Sep 2006HAL is a multi-disciplinary open access
archive for the deposit and dissemination of sci-entific research documents, whether they are pub-lished or not. The documents may come from teaching and research institutions in France or abroad, or from public or private research centers.
L’archive ouverte pluridisciplinaire HAL, est destinée au dépôt et à la diffusion de documents scientifiques de niveau recherche, publiés ou non, émanant des établissements d’enseignement et de recherche français ou étrangers, des laboratoires publics ou privés.
Classification of aerosol properties derived from
AERONET direct sun data
G. P. Gobbi, Y. J. Kaufman, I. Koren, T. F. Eck
To cite this version:
G. P. Gobbi, Y. J. Kaufman, I. Koren, T. F. Eck. Classification of aerosol properties derived from AERONET direct sun data. Atmospheric Chemistry and Physics Discussions, European Geosciences Union, 2006, 6 (5), pp.8713-8726. �hal-00302112�
ACPD
6, 8713–8726, 2006 Aerosol properties derived from AERONET data G. P. Gobbi et al. Title Page Abstract Introduction Conclusions References Tables Figures J I J I Back CloseFull Screen / Esc
Printer-friendly Version Interactive Discussion
EGU
Atmos. Chem. Phys. Discuss., 6, 8713–8726, 2006 www.atmos-chem-phys-discuss.net/6/8713/2006/ © Author(s) 2006. This work is licensed
under a Creative Commons License.
Atmospheric Chemistry and Physics Discussions
Classification of aerosol properties
derived from AERONET direct sun data
G. P. Gobbi1, Y. J. Kaufman2, I. Koren3, and T. F. Eck4,2
1
Inst. Scienze dell’ Atmosfera e del Clima, CNR, Rome, Italy
2
NASA/Goddard Space Flight Center, 613.2, Greenbelt MD 20771, USA
3
Dep. of Environ. Sciences Weizmann Institute, Rehovot 76100, Israel
4
GEST, University of Maryland, Baltimore, MD, USA
Received: 25 July 2006 – Accepted: 23 August 2006 – Published: 14 September 2006 Correspondence to: G. P. Gobbi ([email protected])
ACPD
6, 8713–8726, 2006 Aerosol properties derived from AERONET data G. P. Gobbi et al. Title Page Abstract Introduction Conclusions References Tables Figures J I J I Back CloseFull Screen / Esc
Printer-friendly Version Interactive Discussion
EGU
Abstract
Aerosol spectral measurements by sunphotometers can be characterized by three in-dependent pieces of information: 1) the optical thickness (AOT), a measure of the column aerosol concentration, 2) the optical thickness average spectral dependence, given by the Angstrom exponent (α), and 3) the spectral curvature of α (δα). We
pro-5
pose a simple graphical method to visually convert (α, δα) to the contribution of fine aerosol to the AOT and the size of the fine aerosols. This information can be used to track mixtures of pollution aerosol with dust, to distinguish aerosol growth from cloud contamination and to observe aerosol humidification. The graphical method is applied to the analysis of yearly records at 8 sites in 3 continents, characterized by different
10
levels of pollution, biomass burning and mineral dust concentrations. Results depict the dominance of fine mode aerosols in driving the AOT at polluted sites. In stable meteorological conditions, we see an increase in the size of the fine aerosol as the pollution stagnates and increases in optical thickness. Coexistence of coarse and fine particles is evidenced at the polluted sites downwind of arid regions.
15
1 Introduction
The aerosol optical thickness at wavelength λ (AOT(λ)≡τλ) is a standard parameter measured by sunphotometers like the ones operating in the AERONET (Holben et al., 1998,http://aeronet.gsfc.nasa.gov). τλ represents the extinction of radiation of wave-length λ that results from the presence of atmospheric aerosols. The Angstr ¨om
expo-20
nent α represents the slope of the wavelength dependence of the AOT in logarithmic coordinates (Angstrom, 1929):
α(λ1, λ2)= − ln(τλ2/τλ1)/ ln(λ2/λ1) . (1)
In the solar spectrum, α is a good indicator of the size of the atmospheric particles determining the AOT: α>1 are mainly determined by fine mode, submicron aerosols,
ACPD
6, 8713–8726, 2006 Aerosol properties derived from AERONET data G. P. Gobbi et al. Title Page Abstract Introduction Conclusions References Tables Figures J I J I Back CloseFull Screen / Esc
Printer-friendly Version Interactive Discussion
EGU
while α<1 are largely determined by coarse, supermicron particles (e.g., Kaufman et al., 1994). The Angstrom parameter is commonly employed in operational sunpho-tometry. However, α alone does not provide unambiguous information on the relative weight of coarse and fine modes in determining the AOT. Large fine mode particles can have the same α as mixtures of coarse mode and small fine mode ones. We shall
5
demonstrate this with examples in the next section.
Several authors have discussed how the spectral variation of the Angstrom expo-nent can provide further information about the aerosol size distribution (King et al., 1978; Nakajima et al., 1986; Kaufman, 1993; Eck et al., 1999; O’Neill et al., 2001a, 2001b, 2003; Schuster et al., 2006). Kaufman (1993) pointed-out that negative
val-10
ues of the difference δα=α (440, 613) –α (440, 1003) indicate the dominance of fine mode aerosols, while positive differences indicate the effect of two separate particle modes. Eck et al. (1999) have shown how in the wavelength range 380–870 nm, α can increase by a factor of 2–5 as wavelength increases for biomass burning and ur-ban aerosols, while remaining constant or decreasing in the presence of mineral dust.
15
O’Neill et al. (2001a) demonstrated that an Angstr ¨om exponent-based separation of coarse from fine mode contribution to AOT is feasible in part because of the coarse mode AOT spectral variation being approximately neutral. Schuster et al. (2006) ad-dressed the link between Angstrom exponent curvature and the ratio between fine and total aerosol volume.
20
Here we build upon the concept of Kaufman (1993) to propose a new, straight-forward graphical framework that, on the basis of three spectral AOT observations, allows to: 1) infer aerosol fine mode size and fractional contribution to total AOT, and 2) separate AOT increases due to aerosol humidification from AOT increases due to the addition of coarse particles as in the case of cloud contamination. To this end, we
25
classify the aerosols in a new space, AOT vs. δα vs. α. This space is invariant to the bulk AOT namely, the space is invariant to changes in AOT for a given size distribu-tion. Any AOT will be in the same point if the fine and coarse modes stays the same. This space is sensitive to the balance between the fine and coarse modes and
ACPD
6, 8713–8726, 2006 Aerosol properties derived from AERONET data G. P. Gobbi et al. Title Page Abstract Introduction Conclusions References Tables Figures J I J I Back CloseFull Screen / Esc
Printer-friendly Version Interactive Discussion
EGU
fore is ideal to separate processes related to aerosol fine size from extinction fraction. Cloud contamination will enhance the weight of the coarse mode while humidification will increase the fine mode.
2 Aerosol classification
Unsupervised classification of aerosol using numerous measurements of the spectral
5
optical thickness can supplement aerosol properties derived from less frequent multi-angle sky radiance inversions (e.g., Dubovik and King, 2000; Dubovik et al., 2002). We define the Angstr ¨om exponent difference δα=α (440, 675) –α (675, 870) as a measure of the Angstr ¨om exponent curvature dα/dλ. Choice of the 440–870-nm wave-length range relies on the fact that these are highly accurate channels (dτλ∼0.01) of the
10
AERONET sunphotometers (Eck et al., 1999; Holben et al., 1998) and these channels are available in all AERONET instruments. The δα vs. α (440, 870) space (AdA) will be our framework for analyzing aerosol properties. In this space, we further classify aerosols by representing their AOT by different colors. Since both α (440, 870) and δα are derived from τλ, propagation of errors indicates the relevant indetermination to be
15
∆α/α∼2∆τλ/ τλand∆δα / δα∼5∆τλ/ τλ, respectively. In the assumption that∆τλ∼0.01
this converts to errors of ≥20% and ≥50% in α and δα for τλ≤0.10. To avoid errors larger than ∼30%, this work employs only observations of AOT>0.15.
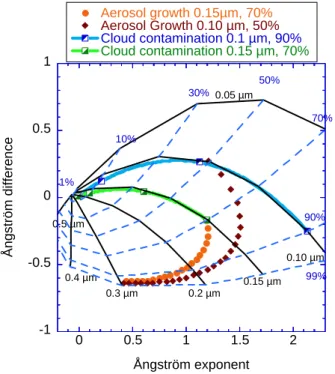
The classification framework is explained with the help of Fig. 1. To interpret data in this space, we determine reference points corresponding to bimodal size distributions
20
characterized by a variety of fine mode (Rf) and coarse mode (Rc) radii combined to lead to prescribed ratios (η) of the fine mode to total AOT (at 675 nm). To this end, we performed Mie calculations of the aerosol spectral extinction for Rf values of 0.05, 0.1, 0.15, 0.2, 0.3 and 0.5 µm, for Rc values of 0.75, 1, 2, and 4 µm, and combined them to provide η ratios of 1, 10, 30, 50, 70, 90 and 99%. Each of the two modes (i) is
ACPD
6, 8713–8726, 2006 Aerosol properties derived from AERONET data G. P. Gobbi et al. Title Page Abstract Introduction Conclusions References Tables Figures J I J I Back CloseFull Screen / Esc
Printer-friendly Version Interactive Discussion
EGU
assumed to have a log-normal size distribution:
d Ni/d ln r = [Nci/((2π)1/2ln σi)] exp[−(ln r − ln Ri)2/(2 ln2σi)] (2)
with fine and coarse mode widths σf=1.5 and σc=1.8, respectively (e.g., Dubovik et al., 2002). The δα and α values are then evaluated for each of these combinations and reported on the plot to make a reference grid. After verifying that δα values of
5
the coarse modes do not vary significantly in the 440–870 nm range (e.g., O’Neill et al., 2001), the four δα, α pairs (each pair corresponding to one of the four Rc values) have been averaged to provide a single (η, Rf) combination. Therefore, each (η, Rf) grid point plotted in our figures represents the average of the relevant coarse modes results. Following the climatology of Dubovik et al. (2002), computations were made for
10
refractive index typical of urban/industrial (m=1.40–0.001i) and mineral dust aerosols (m=1.53–0.003 i), plus water droplets (m=1.33–0.000 i).
Grid points relevant to m=1.4–0.001i, plotted in the AdA coordinates (Fig. 1) show there is close to orthogonality of the aerosol fine size Rf and extinction fraction, i.e., we have good conditions for inference of these two parameters. Cloud
contamina-15
tion cases are computed by adding to the original size distributions a 10-µm mode (m=1.33–0.0i) generating 50, 90 and 99% of the contaminated optical thickness, re-spectively. Figure 1 shows the effects of such contamination for two cases starting at: 1) η=70%, Rf=0.15 (bright green line) and 2) η=90%, Rf=0.1 (turquoise line), respec-tively. The three levels of contamination are represented by the split square symbols
20
moving towards the origin along the colored, constant Rf lines. That is, only cloud contamination of the AOT larger than 90% will be located at α∼δα∼0. Cloud contami-nation or increase in coarse aerosols have similar effects in the AdA space. It is a goal of the cloud screening process (e.g., Kaufman et al., 2006) to exclude cloud-affected observations from the database in order to analyze aerosol data alone.
25
Aerosol hydration has been simulated by incremental growth of the fine mode Rf (dRf steps= 0.01 µm) accompanied by dilution of the refractive index. In Fig. 1, two cases are shown to represent the patterns of hydration in the AdA space for distribu-tions with m=1.4–0.001 i starting from, (η=50%, Rf=0.1) and from (η=70%, Rf=0.15),
ACPD
6, 8713–8726, 2006 Aerosol properties derived from AERONET data G. P. Gobbi et al. Title Page Abstract Introduction Conclusions References Tables Figures J I J I Back CloseFull Screen / Esc
Printer-friendly Version Interactive Discussion
EGU
respectively. As expected, hydration leads to a growth in both Rf and η. In the AdA space this results in a movement in the opposite direction with respect to cloud contam-ination. This implies that even though aging and humidification of pollution aerosol and cloud contamination both decrease α, they behave quite differently in the AdA space, thus allowing for easy identification.
5
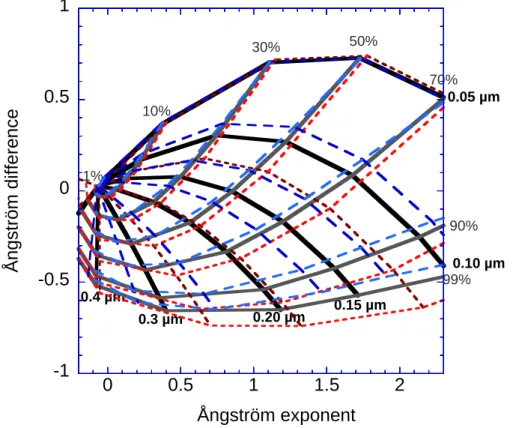
Figure 2 illustrates the sensitivity of the classification scheme to refractive index. Computations indicate some clockwise rotation about the origin of the constant radius curves for increasing refractive index. The effect is much weaker in the case of the
η curves. For a given point (α, δα) maximum Rf indetermination is of the order of
±25% for refractive index varying between m=1.33-0.0 i and m=1.53-0.003 i. At the
10
same time, the fine mode extinction fraction η, spans a range of the order of ±10%. Within this level of indetermination, the scheme is robust enough to provide an oper-ational classification of the aerosol properties. Indeed, other grids can be computed by varying aerosol properties (e.g., modal radii and refractive index) or size distribu-tion parameters. However, the simuladistribu-tions presented in Fig. 2 address most common
15
aerosol typologies (e.g., Dubovik et al., 2002) and are intended to demonstrate the ca-pability of this graphical approach at evaluating the climatology of aerosol size-related properties on the basis of standard photometric observations.
3 Application to AERONET data
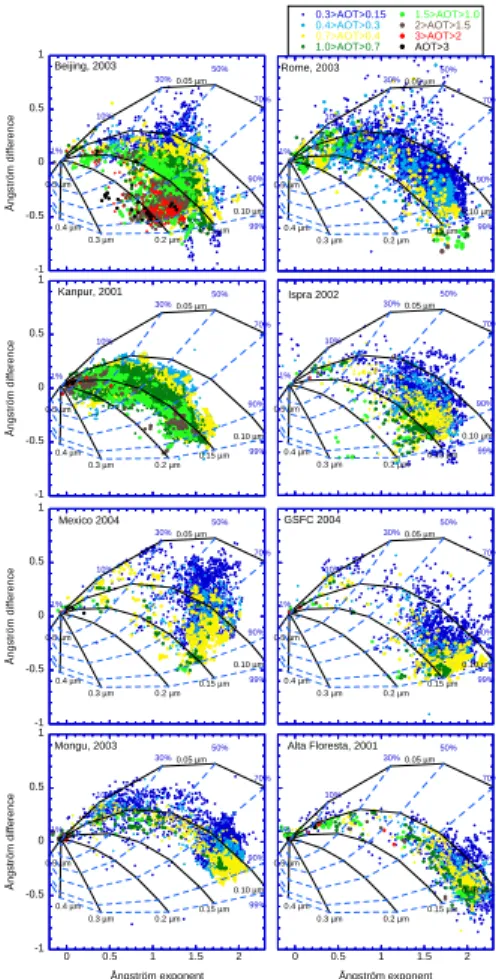
The classification scheme is applied in Fig. 3 to the data from eight AERONET locations
20
characterized by different aerosol types as pollution (P), mineral dust (D) and biomass burning (BB). The stations (and typical aerosol) are: Beijing, China (P, D), Rome, Italy (P, D), Kanpur, India (P, D), Ispra, Italy (P), Mexico City (P), GSFC, USA (P), Mongu, Zambia (BB) and Alta Floresta, Brasil (BB). All of these sites are either located in major aerosol source regions or downwind of source regions. These sites also have AOT that
25
reach either moderate or high levels. Cloud screening of this dataset has been applied according to Kaufman et al. (2006) for α>0.3, and as AERONET level 1.5 for α<0.3.
ACPD
6, 8713–8726, 2006 Aerosol properties derived from AERONET data G. P. Gobbi et al. Title Page Abstract Introduction Conclusions References Tables Figures J I J I Back CloseFull Screen / Esc
Printer-friendly Version Interactive Discussion
EGU
To provide a common reference we employed the m=1.4–0.001 i grid for all cases. The Beijing data show very high AOTs. (>2), mainly clustering in the fine mode growth wing (α<1.3, δα<0). This wing is present at various levels also in Kanpur, Ispra, GSFC and Mexico City, locations characterized by rather heavy pollution but lower AOT than Beijing. High extinctions at these sites are then linked in many cases to a hygroscopic
5
and/or coagulation growth from aging of the fine mode aerosols. At the same time coarse particles, likely mineral dust, superimpose their signal on the pollution one in Beijing and Kanpur.
For Beijing we have “typical pollution” with AOT>0.7 and α∼1.4 (dark green con-centration) that corresponds to a fine fraction of ∼75% and Rf∼0.14 µm. As shown in
10
Fig. 1, to take this aerosol and to contaminate it with clouds means to move along a line parallel to the black line of 0.15 µm, with an increasing apparent AOT. This is not what we see in the figure. The extension of the Beijing pollution to higher AOTs happens perpendicular to the black line, into larger size of the fine mode and fine fraction mainly between 70 and 90%. Even in the presence of the coarse (likely dust) particles, AOT
15
growth in many cases remains associated to fine mode growth. Such a coexistence of mineral dust and high pollution levels in Beijing is confirmed by the yearly particle anal-ysis of Zheng et al. (2005). Similar conditions are also reported for Kanpur by Chinnam et al. (2006).
Alta Floresta, a site characterized by high biomass burning, provides a nice example
20
of cloud contamination: the whole dataset shows a very coherent fine mode of 0.10– 0.13 µm with concurrent increase in AOT and coarse mode fraction taking place exactly along the constant Rf curves. In fact, both Alta Floresta and Mongu (the other biomass-burning location) are sites with cloud contamination well hidden in the data, therefore difficult to remove even by wavelength dependent cloud screening (Kaufman et al.,
25
2006). Finally, the two AdA plots of Mongu and Alta Floresta show smaller Rf values at Mongu and also show greater δα values at Mongu that result in part from greater aerosol absorption (higher black carbon fraction) at Mongu (Eck et al., 2001).
In Fig. 3, Rome presents a case similar to Beijing and Kanpur but with a factor 8719
ACPD
6, 8713–8726, 2006 Aerosol properties derived from AERONET data G. P. Gobbi et al. Title Page Abstract Introduction Conclusions References Tables Figures J I J I Back CloseFull Screen / Esc
Printer-friendly Version Interactive Discussion
EGU
of four lower AOT. This AERONET station is located at the outskirts of the city and Saharan dust advection is recorded on ∼20–30% of the time (Barnaba and Gobbi, 2004). Measurements clustering at higher Angstrom coefficients than in Beijing also denote a smaller size of the fine aerosols and less a persistent coarse mode. As expected from the MODIS observations (Barnaba and Gobbi, 2004), in spite of being
5
only 400 km north of Rome, Ispra shows almost no sign of dust impact on its record. Conversely, fine mode growth is more evident at this site in part due to air stagnation in a mountain-surrounded valley (the Po valley is one of Europe’s most polluted regions, e.g., Melin and Zibordi (2005)). In fact, higher pollution locations such as Ispra, Mexico City and GSFC have their measurements clustering in the α∼1.5, δα∼–0.5 region, with
10
growing AOT linked to both coagulation-aging and hydration-type increase in Rf. It is then reasonable to associate to aged pollution haze formation the branching of data along constant η lines.
4 Conclusions
A graphical framework to classify aerosol properties using direct-sun sunphotometer
15
observations has been presented. The method relies on the combined analysis of the Angstrom exponent α and of its spectral curvature dα/dλ here represented by δα=α (440, 675) –α (675, 870). Plotting data in these coordinates was shown to allow for inference of aerosol fine mode size and fractional contribution to total AOT. Adding information on AOT to the plot then permits to separate AOT growth by aerosol
humid-20
ification and/or coagulation (aging) from AOT growth by inclusion of coarse mode par-ticles or cloud contamination. Application to AERONET climatological data from three continents allowed to identify various aerosol properties peculiar to these locations. Data from Beijing (China) and Kanpur (India) confirmed these locations to be affected by superposition of dust, and high pollution conditions. At both sites it is pollution haze
25
(fine mode aerosols) that generates the largest aerosol loads, reaching AOT levels >2 in Beijing. The method allowed for easy identification of the mineral dust fingerprint
ACPD
6, 8713–8726, 2006 Aerosol properties derived from AERONET data G. P. Gobbi et al. Title Page Abstract Introduction Conclusions References Tables Figures J I J I Back CloseFull Screen / Esc
Printer-friendly Version Interactive Discussion
EGU
in the Rome (Italy) data, while confirming the absence of dust at the Ispra site, lo-cated just 400 km north. Growing haze appears in this framework as a branching along larger fine mode radius and extinction fraction. Conversely, locations where biomass burning represents the main source of aerosols showed limited hygroscopic growth of fine mode particles, and a rather focused range of fine mode size (dRf∼0.05 µm). In
5
these cases, some cloud contamination was observed at the two sites of Alta Floresta (Brazil) and Mongu (Zambia). Overall, the analysis scheme provides a versatile tool to characterize aerosol properties and to explore the important aerosol-cloud border region by means of easily accessible, direct sun photometric observations.
Acknowledgements. This work was initiated while Y. Kaufman was visiting ISAC Rome in the
10
Autumn of 2005. Y. Kaufman passed away on 31 May 2006. We wish to acknowledge Y. Kauf-man’s intuition, curiosity, generosity, and creative energy. This paper in large part is the fruit of his many talents. Part of this research was supported by the EU ACCENT Network. I. Koren is incumbent of the B. H. Swig and J. D. Weiler career development.
References
15
Angstrom, A.: On the atmospheric transmission of sun radiation and on dust in the air, Geogr. Ann., 11, 156–166, 1929.
Barnaba, F. and Gobbi, G. P.: Aerosol seasonal variability over the Mediterranean region and relative impact of maritime, continental and Saharan dust particles over the basin from MODIS data in the year 2001, Atmos. Chem. Phys., 4, 2367–2391, 2004.
20
Chinnam, N., Dey, S., Tripathi, S. N., and Sharma, M.: Dust events in Kanpur, northern India: Chemical evidence for source and implications to radiative forcing, Geophys. Res. Lett., 33, L08803, doi:10.1029/2005GL025278, 2006.
Dubovik, O. and King, M. D.: A flexible inversion algorithm for retrieval of aerosol optical prop-erties from Sun and sky radiance measurements, J. Geophys. Res., 105, 20 673–20 696,
25
2000.
Dubovik, O., Holben, B. N., Eck, T. F., Smirnov, A., Kaufman, Y. J., King, M. D., Tanre, D., and Slutsker, I.: Variability of absorption and optical properties of key aerosol types observed in worldwide locations, J. Atmos. Sci., 59, 590–608, 2002.
ACPD
6, 8713–8726, 2006 Aerosol properties derived from AERONET data G. P. Gobbi et al. Title Page Abstract Introduction Conclusions References Tables Figures J I J I Back CloseFull Screen / Esc
Printer-friendly Version Interactive Discussion
EGU
Eck, T. F., Holben, B. N., Reid, J. S., Dubovik, O., Smirnov, A., O’Neill, N. T., Slutsker, I., and Kinne, S.: Wavelength dependence of the optical depth of biomass burning, urban, and desert dust aerosols, J. Geophys. Res., 104, 31 333–31 349, 1999.
Eck, T. F., Holben, B. N., Ward, D. E., Dubovik, O., Reid, J. S., Smirnov, A., Mukelabai, M. M., Hsu, N. C., O’Neill, N. T., and Slutsker, I.: Characterization of the optical properties of
5
biomass burning aerosols in Zambia during the 1997 ZIBBEE field campaign, J. Geophys. Res., 106, 3425–3448, 2001.
Holben B. N., Eck, T. F., Slutsker, I., Tanre, D., Buis, J. P., Setzer, A., Vermote, E., Reagan, J. A., Kaufman, Y. J., Nakajima, T., Lavenu, F., Jankowiak, I., and Smirnov, A.: AERONET – A federated instrument network and data archive for aerosol characterization, Rem. Sens.
10
Environ., 66, 1–16, 1998.
Kaufman, Y. J.: Aerosol optical thickness and atmospheric path radiance, J. Geophys. Res., 98, D2, 2677–2692, 1993.
Kaufman, Y. J., Gobbi, G. P., and Koren, I.: Aerosol climatology using a tunable spec-tral variability cloud screening of AERONET data, Geophys. Res. Lett., 33, L07817,
15
doi:10.1029/2005GL025478, 2006.
King, M. D., Byrne, D. M., and Herman, B. M.: Aerosol size distribution obtained by inversion of spectral optical depth measurements, J. Atmos. Sci., 35, 2153–2167, 1978.
M ´elin, F. and Zibordi, G.: Aerosol variability in the Po Valley analyzed from automated optical measurements, Geophys. Res. Lett., 32, L03810, doi:10.1029/2004GL021787, 2005.
20
Nakajima, T., Takamura, T., and Yamano, M.: Consistency of aerosol size distributions inferred from measurements of solar radiation and aerosols, J. Met. Soc. Jap., 64, 765–776, 1986. Nakajima, T. and King, M. D.: Determination of the optical thickness and effective particle
radius of clouds from reflected solar radiation measurements, Part I: Theory, J. Atmos. Sci., 47, 1878–1893, 1990.
25
O’Neill, N. T., Dubovik, O., and Eck, T. F.: A modified Angstrom coefficient for the characteriza-tion of sub-micron aerosols, Appl. Opt., 40, 2368–2375, 2001a.
O’Neill, N. T., Eck, T. F., Holben, B. N., Smirnov, A., and Dubovick, O.: Bimodal size distribution influences on the variation of Angstrom derivatives in spectral and optical depth space, J. Geophys. Res., 106(D9), 9787–9806, 2001b.
30
O’Neill, N. T., Eck, T. F., Smirnov, A., Holben, B. N., and Thulasiraman, S.: Spectral dis-crimination of coarse and fine mode optical depth, J. Geophys. Res., 108(D17), 4559, doi:10.1029/2002JD002975, 2003.
ACPD
6, 8713–8726, 2006 Aerosol properties derived from AERONET data G. P. Gobbi et al. Title Page Abstract Introduction Conclusions References Tables Figures J I J I Back CloseFull Screen / Esc
Printer-friendly Version Interactive Discussion
EGU
O’Neill, N. T., Thulasiraman, S., Eck, T. F., and Reid, J. S.: Robust optical features of fine mode size distributions: Application to the Quebec smoke event of 2002, J. Geophys. Res., 110, D11207, doi:10.1029/2004JD005157, 2005.
Schuster, G. L., Dubovick, O., and Holben, B. N.: Angstrom exponent and bimodal aerosol size distributions, J. Geophys. Res., 111, D07207, doi:10.1029/2005/JD006328, 2006.
5
Zheng, M., Salmon, L. G., Schauer, J. J., Zeng, L., Kiang, C. S., Zhang, Y., and Cass, G. R.: Seasonal trends in PM2.5 source contributions in Beijing, China, Atmos. Env., 39, 3967– 3976, 2005.
ACPD
6, 8713–8726, 2006 Aerosol properties derived from AERONET data G. P. Gobbi et al. Title Page Abstract Introduction Conclusions References Tables Figures J I J I Back CloseFull Screen / Esc
Printer-friendly Version Interactive Discussion EGU -1 -0.5 0 0.5 1 0 0.5 1 1.5 2 Aerosol growth 0.15µm, 70% Aerosol Growth 0.10 µm, 50% Cloud contamination 0.1 µm, 90% Cloud contamination 0.15 µm, 70% Ångström exponent Ångström difference 0.05 µm 0.10 µm 0.15 µm 0.2 µm 0.3 µm 0.4 µm 0.5 µm 1% 10% 30% 50% 70% 90% 99% Figure 1
Fig. 1. Simulations of the classification of the aerosol properties as a function of the Angstr ¨om
exponent α (440, 870) and the difference δα=α (440, 675) – α (675, 870), for bimodal, lognor-mal size distributions with refractive index m=1.4–0.001 i. The black solid lines are each for a fixed size of the fine mode Rf and the dashed blue lines for a fixed fraction contribution η of the
fine mode to the AOT at 675 nm. Split squares represent the effects of a cloud contamination of 0, 50, 90 and 99% in the AOT of two grid points: 1) η=70%, Rf=0.15 (bright green line) and
2) η=90%, Rf=0.1 (turquoise line). This contamination results in a departure from the original
grid points along the constant Rf lines and towards the origin. Conversely, hydration of the
aerosol fine mode (two starting conditions simulated: 1) η=50%, Rf=0.1 (brown diamonds),
and 2) η=70%, Rf=0.15 (orange circles)) is accompanied by a movement towards the origin
ACPD
6, 8713–8726, 2006 Aerosol properties derived from AERONET data G. P. Gobbi et al. Title Page Abstract Introduction Conclusions References Tables Figures J I J I Back CloseFull Screen / Esc
Printer-friendly Version Interactive Discussion EGU
-1
-0.5
0
0.5
1
0
0.5
1
1.5
2
Ångström difference
Ångström exponent
50% 70% 30% 10% 1% 90% 99% 0.05 µm 0.10 µm 0.15 µm 0.20 µm 0.3 µm 0.4 µm Figure 2Fig. 2. Comparison of the m=1.40–0.001 i grid (black/gray lines) with grids obtained for
refrac-tive indices m=1.33–0.000 i (blue/pale-blue dashes), and m=1.53–0.003 i (brown/red dashes).
ACPD
6, 8713–8726, 2006 Aerosol properties derived from AERONET data G. P. Gobbi et al. Title Page Abstract Introduction Conclusions References Tables Figures J I J I Back CloseFull Screen / Esc
Printer-friendly Version Interactive Discussion EGU -1 -0.5 0 0.5 1 Ångström difference Beijing, 2003 0.05 µm 0.10 µm 0.15 µm 0.2 µm 0.3 µm 0.4 µm 0.5 µm 1% 10% 30% 50% 70% 90% 99% -1 -0.5 0 0.5 1 Ångström difference Kanpur, 2001 0.05 µm 0.10 µm 0.15 µm 0.2 µm 0.3 µm 0.4 µm 0.5 µm 1% 10% 30% 50% 70% 90% 99% 0.3>AOT>0.15 0.4>AOT>0.3 0.7>AOT>0.4 1.0>AOT>0.7 1.5>AOT>1.0 2>AOT>1.5 3>AOT>2 AOT>3 Rome, 2003 0.05 µm 0.10 µm 0.15 µm 0.2 µm 0.3 µm 0.4 µm 0.5 µm 1% 10% 30% 50% 70% 90% 99% Ispra 2002 0.05 µm 0.10 µm 0.15 µm 0.2 µm 0.3 µm 0.4 µm 0.5 µm 1% 10% 30% 50% 70% 90% 99% -1 -0.5 0 0.5 1 Ångström difference Mexico 2004 0.05 µm 0.10 µm 0.15 µm 0.2 µm 0.3 µm 0.4 µm 0.5 µm 1% 10% 30% 50% 70% 90% 99% 0 0.5 1 1.5 2 -1 -0.5 0 0.5 1 Ångström exponent Mongu, 2003 Ångström difference 0.05 µm 0.10 µm 0.15 µm 0.2 µm 0.3 µm 0.4 µm 0.5 µm 1% 10% 30% 50% 70% 90% 99% GSFC 2004 0.05 µm 0.10 µm 0.15 µm 0.2 µm 0.3 µm 0.4 µm 0.5 µm 1% 10% 30% 50% 70% 90% 99% 0 0.5 1 1.5 2 Ångström exponent Alta Floresta, 2001 0.05 µm 0.10 µm 0.15 µm 0.2 µm 0.3 µm 0.4 µm 0.5 µm 1% 10% 30% 50% 70% 90% 99% Figure 3
Fig. 3. Angstrom exponent difference, δα=α (440, 675)–α (675, 870), as a function of the
440–870 nm Angstr ¨om exponent and AOT (color code) for eight AERONET stations (from top): Beijing (China), Rome (Italy), Kanpur (India), Ispra (Italy), Mexico City (Mexico), GSFC (USA), Mongu (Zambia) and Alta Floresta (Brasil). Only cloud-screened data with AOT>0.15 were used.