HAL Id: hal-00302459
https://hal.archives-ouvertes.fr/hal-00302459
Submitted on 18 Jan 2007HAL is a multi-disciplinary open access
archive for the deposit and dissemination of sci-entific research documents, whether they are pub-lished or not. The documents may come from teaching and research institutions in France or abroad, or from public or private research centers.
L’archive ouverte pluridisciplinaire HAL, est destinée au dépôt et à la diffusion de documents scientifiques de niveau recherche, publiés ou non, émanant des établissements d’enseignement et de recherche français ou étrangers, des laboratoires publics ou privés.
The direct effect of aerosols on solar radiation based on
satellite observations, reanalysis datasets, and spectral
aerosol optical properties from Global Aerosol Data Set
(GADS)
N. Hatzianastassiou, C. Matsoukas, E. Drakakis, P. W. Stackhouse Jr., P.
Koepke, A. Fotiadi, K. G. Pavlakis, I. Vardavas
To cite this version:
N. Hatzianastassiou, C. Matsoukas, E. Drakakis, P. W. Stackhouse Jr., P. Koepke, et al.. The direct effect of aerosols on solar radiation based on satellite observations, reanalysis datasets, and spectral aerosol optical properties from Global Aerosol Data Set (GADS). Atmospheric Chemistry and Physics Discussions, European Geosciences Union, 2007, 7 (1), pp.753-783. �hal-00302459�
ACPD
7, 753–783, 2007 Direct effect of aerosols on solar radiation N. Hatzianastassiou et al. Title Page Abstract Introduction Conclusions References Tables Figures ◭ ◮ ◭ ◮ Back CloseFull Screen / Esc
Printer-friendly Version Interactive Discussion
EGU
Atmos. Chem. Phys. Discuss., 7, 753–783, 2007 www.atmos-chem-phys-discuss.net/7/753/2007/ © Author(s) 2007. This work is licensed
under a Creative Commons License.
Atmospheric Chemistry and Physics Discussions
The direct effect of aerosols on solar
radiation based on satellite observations,
reanalysis datasets, and spectral aerosol
optical properties from Global Aerosol
Data Set (GADS)
N. Hatzianastassiou1,2, C. Matsoukas2,3, E. Drakakis2,5, P. W. Stackhouse Jr.6, P. Koepke7, A. Fotiadi2,4, K. G. Pavlakis2,8, and I. Vardavas2,4
1
Laboratory of Meteorology, Department of Physics, University of Ioannina, 45110 Ioannina, Greece
2
Foundation for Research and Technology-Hellas, Heraklion, Crete, Greece
3
Department of Environment, University of the Aegean, Mytilene, Greece
4
Department of Physics, University of Crete, Crete, Greece
5
Department of Electrical Engineering, Technological Educational Institute of Crete, Heraklion, Greece
6
Atmospheric Sciences, NASA Langley Research Center, Hampton, Virginia, USA
7
Meteorological Institute, University of Munich, Munich, Germany
8
Department of General Applied Science, Technological Educational Institute of Crete, Heraklion, Greece
Received: 16 November 2006 – Accepted: 21 December 2006 – Published: 18 January 2007 Correspondence to: N. Hatzianastassiou (nhatzian@cc.uoi.gr)
ACPD
7, 753–783, 2007 Direct effect of aerosols on solar radiation N. Hatzianastassiou et al. Title Page Abstract Introduction Conclusions References Tables Figures ◭ ◮ ◭ ◮ Back CloseFull Screen / Esc
Printer-friendly Version Interactive Discussion
EGU
Abstract
A global estimate of the seasonal direct radiative effect (DRE) of natural plus anthro-pogenic aerosols on solar radiation under all-sky conditions is obtained by combining satellite measurements and reanalysis data with a spectral radiative transfer model. The estimates are obtained with detailed spectral model computations separating the
5
ultraviolet (UV), visible and near-infrared wavelengths. The global distribution of spec-tral aerosol optical properties was taken from the Global Aerosol Data Set (GADS) whereas data for clouds, water vapour, ozone, carbon dioxide, methane and surface albedo were taken from various satellite and reanalysis datasets. Using these aerosol properties and other related variables, we generate climatological (for the 12-year
pe-10
riod 1984–1995) monthly mean aerosol DREs. The global annual mean DRE on the outgoing SW radiation at the top of atmosphere (TOA, ∆FTOA) is 1.62 Wm−2 (with a
range of –10 to 15 Wm−2, positive values corresponding to planetary cooling), the ef-fect on the atmospheric absorption of SW radiation (∆Fatmab) is 1.6 Wm−2 (values up
to 35 Wm−2, corresponding to atmospheric warming), and the effect on the surface
15
downward and absorbed SW radiation (∆Fsurf, and ∆Fsurfnet, respectively) is –3.93 and
–3.22 Wm−2 (values up to –45 and –35 Wm−2, respectively, corresponding to surface
cooling.) According to our results, aerosols decrease/increase the planetary albedo by –3 to 13% at the local scale, whereas on planetary scale the result is an increase of 1.5%. Aerosols can warm locally the atmosphere by up to 0.98 K day−1, whereas they
20
can cool the Earth’s surface by up to –2.9 K day−1. Both these effects, which can sig-nificantly modify atmospheric dynamics and the hydrological cycle, can produce signif-icant planetary cooling on a regional scale, although planetary warming can arise over highly reflecting surfaces. The aerosol DRE at the Earth’s surface compared to TOA can be up to 15 times larger at the local scale. The largest aerosol DRE takes place
25
in the northern hemisphere both at the surface and the atmosphere, arising mainly at ultraviolet and visible wavelengths.
ACPD
7, 753–783, 2007 Direct effect of aerosols on solar radiation N. Hatzianastassiou et al. Title Page Abstract Introduction Conclusions References Tables Figures ◭ ◮ ◭ ◮ Back CloseFull Screen / Esc
Printer-friendly Version Interactive Discussion
EGU
1 Introduction
Atmospheric aerosols, both natural and anthropogenic, can cause climate change through their direct, indirect and semi-direct effects on the radiative energy budget of the Earth-atmosphere system. The sum of these effects, on a global average, is likely to be comparable in magnitude to the radiative forcing of about 2.4 Wm−2 by
anthro-5
pogenic greenhouse gases (IPCC, 2001). However, the quantification of the aerosol effects is more complex than the quantification of radiative forcing by greenhouse gases because aerosol mass and particle number concentrations are highly variable in space and time, due to their much shorter atmospheric lifetime compared with the important greenhouse gases. Aerosol properties are difficult to measure without instrumental
10
offsets or bias, making it difficult to estimate the aerosol radiative effects. Therefore, there is large uncertainty regarding the aerosol overall radiative forcing (Remer and Kaufman, 2006; Granger Morgan et al., 2006; Yu et al., 2006). Better estimates of the aerosol radiative effects on a planetary scale are required to reduce the uncertainties.
The present study focuses on the direct radiative effect (DRE) of aerosols, which is
15
the overall effect of natural plus anthropogenic aerosols on the radiative energy budget, and it is different to the direct climate forcing (DCF) which represents the corresponding effect of anthropogenic aerosols only. Although the present consensus is that the DRE is better known than the indirect and semi-direct effects, there is still a large degree of uncertainty. Our study deals with the direct effect of aerosols on the shortwave (SW)
20
radiation budget, since the main DRE lies at these wavelengths, being much smaller in the longwave (thermal infrared). Even for dust, the thermal infrared radiative effects are about 10% those for the shortwave radiation (Tanr ´e et al., 2003).
The assessments of aerosol DRE fall into three broad categories: (i) measurement-based (e.g. Bellouin et al., 2005; Loeb and Manalo-Smith, 2005; Zhang et al., 2005;
25
Remer and Kaufman, 2006; Christopher et al., 2006), (ii) model-based (e.g. Jacobson, 2001; Chin et al., 2002; Liao et al., 2004; Koch and Hansen, 2005; Reddy et al., 2005; Takemura et al., 2005), and (iii) measurement-model integrated (e.g. Chu et
ACPD
7, 753–783, 2007 Direct effect of aerosols on solar radiation N. Hatzianastassiou et al. Title Page Abstract Introduction Conclusions References Tables Figures ◭ ◮ ◭ ◮ Back CloseFull Screen / Esc
Printer-friendly Version Interactive Discussion
EGU
al., 2002; Yu et al., 2004; Chung et al., 2005). Measurements involve in-situ, satellite and suborbital remote sensing data. Yu et al. (2006) provide a review of the above assessments. Each method has advantages and drawbacks. For example, there is a wide range of discrepancy in model results because of the many inherent assumptions involved in modelling the aerosol effect on climate (Remer and Kaufman, 2006), so
5
there are difficulties in reproducing correctly satellite observations (Bellouin et al., 2005; Zhao et al., 2005). On the other hand, although many problems related to satellite observations of aerosols have been resolved by more sophisticated instruments, there are still problems as shown by discrepancies between different satellite products (Zhao et al., 2005). Beyond this, the satellite-based method (e.g. Christopher and Zhang,
10
2002) provides estimates of aerosol forcing only at the top of atmosphere (TOA), but not within the atmosphere and at the Earth’s surface, where the effect of aerosols is largest.
The present study takes an alternate approach using quality available global obser-vational data and detailed spectral radiative transfer flux calculations performed with
15
a radiative transfer model. The adopted technique relies on spectral aerosol optical properties from the Global Aerosol Data Set (GADS, Koepke et al., 1997) and satellite observations for the key surface and atmospheric parameters such as clouds, wa-ter vapour, surface albedo and ozone taken from comprehensive global climatological databases (NASA Langley Research Center data set, International Satellite Cloud
Cli-20
matology Project, ISCCP, Goddard Earth Observing System, GEOS, version 1 reanal-ysis, provided by the Data Assimilation Office, DAO, of NASA’s Goddard Space Flight Center, GSFC). This study incorporates realistic surface and atmospheric conditions, especially those of clouds, to reduce some of the major sources of error in estimates of the direct forcing/effect (Podgorny and Ramanathan, 2001; Chung et al., 2005). In
25
addition, an important improvement in this study, compared to other studies, is that the aerosol DRE is computed at a very high spectral resolution, while other radiation trans-fer, general circulation (GCM) and chemical transport (CTM) models, usually include a few spectral bands in the whole SW range. This can be critical, since inadequate
ACPD
7, 753–783, 2007 Direct effect of aerosols on solar radiation N. Hatzianastassiou et al. Title Page Abstract Introduction Conclusions References Tables Figures ◭ ◮ ◭ ◮ Back CloseFull Screen / Esc
Printer-friendly Version Interactive Discussion
EGU
treatment of spectrally resolved aerosol properties can result in modified aerosol forc-ings of up to 16% on a global scale, and 100% locally (Hatzianastassiou et al., 2004b). Recently, Redemann et al. (2006) have shown that ratios of aerosol radiative forcing at 400 and 1600 nm can be as high as a factor of 10, depending on the aerosol type. Our DRE computations refer to the whole solar spectrum (0.2–10µm), and they are per-5
formed at 117 wavelengths ranging from 0.2 to 1.0µm, and 10 spectral intervals in the
range 1.0–10.0µm (note that our study deals only with solar radiation). The inclusion
of near-IR has been shown (e.g. Bush and Valero, 2003; Nishizawa et al., 2004; Zhou et al., 2005; Hatzianastassiou et al., 2006) to be essential for accurately computing the aerosol radiative effects. We have used a detailed spectral radiative transfer model to
10
match, as best possible, the detailed spectral resolution of aerosol optical properties (extinction optical thickness, AOT, single scattering albedo, ωaer, and asymmetry pa-rameter, gaer) from GADS, given at 40 wavelengths within the range 0.2 to 10.0µm,
using interpolation and extrapolation when necessary.
Following this approach, we produced global DRE monthly climatologies for the
12-15
year period 1984–1995 for both clear and all-sky conditions, for winter and summer. The DRE is computed at TOA, in the atmosphere and at the Earth’s surface. All com-putations were performed at a geographical cell level of 1◦
×1◦ latitude-longitude on a daily basis, and subsequently averaged and presented as monthly means. Our results provide a realistic climatological assessment of aerosol SW DRE.
20
This study complements the works by Hatzianastassiou et al. (2004a, 2006). In Hatzianastassiou et al. (2004a) the global distribution of aerosol DRE in the ultraviolet and visible wavelengths was computed for clear-sky conditions, for the 10-year period 1984–1994. Recently, Hatzianastassiou et al. (2006) calculated the aerosol DRE in the solar near-infrared (IR) for both clear- and all-sky conditions for the period 1984–1995.
25
The present study is an integration of the previous two studies, providing estimates of clear- and all-sky DREs for the total SW range for the period 1984–1995.
The methodology, and descriptions of the radiative transfer model and the climato-logical input data were given in detail in Hatzianastassiou et al. (2004a, 2006), so only
ACPD
7, 753–783, 2007 Direct effect of aerosols on solar radiation N. Hatzianastassiou et al. Title Page Abstract Introduction Conclusions References Tables Figures ◭ ◮ ◭ ◮ Back CloseFull Screen / Esc
Printer-friendly Version Interactive Discussion
EGU
a very brief description of these will be given in Sect. 2. More emphasis will be given to the results (Sect. 3), before the conclusions (Sect. 4).
2 Model and input data
The radiative transfer model and the various assimilated input data are briefly de-scribed in this section. For more details the reader is referred to the relevant studies by
5
Hatzianastassiou et al. (2004 a,b) and Hatzianastassiou et al. (2006). 2.1 The radiative transfer model
The deterministic spectral radiative transfer model used here was developed from a radiative-convective model (Vardavas and Carver, 1984). The incoming solar irradi-ance at TOA is computed for the spectral interval 0.2–10.0µm, based on the spectral 10
profile of Thekaekara and Drummond (1971), using a solar constant S◦=1367 Wm−2
(e.g. Willson, 1997) corrected for the Earth’s elliptical orbit. The computations were performed for each 1-degree latitude-longitude cell for 117 wavelengths in the range 0.2–1.0µm and ten spectral intervals in the range 1.0–10 µm. For each wavelength
and spectral interval, a set of monochromatic radiative flux transfer equations is solved
15
for an absorbing/multiple-scattering atmosphere using the Delta-Eddington method of Joseph et al. (1976) which is an extension of the Eddington method described in Shettle and Weinman (1970). At ultraviolet–visible wavelengths we include ozone absorption and Rayleigh scattering by air. For the near-IR wavelengths we include absorption by water vapour, carbon dioxide and methane. We include scattering and absorption by
20
clouds (low, middle and high) and aerosols, and reflection from the Earth’s surface. The SW aerosol DRE (denoted henceforth as ∆F), or more precisely the “aerosol flux change”, is the effect of aerosols on the SW radiation budget at TOA, at the Earth’s surface, or within the atmosphere, and it is given by
∆F = F − Fno−aerosol (1)
ACPD
7, 753–783, 2007 Direct effect of aerosols on solar radiation N. Hatzianastassiou et al. Title Page Abstract Introduction Conclusions References Tables Figures ◭ ◮ ◭ ◮ Back CloseFull Screen / Esc
Printer-friendly Version Interactive Discussion
EGU
where F and Fno−aerosolare the SW radiative fluxes with and without aerosols. The DRE components ∆FTOA, ∆Fatmab, ∆Fsurf, and ∆Fsurfnet, represent the effect of aerosols on
the outgoing radiation at TOA, the radiation absorbed within the atmosphere, the down-ward radiation at the Earth’s surface, and the net downdown-ward (or absorbed) radiation at the surface.
5
2.2 GADS aerosol data
The aerosol radiative properties, AOT,ωaer, and gaer, were taken from GADS (Koepke et al., 1997), which provides aerosol particle properties averaged over space and time, used in a number of climate model studies (e.g. King et al., 1999; Chin et al., 2002; Morcrette, 2002; Treffeisen et al., 2005). Detailed discussions of GADS aerosol
prop-10
erties were given in Hatzianastassiou et al. (2004a, 2006). In GADS, the tropospheric aerosol particles are described by 10 main aerosol components, which are represen-tative for the atmosphere, resulting from aerosol emission, formation, and removal pro-cesses within the atmosphere, so that they exist as mixture of different substances, both external and internal. Global distributions of GADS aerosol properties are given
15
as climatologically averaged values both for the periods December through February (northern hemisphere winter) and June through August (northern hemisphere summer) on a 5◦
×5◦ latitude-longitude resolution. However, to match the spatial resolution of the climatological parameters, especially that of relative humidity to which the aerosol properties are sensitive, the original GADS aerosol optical properties were up-scaled
20
to 1◦
×1◦ latitude-longitude resolution, as explained in Hatzianastassiou et al. (2006). The aerosol properties originally taken from GADS, were re-computed for actual rela-tive humidity values for the aerosol layer in order to compute realistically the aerosol DREs.
ACPD
7, 753–783, 2007 Direct effect of aerosols on solar radiation N. Hatzianastassiou et al. Title Page Abstract Introduction Conclusions References Tables Figures ◭ ◮ ◭ ◮ Back CloseFull Screen / Esc
Printer-friendly Version Interactive Discussion
EGU
2.3 Surface and atmospheric data
The water vapour and temperature data were taken from the GEOS-1 reanalysis prod-uct (6-hourly), averaged to a daily temporal resolution. Atmospheric temperature and specific humidity profiles for the years 1984 through to 1995 were used to compute the mean relative humidity of the aerosol layer. Cloud data on a 1◦×1◦resolution were
5
taken from the NASA-Langley data set based on GEWEX ISCCP DX cloud climatolo-gies. The mean daily 1◦
×1◦ NASA-Langley cloud data were compiled by processing the 3-hourly ISCCP-DX pixel-level data, which contain radiance and cloud retrieval information from geosynchronous and polar orbiting satellites sampled to a nominal resolution of 30 km. All 30 km DX pixels within a grid cell are averaged analogously
10
to the methods of ISCCP (e.g. Rossow et al., 1996) to produce gridded radiance and cloud products. The NASA Langley 1◦×1◦cloud data include: cloud amount, cloud-top pressure, cloud-top temperature, liquid water path, and optical depth for total clouds. They also provide cloud amount and cloud-top temperature for low-, mid-, and high-level clouds, as well as cloud amount, cloud-top temperature, cloud optical depth, and
15
cloud albedo separately for ice and liquid water phase clouds. The surface reflection was computed by using surface-type cover fractions on a mean daily and 1-degree geographical cell resolution for the years 1984–1995. Ice/snow cover data were taken from ISCCP, while surface type classification maps were obtained from other high res-olution data sets (Stackhouse et al. 2002). A complete topography scheme is included
20
in the model, which uses the NASA DAO GEOS-1 surface pressure, gridded on 1◦×1◦ cells.
3 Shortwave aerosol direct radiative effect computations
The model total SW mean monthly (winter and summer) aerosol DREs for each cell (1◦longitude-latitude) are given at TOA, in the atmosphere and at the surface. At TOA,
25
ACPD
7, 753–783, 2007 Direct effect of aerosols on solar radiation N. Hatzianastassiou et al. Title Page Abstract Introduction Conclusions References Tables Figures ◭ ◮ ◭ ◮ Back CloseFull Screen / Esc
Printer-friendly Version Interactive Discussion
EGU
3.1 Aerosol direct radiative effect at the top of atmosphere(∆FTOA)
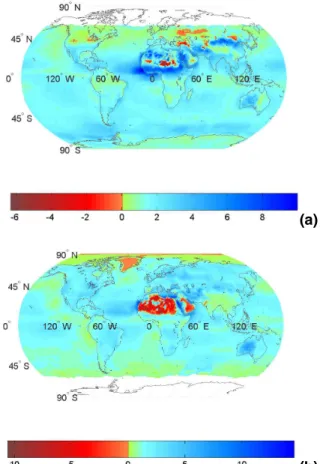
The average (1984–1995) change of outgoing SW radiation (OSR) at TOA due to aerosols (aerosol direct radiative effect ∆FTOA), for all-sky conditions, is given in Fig. 1.
According to Eq. (1), positive values indicate increased OSR, i.e. solar radiative cool-ing effect of the Earth-atmosphere system. In contrast, negative ∆FTOAvalues indicate
5
decreased OSR due to aerosols, or a warming radiative effect. Given that the incom-ing SW radiation remains unchanged, the change of planetary albedo (∆Rp) is directly
dependent on ∆FTOA. Thus, positive and negative values of ∆Rp in Fig. 2 correspond
to increased and decreased planetary albedo, respectively, due to aerosols (expressed in absolute percentage values).
10
In general, natural plus anthropogenic aerosols modify the reflected SW radiation by the Earth-atmosphere system by about –10 to 15 Wm−2(or –3 to 13% in terms of ∆Rp,
Fig. 2). Over most of the globe the change is smaller than 5 Wm−2 (or 2%). Aerosols
mostly increase the OSR (positive values of ∆FTOAand ∆Rp) producing thus planetary
cooling. However, they also produce a warming of the Earth-atmosphere system by
15
decreasing the outgoing SW radiation at TOA by up to 10 Wm−2 (or –3%, Fig. 2). This
occurs over high-latitude regions with strong surface albedo, such as Greenland in July and Siberia in January, as well as over continental areas (e.g. Sahara, Arabian penin-sula) with large surface albedo and significant loads of absorbing aerosols. The sign of DRE at TOA is determined byωaer, AOT and surface albedo, Rg. Therefore,
combi-20
nations of these parameters can lead to a changing sign of ∆FTOAand ∆Rpwith time
over the same location (e.g. planetary warming over Siberia in winter against planetary cooling in summer), and also to a different sign of ∆FTOAand ∆Rpover adjacent areas
(e.g. planetary cooling over sub-Sahel and along the Atlantic Ocean tropical zone ex-tending from northern Africa through central America, against planetary warming over
25
highly reflecting Saharan desert areas). The role ofωaerfor ∆FTOAis demonstrated by
the fact that our study gives planetary warming over Sahara and Arabia (Figs. 1 and 2), whilst a cooling was found by Reddy et al. (2005) usingωaer>0.95.
ACPD
7, 753–783, 2007 Direct effect of aerosols on solar radiation N. Hatzianastassiou et al. Title Page Abstract Introduction Conclusions References Tables Figures ◭ ◮ ◭ ◮ Back CloseFull Screen / Esc
Printer-friendly Version Interactive Discussion
EGU
Although planetary warming over these regions is suggested by other results (e.g. Yu et al. 2004), there is evidence (e.g. Kaufman et al. 2001; Dubovik et al. 2002; Cattrall et al. 2003) that dust absorption could be much weaker. To assess a possible overestimation of dust absorption by GADS, we performed a sensitivity analysis that showed that a 6% larger ωaer produces a ∆FTOA with opposite sign, i.e. planetary
5
cooling over Sahara and Arabia, in agreement with Reddy et al. (2005).
Planetary warming produced by aerosols in high-latitude and polar regions, such as Greenland, are of much interest because of its relation to climate change issues (melt-ing of ice, e.g. Rignot and Kanagaratnam, 2006). Negative DRE values of similar or even stronger magnitude are also expected at least over the Arctic in January, because
10
of the presence of Arctic haze (e.g. Hu et al., 2005; Yamanouchi et al., 2005) involving long-range transport of anthropogenic pollution from industrialized areas in Europe, North America and Asia. Such features do not appear in Figs. 1 and 2, however, be-cause they correspond to areas with missing data.
The largest values of ∆FTOAoccur in tropical and subtropical latitudes, and especially
15
over continental desert areas (e.g. Sahara, Arabian peninsula, Taklimakan and Gobi in Asia, and central Australia), over oceanic areas over which are transported dust and smoke from biomass burning (e.g. off the coast of west Africa in the tropical Atlantic Ocean, Arabian Sea) and over remote oceanic areas with intense production of sea-spray (storm-track zone of the Southern Hemispere), especially in January. The
20
features shown in Fig. 1 are in agreement with those found from satellite-based studies (e.g. Loeb and Manalo-Smith, 2005; Yu et al., 2006), though some other features such as those associated with dust transport from Asia across the Pacific Ocean, are not well captured by GADS properties, perhaps due to the different periods considered (i.e. 1984-1995 here, against after 2000 in satellite-based studies). The magnitude of
25
∆FTOAand ∆Rpfor a specific place on the globe is determined by AOT, cloud cover and
surface albedo, apart from the incoming solar flux. Thus, large values, up to 9 Wm−2,
appear in regions with small cloudiness and significant aerosol loads, e.g. sub-Sahel, Gobi and Australian deserts, as well as Middle-East and India in January. In July,
ACPD
7, 753–783, 2007 Direct effect of aerosols on solar radiation N. Hatzianastassiou et al. Title Page Abstract Introduction Conclusions References Tables Figures ◭ ◮ ◭ ◮ Back CloseFull Screen / Esc
Printer-friendly Version Interactive Discussion
EGU
large positive values (up to 15 Wm−2) exist over limited maritime areas such as the
eastern Mediterranean basin and the Red Sea, and secondarily over continental areas such as Australia. Note that highly populated and industrialized urban areas such as Europe and North America are found to have relatively smaller values of ∆FTOAdespite
relatively large AOT values, especially in the visible wavelengths. We note that small
5
values of aerosol DRE at TOA do not exclude important aerosol effects taking place within the Earth-atmosphere system, since the effect at TOA is the sum of the effects of aerosols in the atmosphere and at the surface. The aerosol effects on the radiation budgets of the atmosphere and surface are examined separately, in the following two subsections.
10
Overall, the large modifications of OSR produced by aerosols on a climatological basis, equivalent to changes in planetary albedo of ∆Rp=± 1-2% at the geographical
cell level, can have a strong climatic impact. Aerosol modifications to spatial gradients in OSR can affect general circulation patterns in the atmosphere and hence climate, as shown by GCM studies (Krist ´ansson et al., 2005; Lau et al., 2006).
15
3.2 Aerosol direct radiative effect in the atmosphere (∆Fatmab)
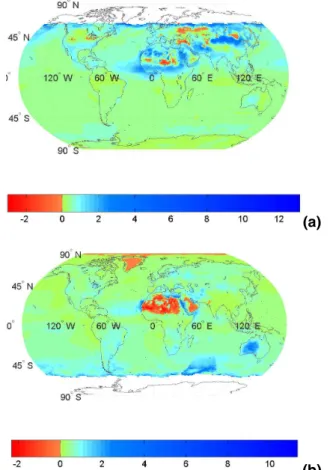
The aerosol DRE on the atmospheric absorption of SW radiation under all-sky condi-tions, ∆Fatmab, is very important and can be as large as 35 Wm−2 (Fig. 3).
Neverthe-less, over the oceans it is generally ∆Fatmab<3 Wm−2, whereas over most
continen-tal areas it is ∆Fatmab <15 Wm−2. The largest values of ∆Fatmab (15–35 Wm−2) are
20
found over areas characterized by significant amounts of absorbing aerosols (such as mineral-dust or soot), especially over highly reflecting surfaces (surface albedo>0.3) in
tropical and subtropical latitudes, but large values are also found over the Middle-East, South and South-East Asia, Europe, USA, South America, South Africa, and Australia. Large values of ∆Fatmab are found over oceans only for transported aerosols of
con-25
tinental origin. This occurs across the tropical Atlantic due to long-range transport of desert dust at higher atmospheric levels (e.g. Formenti et al., 2003; Moulin and
Chi-ACPD
7, 753–783, 2007 Direct effect of aerosols on solar radiation N. Hatzianastassiou et al. Title Page Abstract Introduction Conclusions References Tables Figures ◭ ◮ ◭ ◮ Back CloseFull Screen / Esc
Printer-friendly Version Interactive Discussion
EGU
apello, 2004) by the “harmattan” trade winds during the dry season (this transport is shifted northwards in July due to the changed atmospheric circulation, Azores anticy-clone and thermal low of Pakistan), as well as over the Yellow and Japan Seas due to Asian dust exported from the Gobi desert (e.g. Sun et al., 2001; Liu et al., 2003). The strong increase in atmospheric absorption of solar radiation is either associated with
5
large mass concentrations of absorbing mineral aerosol components or with significant (but smaller) concentrations of strongly absorbing soot or water soluble and insoluble components, especially in the presence of large amounts of solar radiation and over highly reflecting surfaces underneath. The enhancement of absorbed solar radiation is converted into heat. The resulting atmospheric heating rate can be calculated from the
10
First Law of Thermodynamics and hydrostatic equilibrium
∂T ∂t = g cp ∆F ∆P (2)
where ∂T/∂t is the heating rate (K day−1), g is the acceleration due to gravity, c p
the specific heat capacity of air at constant air pressure (∼1006 J Kg−1 K−1) and P is the atmospheric pressure, respectively. The estimated ∆Fatmab translates into an
15
atmospheric heating rate of 0.98 K day−1for ∆Fatmab= 35 Wm−2for ∆P =300 mb
(mid-latitude pressure width of troposphere), whereas the atmospheric heating rate over oceans is<0.14 K day−1(for ∆F
atmab<5 Wm−2).
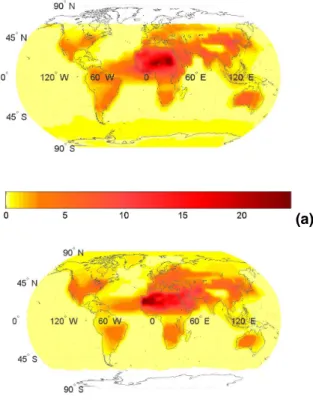
3.3 Aerosol direct radiative effect at surface (∆Fsurfnet)
Through scattering and absorption, together natural and anthropogenic aerosols
de-20
crease drastically the downwelling and absorbed solar radiation at the Earth’s surface by up to 45 and 35 Wm−2, respectively. As shown in Fig. 4, large values of ∆Fsurfnetare
found over continental areas, especially over deserts and polluted regions of the world. Thus, the absorbed SW radiation by the surface is decreased by 20–35 Wm−2 in the Sahara and Sahel, by 10–20 Wm−2 in the sub-Sahel, Arabian peninsula and
Middle-25
ACPD
7, 753–783, 2007 Direct effect of aerosols on solar radiation N. Hatzianastassiou et al. Title Page Abstract Introduction Conclusions References Tables Figures ◭ ◮ ◭ ◮ Back CloseFull Screen / Esc
Printer-friendly Version Interactive Discussion
EGU
thickness, AOT, is the determinant parameter for ∆Fsurfnet. Smaller ∆Fsurfnet values
(<5–7 Wm−2) are found over oceans, due to the optically thin aerosol layers there.
Only in oceanic areas close to land and areas where long-range transport of aerosols takes place, the values of ∆Fsurfnetbecome as large as 10–15 Wm−2. The strong
de-crease in surface solar radiation due to aerosols produces strong surface radiative
5
cooling. For oceanic layers of 10 m depth, and using Eq. (2) and a cp of water equal to ∼4184 J Kg−1 K−1, a value of 7 Wm−2 for ∆F
surfnet translates to an oceanic water
cooling rate of –0.015 K day−1. For land, using a 1 m deep soil layer with a cpvalue of 800 J Kg−1 K−1, the estimated cooling rate is equal to –1.24 K day−1for ∆F
surfnetequal
to 15 W m−2.
10
The drastic decrease of surface solar radiation due to aerosols, an effect which is called global dimming, is very important since it can modulate the hydrological cycle (e.g. Jacobson, 2001; Kaufman et al., 2002; Ramanathan et al., 2001). Recent studies (e.g. Lau et al., 2006) have shown that on time-scales of climate change, the cooling of the Earth’s surface might lead to a gradual spin-down of the tropical water cycle
15
and the eventual weakening of the Asian monsoons. The values of ∆Fsurfnetare larger
compared to those of ∆FTOA and ∆Fatmab (Figs. 1 and 3, respectively), so that the
aerosol DRE is much larger at the Earth’s surface than at TOA or in the atmosphere. This is further discussed in the next section.
3.4 Ratio of top-of-atmosphere to surface shortwave aerosol direct radiative effect
20
The three types of DRE satisfy the conservation condition
∆FTOA+ ∆Fsurfnet+ ∆Fatmab=0 (3)
The atmospheric absorption of aerosols and ∆Fsurfnet can not be directly estimated
from satellite observations. When ∆Fatmabvalues are extremely small, then ∆FTOAand
∆Fsurfnet are essentially equal and opposite and this permits the surface DRE to be
25
ACPD
7, 753–783, 2007 Direct effect of aerosols on solar radiation N. Hatzianastassiou et al. Title Page Abstract Introduction Conclusions References Tables Figures ◭ ◮ ◭ ◮ Back CloseFull Screen / Esc
Printer-friendly Version Interactive Discussion
EGU
scattering aerosols.
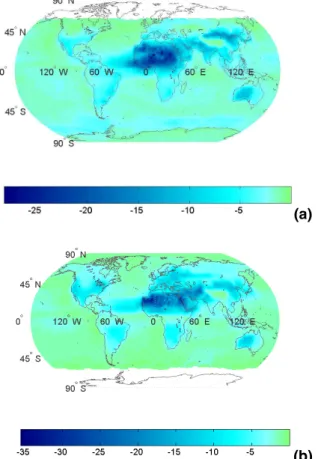
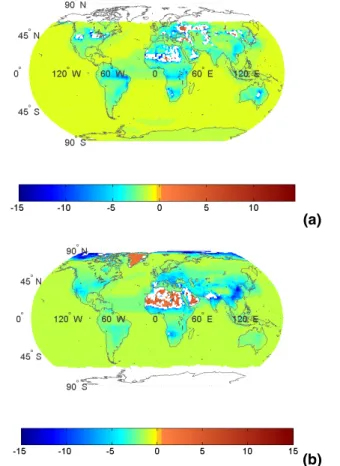
Computed values of the ratio ∆Fsurfnet/∆FTOA are given in Fig. 5. The ratio ranges
from –10 to 10 over most of the oceanic and land areas, demonstrating the dominance of the surface to TOA aerosol DRE. Note that in cases of very small ∆FTOAvalues, the
ratio’s magnitude can be much larger than 15, but without any physical meaning, and
5
hence such areas have been masked in Fig. 5 (white shaded areas e.g. in Sahara and Arabian peninsula). When the ratio takes values close to 1, the magnitude of surface forcing equals that at TOA, which means that ∆Fatmab is negligible. In case of large
negative ∆Fsurfnet/∆FTOA values, the ratio ∆Fatmab/∆FTOA is also large when there are
strongly absorbing aerosols in the atmosphere (ωaer<0.95), e.g. over southern and 10
eastern Asia, sub-Sahel, south Africa, and Europe in July, especially when surface albedo is large; this is the case of northern polar latitudes in July. Regions with red-dish color correspond to identical sign values of DRE at TOA and surface; given that ∆Fsurfnetis always negative (see Fig. 4), these regions must have negative ∆FTOA
val-ues, i.e. they are characterized by planetary warming due to aerosols. This occurs over
15
regions with large surface albedo and strongly absorbing aerosols above, e.g. Sahara, Arabian peninsula, Greenland.
Further, our results indicate that over many areas of the globe the surface DRE of aerosols can be up to 3–4 times larger than at TOA, in general agreement with the findings of Ramanathan et al. (2001) and Kaufman et al. (2002), but there are
20
also many areas where the ratio exceeds 5, as also reported recently by Chung et al. (2005).
3.5 Global and hemispherical averages of aerosol direct radiative effects
Global and hemispherical averages of SW DREs at TOA, in the atmosphere and at sur-face were also estimated, by including sursur-face area weighting in the computations, and
25
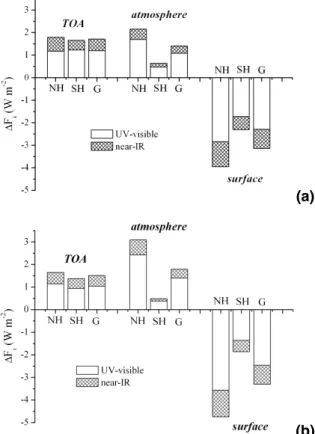
the results are given in Table 1 and Fig. 6. The largest DRE arising from natural plus anthropogenic aerosols is found at the surface, where it is about twice the DREs in the atmosphere and at TOA, irrespective of the hemisphere; the downward and absorbed
ACPD
7, 753–783, 2007 Direct effect of aerosols on solar radiation N. Hatzianastassiou et al. Title Page Abstract Introduction Conclusions References Tables Figures ◭ ◮ ◭ ◮ Back CloseFull Screen / Esc
Printer-friendly Version Interactive Discussion
EGU
fluxes are decreased by about 3.9 and 3.2 Wm−2, respectively, on a global scale. In the
atmosphere, solar radiation absorption increases by about 1.5 Wm−2, and the globally averaged reflected solar flux to space increases by about 1.7 W m−2. Our model value
at TOA is in good agreement with other recent estimates from measurement-based approaches (e.g. Loeb and Manalo-Smith, 2005; Yu et al. 2006 review paper), ranging
5
between –1.5 and –2.0 Wm−2. For both ∆F
atmab and ∆Fsurfnet there are large
inter-hemispherical differences, with the largest effect of aerosols taking place in the more polluted and less cloudy northern hemisphere. More specifically, the northern hemi-spherical values for ∆Fatmab are larger than the southern ones by factors of 3.3 and
6.3 in January and July, respectively, while the corresponding factors for ∆Fsurfnet are
10
1.7 and 2.5, i.e. they are quite smaller. On the contrary, very small inter-hemispherical differences are found for ∆FTOA, as a result of the combination of ∆Fatmaband ∆Fsurfnet.
In general, the magnitude of global hemispherical aerosol DREs at surface and in the atmosphere is slightly (by factors 1.3 and 1.1, respectively) larger in July than in Jan-uary. Also, significant differences in the relative importance of the DREs at TOA, in the
15
atmosphere and at the surface, are found between the two hemispheres. For example, the ratio ∆Fsurfnet/∆Fatmab is about –1.7 in the northern hemisphere and –3.7 in the
southern hemisphere. This inter-hemispherical contrast indicates the different nature of aerosols, being much more scattering in the cleaner southern hemisphere compared to the more absorbing nature of those in the northern hemisphere that includes many
20
anthropogenic sources and most of the world’s deserts. As for the spectral contribution to the total SW DREs (see Fig. 6), it appears that for all DRE components, both for summer and winter and both hemispheres, the largest contribution (about 70–80%) is in the UV-visible wavelengths.
A comparison of our computations of aerosol DREs at TOA and at the Earth’s surface
25
under all-sky conditions with other estimates based on satellite observations and multi-component aerosol models is presented in Table 2. Very few published results for ∆Fsurfnet exist in literature, unlike for ∆FTOA. The present estimate of all-sky global
ACPD
7, 753–783, 2007 Direct effect of aerosols on solar radiation N. Hatzianastassiou et al. Title Page Abstract Introduction Conclusions References Tables Figures ◭ ◮ ◭ ◮ Back CloseFull Screen / Esc
Printer-friendly Version Interactive Discussion
EGU
models (ranging from –0.24 to –1.28 Wm−2), while it is very close to the estimates
by Yu et al. (2004, 2006) based on measurement-based approaches. We note that estimates computed with coupled aerosol and general circulation models are not only based on a restricted number of spectral intervals but are also based on generated global distributions of cloud cover fractions that are not as accurate as those from
5
satellite observations, as used in our study.
4 Summary and Conclusions
In this study, we quantified the global-scale direct radiative effect (DRE) of natural plus anthropogenic aerosols on solar radiation. This was accomplished by using a detailed spectral radiative transfer model covering the UV, visible, and near-IR wavelengths
10
together with spectral aerosol optical properties (optical thickness, single scattering albedo and asymmetry parameter) taken from the Global Aerosol Data Set (GADS). This is in contrast to other similar studies often treating the whole solar spectrum as one spectral interval. The state of the atmosphere (clouds included) and that of the Earth’s surface were specified using reanalysis data sets and satellite measurements.
15
Therefore, the DRE on the outgoing SW radiation at the top of atmosphere (∆FTOA), on
atmospheric absorption (∆Fatmab), and on the downward and absorbed SW radiation
at the Earth’s surface (∆Fsurf and ∆Fsurfnet) were computed for realistic conditions of
the Earth-atmosphere system for the 12-year period 1984–1995. The results are given for January and July at 1◦ latitude-longitude resolution for all-sky conditions, but also
20
averaged for the two hemispheres and for the globe, and they represent a climatological assessment of aerosol DREs.
On a mean global basis, natural and anthropogenic aerosols together are found to increase the outgoing SW radiation at TOA (planetary cooling) by about 1.6 Wm−2, and
to radiatively heat the atmosphere (atmospheric heating) by increasing the absorption
25
of solar radiation by about 1.6 Wm−2. As a result, the downwelling and the absorbed SW radiation by the Earth’s surface is found to be decreased (surface cooling) by 3.9
ACPD
7, 753–783, 2007 Direct effect of aerosols on solar radiation N. Hatzianastassiou et al. Title Page Abstract Introduction Conclusions References Tables Figures ◭ ◮ ◭ ◮ Back CloseFull Screen / Esc
Printer-friendly Version Interactive Discussion
EGU
and 3.2 Wm−2, respectively, due to aerosols. Recently, Yu et al. (2006) presented in
a review paper aerosol DRE values over land+ocean from measurement-based ap-proaches under clear-sky conditions. These values when combined and adjusted to all-sky conditions are equal to –1.9 Wm−2 at TOA, and –3.4 Wm−2at surface, i.e. they
are very close to our computations (–1.6 and –3.2 Wm−2, respectively). It should be
5
noted that our computations refer to the DRE of natural plus anthropogenic aerosols. The effect of anthropogenic aerosols only, called direct climate forcing (DCF), can be derived nowadays from new-generation satellite instruments (e.g. MODIS), which are able to distinguish between fine (submicron) and coarse (supermicron) aerosols. Thus, recent estimates under all-sky conditions (e.g. Bellouin et al. 2005) give a DCF at
10
TOA equal to -0.8±0.1 W m−2 and at surface equal to -1.9±0.2 Wm−2, values that correspond to about 50% of our computed total aerosol DRE. There are also other model-based estimates of DCF with smaller magnitude, such as those of –0.65 Wm−2
by Penner et al. (1998), –0.19 and –0.1 Wm−2 by Takemura et al. (2002) and (2005), respectively, and –0.35 Wm−2by Chung et al. (2005).
15
The magnitude of the combined radiative effect of natural and anthropogenic aerosols at TOA (∆FTOA), which is equivalent to an increase in planetary albedo of
the order of 1%, is very important for the climate of the Earth-atmosphere system, since it is comparable to that of climate forcing induced by elevated concentrations of greenhouse gases (about 2.4 Wm−2, IPCC, 2001). Nevertheless, the largest DRE
oc-20
curs at surface (∆Fsurfnet, about double ∆FTOA) having the potential for major effects
on surface radiation budget (SRB), evaporation, and the hydrological cycle. The mean global enhanced absorption of solar radiation by 1.5 Wm−2 translates to an estimated atmospheric heating rate of 0.01 K day−1. The major part of the computed DREs is for
the northern hemisphere, which has most anthropogenic aerosol sources and desert
25
areas, while larger DREs occur in July than in January.
According to our computations, a large percentage of the incident solar radiation at TOA is radiatively forced by aerosols. More specifically, these percentages can be as large as 13% at the Earth’s surface and TOA, and 7% in the atmosphere. Furthermore,
ACPD
7, 753–783, 2007 Direct effect of aerosols on solar radiation N. Hatzianastassiou et al. Title Page Abstract Introduction Conclusions References Tables Figures ◭ ◮ ◭ ◮ Back CloseFull Screen / Esc
Printer-friendly Version Interactive Discussion
EGU
the aerosol effect on planetary albedo (∆Rp) can even change sign. Thus, although it
is found that in general, natural and anthropogenic aerosols together cool the Earth-atmosphere system, through scattering of SW radiation back to space, by up to about 15 Wm−2, aerosols are also found to produce planetary warming (by up to 10 Wm−2) over areas such as Sahara, Arabian peninsula, Siberia and Greenland. Regionally, the
5
aerosol particles warm the atmosphere by absorbing solar radiation by up to 35 Wm−2.
The largest aerosol-induced atmospheric warming occurs above areas characterized by strongly absorbing mineral dust particles, especially over highly reflecting deserts. The estimated ∆Fatmab values translate into a tropospheric maximum heating rate of
0.98 K day−1 over land, and <0.14 K day−1 over oceans. At the Earth’s surface, the
10
downward and absorbed SW radiation is decreased by up to 45 and 30 Wm−2,
respec-tively, due to aerosol scattering and absorption. Regionally, the ratio of surface to TOA aerosol SW DRE changes from strong negative values of –10 to –15 to strong positive values up to 15, which indicates the important role of both natural and anthropogenic aerosols for surface processes and the surface radiation budget. This strong surface
15
SW cooling combined with an associated atmospheric warming, can have important consequences on atmospheric circulation, since it can create more stable atmospheric conditions (by decreasing the vertical atmospheric temperature gradient) and lower surface evaporation, resulting in less clouds and precipitation, thus enhancing deserti-fication processes, especially in semi-arid regions such as the Mediterranean basin or
20
northern Africa.
Acknowledgements. This research was co-funded by the European Social Fund & National Resources-EPEAEK II – PYTHAGORAS (contract: 1964). The NASA-Langley data were ob-tained from the NASA Langley Research Center (LaRC) Atmospheric Sciences Data Cen-ter (ASDC). The GADS aerosol data were obtained from the Meteorological Institute of the
25
University of Munich, Germany (http://www.meteo.physik.uni-muenchen.de/strahlung/aerosol/ aerosol.htm).
ACPD
7, 753–783, 2007 Direct effect of aerosols on solar radiation N. Hatzianastassiou et al. Title Page Abstract Introduction Conclusions References Tables Figures ◭ ◮ ◭ ◮ Back CloseFull Screen / Esc
Printer-friendly Version Interactive Discussion
EGU
References
Bellouin, N., Boucher, O., Haywood, J., and Reddy, M. S.: Global estimate of aerosol direct radiative forcing from satellite measurements, Nature, 438, 1138–1141, 2005.
Bush, B. C. and Valero, F. P. J.: Surface aerosol radative forcing at GOSAN during the ACE-Asia campaign, J. Geophys. Res., 108, D23, 8660, doi:10.1029/2002JD003233, 2003.
5
Cattrall, C., Karder K. L., and Gordon, H. R.: Columnar single-scattering albedo and phase function retrieved from sky radiance over the ocean: Measurements of Saharan dust, J. Geophys. Res., 108, 4287, doi:10.1029/2002JD002497, 2003.
Chin, M., Ginoux, P., Kinne, S., Torres, O., Holben, B. N., Duncan, B. N., Martin, R. V., Logan, J. A., Higurashi, A., and Nakajima, T.: Tropospheric aerosol optical thickness from the
GO-10
CART model and comparisons with satellite and Sun photometer measurements, J. Atmos. Sci., 59, 461–483, 2002.
Christopher, S. A. and Zhang, J.: Shortwave aerosol radiative forcing from MODIS and CERES observations over the oceans, Geophys. Res. Lett., 29, 1859, doi:10.1029/2002GL014803, 2002.
15
Christopher, S. A., Zhang, J. A., Kaufman, Y. J., and Remer, L. A.: Satellite-based assess-ment of top of atmosphere anthropogenic aerosol radiative forcing over cloud-free oceans, Geophys. Res. Lett., 33, L15816, doi:10.1029/2005GL025535, 2006.
Chu, D. A., Kaufman, Y. J., Ichoku, C., Remer, L. A., Tanr ´e, D., and Holben, B. N.: Vali-dation of MODIS aerosol optical depth retrieval over land, Geophys. Res. Lett., 29 (12),
20
doi:10.1029/2001GL013205, 2002.
Chung, C. E., Ramanathan, V., Kim, D., and Podgorny, I. A.: Global anthropogenic aerosol direct forcing derived from satellite and ground-based observations, J. Geophys. Res., 110, D24207, doi:10.1029/2005JD006356, 2005.
Dubovik, O., Holben, B. N., Eck, T. F., Smirnov, A., Kaufman, Y. J., King, M. D., Tanr ´e, D.,
25
Logan, and Slutsker, Y.: Variability of absorption and optical properties of key aerosol types observed in worldwide regions, J. Atmos. Sci., 59, 590–608, 2002.
Formenti P., Elbert, W., Maenhaut, W., Haywood, J., and Andreae, M. O.: Chemical com-position of mineral dust aerosol during the Saharan Dust Experiment (SHADE) airborne campaign in the Cape Verde region, September 2000, J. Geophys. Res., 108 (D18), 8576,
30
doi:10.1029/2002JD002648, 2003.
ACPD
7, 753–783, 2007 Direct effect of aerosols on solar radiation N. Hatzianastassiou et al. Title Page Abstract Introduction Conclusions References Tables Figures ◭ ◮ ◭ ◮ Back CloseFull Screen / Esc
Printer-friendly Version Interactive Discussion
EGU
forcing, Clim. Change, 75, 195–214, 2006.
Hatzianastassiou, N., Katsoulis, B. and Vardavas, I.: Global distribution of aerosol direct radia-tive forcing in the ultraviolet and visible arising under clear skies, Tellus, 56B, 51–71, 2004a. Hatzianastassiou, N., Katsoulis, B., and Vardavas, I.: Sensitivity analysis of aerosol direct
ra-diative forcings in the ultraviolet – visible wavelengths and consequences for the heat budget,
5
Tellus, 56B, 368–381, 2004b.
Hatzianastassiou, N., Matsoukas, C., Fotiadi, A., Stackhouse, P. W. Jr., Koepke, P., Drakakis, E., Pavlakis, K. G., Hatzidimitriou, N., and Vardavas, I.: Modelling the direct effect of aerosols in the solar near infrared on a planetary scale, Atmos. Chem. Phys. Disc., 6, 9151–9185, 2006.
10
Hu, R.-M., Blanchet, J.-P. and Girard, E.: Evaluation of the direct and indirect radiative and climate effects of aerosols over the western Arctic, J. Geophys. Res., 110, D11213, doi:10.1029/2004JD005043, 2005.
Intergovernmental Panel on Climate Change (IPCC): Climate Change 2001, in: The Scientific Basis, 881 pp., edited by: Houghton J. T., Ding, Y., Griggs, D. J., et al., Cambridge Univ.
15
Press, New York, 2001.
Jacobson, M. Z.: Global direct radiative forcing due to multicomponent anthropogenic and natural aerosols, J. Geophys. Res., 106, 1551–1568, 2001.
Joseph, J., H., Wiscombe, W. J., and Weinmann, J. A.: The Delta-Eddington approximation of radiative flux transfer, J. Atmos. Sci., 33, 2452–2459, 1976.
20
Kaufman, Y. J., Tanr ´e, D., Dubovik, O., Karnieli, A., and Remer, L. A.: Absorption of sunlight by dust as inferred from satellite and ground-based measurements, Geophys. Res. Lett., 28, 1479–1482, 2001.
Kaufman, Y. J., Tanr ´e, D., and Boucher, O.: A satellite view of aerosols in the climate system, Nature, 419, 215–223, 2002.
25
King, M. D., Kaufmann, Y. J., Tanr ´e, D., and Nakajima, T.: Remote sensing of tropospheric aerosols from space: Past, present, and future, Bull. Am. Meteorol. Sos., 80, 2229–2259, 1999.
Koch, D. and Hansen, J.: Distant origins of Arctic black carbon: A Goddard Institute for Space Studies ModelE experiment, J. Geophys. Res., 110, D04204, doi:10.1029/2004JD005296,
30
2005.
Koepke, P., Hess, M., Schult, I., and Shettle, E. P.: Global aerosol data set. Rep. No 243, Max-Planck Institut f ¨ur Meteorologie, 44 pp., Hamburg, Germany, 1997.
ACPD
7, 753–783, 2007 Direct effect of aerosols on solar radiation N. Hatzianastassiou et al. Title Page Abstract Introduction Conclusions References Tables Figures ◭ ◮ ◭ ◮ Back CloseFull Screen / Esc
Printer-friendly Version Interactive Discussion
EGU
Kristj ´ansson, J. E., Iversen, T., Kirkev ˚ag A., Seland, Ø, and Debernard, J.: Response of the climate system to aerosol direct and indirect forcing: Role of cloud feedbacks, J. Geophys. Res., 110, D24206, doi:10.1029/2005JD006299, 2005.
Lau, K. M., Kim, M. K., and Kim, K. M.: Asian summer monsoon anomalies induced by direct forcing: The role of the Tibetan plateau, Clim. Dyn., 26, 855–864, 2006.
5
Liao, H., Seinfeld, J. H., Adams, P. J., and Mickley, L. J.: Global radiative forcing of coupled tropospheric ozone and aerosols in a unified general circulation model, J. Geophys. Res., 109, D16207, doi:10.1029/2003JD004456, 2004.
Liu, H., Westphal, D., Wang, S., Shimizu, A., Sugimoto, N., Zhou, J., and Chen, Y.: A high-resolution numerical study of the Asian dust storms of April 2001, J. Geophys. Res., 108,
10
D23, 8653, doi:10.1029/2002JD003178, 2003.
Loeb, N. G. and Manalo-Smith, N.: Top-of-atmosphere direct radiative effect of aerosols over global oceans from merged CERES and MODIS observations, J. Climate, 18, 3506–3526, 2005.
Morcrette, J.-J.: The surface downward longwave radiation in the ECMWF forecast system, J.
15
Climate, 15, 1875—1992, 2002.
Moulin, C. and Chiapello, I.: Evidence of the control of summer atmospheric transport of African dust over the Atlantic by Sahel sources from TOMS satellites (1979-2000), Geophys. Res. Lett., 31, L02107, doi:10.1029/2003GL018931, 2004.
Nishizawa, T., Asano, S., Uchiyama, A., and Yamazaki, A.: Seasonal variation of aerosol direct
20
radiative forcing and optical properties estimated from ground-based solar radiation mea-surements, J. Atmos. Sci., 61, 57–72, doi: 10.1175/1520-0469(2004)061, 2004.
Penner, J. E., Chuang, C. C., and Grant, K.: Climate forcing by carbonaceous and sulfate aerosols, Climate. Dyn., 14, 839–851, 1998.
Podgorny I. A. and Ramanathan, V.: A modeling study of the direct effect of aerosols over the
25
tropical Indian Ocean, J. Geophys. Res., 106, 24 097–24 105, 2001.
Ramanathan, V., Crutzen, P. J., Kiehl, J. T., and Rosenfeld, D.: Aerosols, climate, and the hydrological cycle, Science, 294, 2119–2124, 2001.
Redemann, J., Pilewskie, P., Russell, P. B., Livingston, J. M., Howard, S., Schmidt, B., Pommier, J., Gore, W., Eilers, J., and Wendisch, M.: Airborne measurements of spectral direct aerosol
30
radiative forcing in the Intercontinental chemical Transport Experiment/Intercontinental Transport and Chemical Transformation of anthropogenic pollution, 2004, J. Geophys. Res., 111, D14210, doi:10.1029/2005JD006812, 2006.
ACPD
7, 753–783, 2007 Direct effect of aerosols on solar radiation N. Hatzianastassiou et al. Title Page Abstract Introduction Conclusions References Tables Figures ◭ ◮ ◭ ◮ Back CloseFull Screen / Esc
Printer-friendly Version Interactive Discussion
EGU
Reddy, M. S., Boucher, O., Bellouin, N., Schulz, M., Balkanski, Y., Dufresne, J.-L., and Pham, M.: Estimates of global multicomponent aerosol optical depth and direct radiative perturba-tion in the Laboratoire de M ´et ´eorologie Dynamique general circulaperturba-tion model, J. Geophys. Res., 110, D10S16, doi:10.1029/2004JD004757, 2005.
Remer, L. A. and Kaufman, Y. J.: Aerosol direct radiative effect at the top of the atmosphere
5
over cloud free ocean derived from four years of MODIS data, Atmos. Chem. Phys., 6, 237– 253, 2006,http://www.atmos-chem-phys.net/6/237/2006/.
Rignot, E. P. and Kanagaratnam, P.: Changes in the Velocity Structure of the Greenland Ice Sheet, Science, 311, no 5763, doi:10.1126/science.1121381, 986–990, 2006.
Rossow, W. B., Walker, A. W., Beuschel, D. E., and Roiter, M. D.: International Satellite Cloud
10
Climatology Project (ISCCP). Documentation of new cloud datasets, 115 pp., Wold Meteorol. Org. Geneva, 1996.
Shettle, E. P. and Weinmann, J. A.: The transfer of solar irradiance through inhomogeneous turbid atmospheres evaluated by Eddington’s approximation, J. Atmos. Sci., 27, 1048–1055, 1970.
15
Stackhouse, P. W., Gupta, S. K., Cox, S. J., Mikowitz, C., and Chiacchio, M.: New results from the NASA/GEWEX Surface Radiation Budget project: Evaluating El Nino effects at dif-ferent scales, 11th American Meteorological Society Conference on Atmospheric Radiation, Ogden, UT, USA, P.3.6, 2002.
Sun, J., Zhang, M., and Liu, T.: Spatial and temporal characteristics of dust storms in China
20
and its surrounding regions, 1960–1999: Relations to source area and climate, J. Geophys. Res., 106, D10, 10 325–10 333, 2001.
Takemura, T., Nakajima, H. T., Dubovik, O., Holben, B. N., and Kinne, S.: Single-scattering albedo and radiative forcing of various aerosol species with a global three-dimensional model, J. Climate, 15, 333–352, 2002.
25
Takemura, T., Nakajima, T., Dubovik, O., Holben, B. N., and Kinne, S.: Single-scattering albedo and radiative forcing of various aerosol species with a global three-dimensional model, J. Climate, 15, 333–352, 2005.
Tanr ´e, D., Haywood, J., Pelon, J., L ´eon, J. F, Chatenet, B., Formenti, P., Francis, P., Goloub, P., Highwood, E. J. and Myhre, G.: Measurement and modelling of the Saharan dust radiative
30
impact: Overview of the Saharan Dust Experiment (SHADE), J. Geophys. Res., 108, D18, 8574, 10.1029/2002JD003273, 2003.
ACPD
7, 753–783, 2007 Direct effect of aerosols on solar radiation N. Hatzianastassiou et al. Title Page Abstract Introduction Conclusions References Tables Figures ◭ ◮ ◭ ◮ Back CloseFull Screen / Esc
Printer-friendly Version Interactive Discussion
EGU
components, Nature Phys. Sci., 229, 6–9, 1971.
Treffeisen, R., Rinke, A., Fortmann, M., Dethloff, K., Herber, A., and Yamanouchi, T.: A case study of the radiative effects of arctic aerosols in March 2000, Atmos. Environ, 39, 899–911, 2005.
Vardavas, I. and Carver, J. H.: Solar and terrestrial parameterizations for radiative convective
5
models, Planet. Space Sci., 32, 1307–1325, 1984.
Willson, R. C.: Total solar irradiance trend during solar cycles 21 and 22, Science, 277, 1963– 1965, 1997.
Yamanouchi, T, Treffeisen, R., Herber, A., Shiobara, M., Yamagata, S., Hara, K., Sato K., Yabuki, M., Tomikawa, Y., Rinke, A., Neuber, R., Schumachte,r R., Kriews, M., Strom, J.,
10
Schrems, O., and Gernandt, H.: Arctic Study of Tropospheric Aerosol and Radiation (ASTAR) 2000: Arctic haze case study, Tellus, 57B, 141–152, 2005.
Yu, H., Dickinson, R. E., Chin, M., Kaufman, Y. J., Zhou, M., Zhou, L., Tian, Y., Dubovik, O., and Holben, B. N.: The direct radiative effect of aerosols as determined from a com-bination of MODIS retrievals and GOCART simulations, J. Geophys. Res., 109, D03206,
15
doi:10.1029/2003JD003914, 2004.
Yu, H., Kaufman, Y. J., Chin, M., Feingold, G., Remer, L. A., Anderson, T. L., Balkanski, Y., Bellouin, N., Boucher, O., Christopher, S., DeCola, P., Kahn, R., Koch, D., Loeb, N., Reddy, M.S., Schulz, M., Takemura, T., and Zhou, M.: A review of measurement-based assessment of aerosol direct radiative effect and forcing, Atmos. Chem. Phys., 6, 613–666, 2006,
20
http://www.atmos-chem-phys.net/6/613/2006/.
Zhang, J., Christopher, S. A., Remer, L. A., and Kaufman, Y. J.: Shortwave aerosol cloud-free radiative forcing from Terra, II: Global and seasonal distributions, J. Geophys. Res., D10S24, doi:10.1029/2004JD005009, 2005.
Zhao, T. X.-P., Laszlo, I., Minnis, P., and Remer, L.: Comparison and analysis of two aerosol
re-25
trievals over the ocean in the Terra/Clouds and the Earth’s Radiant Energy System-Moderate Resolution Imaging Spectroradiometer single scanner footprint data: 1. Global evaluation, J. Geophys. Res., 110, D21208, doi:10.1029/2005JD005851, 2005.
Zhou, M., Yu, H., Dickinson, R. E., Dubovik, O., and Holben, B. N.: A normalized descrip-tion of the direct effect of key aerosol types on solar radiadescrip-tion as estimated from Aerosol
30
Robotic Network aerosols and Moderate Resolution Imaging Spectroradiometer albedos, J. Geophys. Res., 110, D19202, doi:10.1029/2005JD005909, 2005.
ACPD
7, 753–783, 2007 Direct effect of aerosols on solar radiation N. Hatzianastassiou et al. Title Page Abstract Introduction Conclusions References Tables Figures ◭ ◮ ◭ ◮ Back CloseFull Screen / Esc
Printer-friendly Version Interactive Discussion
EGU
Table 1. Mean global and hemispherical (NH, SH) all-sky shortwave aerosol direct radia-tive effect (DRE, denoted as ∆F in W m−2) for January and July. The DRE components are
given in terms of: outgoing radiation at TOA (∆FTOA), radiation absorbed in the atmosphere
(∆Fatmab), downward radiation at surface (∆Fsurf), and net downward (absorbed) radiation at
surface (∆Fsurfnet).
∆FTOA ∆Fatmab ∆Fsurf ∆Fsurfnet
January Globe 1.72 1.41 –3.87 –3.13 North Hemisphere 1.79 2.16 –4.96 –3.95 South Hemisphere 1.66 0.65 –2.79 –2.31 July Globe 1.51 1.79 –4.0 –3.3 North Hemisphere 1.65 3.09 –5.83 –4.74 South Hemisphere 1.37 0.49 –2.17 –1.86
ACPD
7, 753–783, 2007 Direct effect of aerosols on solar radiation N. Hatzianastassiou et al. Title Page Abstract Introduction Conclusions References Tables Figures ◭ ◮ ◭ ◮ Back CloseFull Screen / Esc
Printer-friendly Version Interactive Discussion
EGU
Table 2.Comparison of published shortwave aerosol DRE (in W m−2
) at TOA (∆FTOA∗) and at
the Earth’s surface (∆Fsurfnet) under all-sky conditions.
∆FTOA ∆Fsurfnet NH SH Global NH SH Global Present study −1.72 −1.51 −1.62 −4.35 −2.09 −3.22 Yu et al. (2006) –1.9 –3.4 Reddy et al. (2005) –1.51 –0.58 –1.04 Liao et al. (2004) –0.93 Yu et al. (2004)a –2.08 –1.52 –1.8 –5.32 –2.56 –3.96 Yu et al. (2004)b –1.52 –1.04 –1.28 –4.16 –1.84 –3.0 Takemura et al. (2002) –0.17 –0.3 –0.24 Jacobson (2001) –1.23 a
Obtained with MODIS+GOCART (Georgia Tech/Goddard Global Ozone Chemistry Aerosol Radiation and Transport) integration
b
Obtained with GOCART alone
∗
In this Table, the sign of our ∆FTOA (Present study) has been reversed with respect to that
assumed throughout this study including Table 1, in accordance with the convention adopted by the other investigators.
ACPD
7, 753–783, 2007 Direct effect of aerosols on solar radiation N. Hatzianastassiou et al. Title Page Abstract Introduction Conclusions References Tables Figures ◭ ◮ ◭ ◮ Back CloseFull Screen / Esc
Printer-friendly Version Interactive Discussion
EGU
(a)
(b)
Fig. 1.Global distribution of the aerosol direct radiative effect (DRE) on the outgoing shortwave
ACPD
7, 753–783, 2007 Direct effect of aerosols on solar radiation N. Hatzianastassiou et al. Title Page Abstract Introduction Conclusions References Tables Figures ◭ ◮ ◭ ◮ Back CloseFull Screen / Esc
Printer-friendly Version Interactive Discussion
EGU
(a)
(b)
Fig. 2. Global distribution of change in planetary albedo (∆Rp, in %) due to the aerosol direct radiative effect (DRE), for (a) January and (b) July.
ACPD
7, 753–783, 2007 Direct effect of aerosols on solar radiation N. Hatzianastassiou et al. Title Page Abstract Introduction Conclusions References Tables Figures ◭ ◮ ◭ ◮ Back CloseFull Screen / Esc
Printer-friendly Version Interactive Discussion
EGU
(a)
(b)
Fig. 3. Global distribution of the aerosol direct radiative effect (DRE) on the atmospheric
ACPD
7, 753–783, 2007 Direct effect of aerosols on solar radiation N. Hatzianastassiou et al. Title Page Abstract Introduction Conclusions References Tables Figures ◭ ◮ ◭ ◮ Back CloseFull Screen / Esc
Printer-friendly Version Interactive Discussion
EGU
(a)
(b)
Fig. 4.Global distribution of the aerosol direct radiative effect (DRE) on the absorbed shortwave
radiation by the Earth′
ACPD
7, 753–783, 2007 Direct effect of aerosols on solar radiation N. Hatzianastassiou et al. Title Page Abstract Introduction Conclusions References Tables Figures ◭ ◮ ◭ ◮ Back CloseFull Screen / Esc
Printer-friendly Version Interactive Discussion
EGU
(a)
(b)
Fig. 5. Global distribution of the ratio of aerosol direct radiative effects ∆Fsurfnet/∆FTOA, for (a)
January and (b) July. Extremely small FTOA values, close to zero, which are associated with large ratios with no physical significance have been omitted.
ACPD
7, 753–783, 2007 Direct effect of aerosols on solar radiation N. Hatzianastassiou et al. Title Page Abstract Introduction Conclusions References Tables Figures ◭ ◮ ◭ ◮ Back CloseFull Screen / Esc
Printer-friendly Version Interactive Discussion
EGU
(a)
(b)
Fig. 6. Hemispherical and global averages of aerosol direct radiative effects (DRE) on the
shortwave radiation at: TOA (∆FTOA), in the atmosphere (∆Fatmab), and at surface (∆Fsurfnet),
for (a) January and (b) July. Each forcing is divided in ultraviolet(UV)-visible and near-infrared (IR) components. NH, SH and G correspond to North Hemisphere, South Hemisphere and Globe.