Publisher’s version / Version de l'éditeur:
Canadian Geotechnical Journal, 1, 2, pp. 94-103, 1964-03
READ THESE TERMS AND CONDITIONS CAREFULLY BEFORE USING THIS WEBSITE.
https://nrc-publications.canada.ca/eng/copyright
Vous avez des questions? Nous pouvons vous aider. Pour communiquer directement avec un auteur, consultez la
première page de la revue dans laquelle son article a été publié afin de trouver ses coordonnées. Si vous n’arrivez pas à les repérer, communiquez avec nous à PublicationsArchive-ArchivesPublications@nrc-cnrc.gc.ca.
Questions? Contact the NRC Publications Archive team at
PublicationsArchive-ArchivesPublications@nrc-cnrc.gc.ca. If you wish to email the authors directly, please see the first page of the publication for their contact information.
NRC Publications Archive
Archives des publications du CNRC
This publication could be one of several versions: author’s original, accepted manuscript or the publisher’s version. / La version de cette publication peut être l’une des suivantes : la version prépublication de l’auteur, la version acceptée du manuscrit ou la version de l’éditeur.
Access and use of this website and the material on it are subject to the Terms and Conditions set forth at
Calibration of a neutron moisture meter in Leda clay
Burn, K. N.
https://publications-cnrc.canada.ca/fra/droits
L’accès à ce site Web et l’utilisation de son contenu sont assujettis aux conditions présentées dans le site LISEZ CES CONDITIONS ATTENTIVEMENT AVANT D’UTILISER CE SITE WEB.
NRC Publications Record / Notice d'Archives des publications de CNRC:
https://nrc-publications.canada.ca/eng/view/object/?id=ef92d743-925a-4716-94ae-b2f8bdbe36a7 https://publications-cnrc.canada.ca/fra/voir/objet/?id=ef92d743-925a-4716-94ae-b2f8bdbe36a7
CALIBRATION OF A NEUTRON MOISTURE METER
I N LEDA CLAY
I<.
N.
BUIIN*A neutron moisture meter using a scintilla- tion detector for slow neutrons was previously calibrated in ~naterials carefully selected t o avoid inaccuracies resulting from neutron absorption. I'reliminary readings of moisture density in the field using this calibration, however, were not in agreement with values obtained by auger borings. Consequeritly the instrument was recalibrated; in the laboratory using samples of relnolded Leda clay; arid in the field, by taking readings throughout a summer in the natural material. Details of moisture content and density control are described. 'The new calibration curve is parallel t o the original one, b u t considerably displaced from it by what appears t o be a neutron absorption effect. Chemical analyses of the clay and pore water failed t o detect a n y elements whose capture cross-sections for neutrons are large. 'They did however indicate a high percentage of iron whose capture cross- section is a little larger than thosefor elements occurring naturally in nlineral soils. Although further research is required for confirmation of this observation, results of prelilliinary experiments point primarily t o the presence of iron in quantities large enough t o explain the discrepancy between the txvo calibration curves.
Un appareil 2 neutron employ6 pour la niesure de la teneur en eau e t faisant usage d'un dCtecte~rr de scintillation pour les neu- trons lents a CtC tout cl'abord calibre dans des matCriaux choisis avec soin pour Cviter les imprbcisions dues & I'absorption de neu- trons. Les lectures prkliminaires de I'humiditC et de la densite obtenues s u r le terrain a u moyeli de cette calibration ont C t C bien dilfitrentes d e celles obtenues dans les trous de taribre. ConsCquemment-, I'instrument a Cti: recalibre en laboratoire e n employant des Cchantillons ren1anii.s d'argile LCda, e t sur le terrain en prenant des lectures a u cours de I'CtC dans le dCpbt naturel. Les dCtails relatifs a u contrble de la densit6 et d e la teneur en eau sont dCcrits. L a nouvelle courbe de cali- bration est parallele 2 la premiere mais con- sidCrablement dCcalCe, dfi probablement A un effet d'absorption d e neutrons. Les analyses chi~niques d e l'argile et de l'eau interstitielle n'ont pas rCvClC la presence d'C1Cments dont les aires efficaces d e capture sont grandes. Elles ont indiquCes cependant une forte teneur en fer dont l'aire efficace de capture est Itgbre- ment plus grande que celles des '6lCments habituellement rencontrCs dans les sols minkraux. Quoiqu'une Ctude plus approfondie sera nkcessaire pour confirmer cette observa- tion, les resultats des expCriences prelimin- aires indiquent q u e le fer est prCsent en quantitk suffisamment grande pour expliquer la diffCrence elitre les deux courbes d e cali- bration.
Leda clay is a deposit of fine-grained marine sedi~lle~lt occ~~rring extensively in the valleys of the Ottawa and St. Lawrence Rivers, which once for~ned the basin of the post-glacial Champlain Sea. Although i t was a n arm of the Atlantic Oceail the salinity of the water in the Cha~nplairl Sea was modified b y the enorinous quantities of melt water t h a t carried the silt and c!ay particles into i t froin the retreating ice sheet.
The physical properties of Leda clay are closely linked with its water content. Significant ~noisture changes occur near the surface of the soil with seasonal variation in clilnate and result in appreciable volu~ne changes. These call lead t o damage of light structures constructed on shallow fouildations on
*Soil Mechanics Section, Division of Building Research, National Research Council, Ottawa, Canada.
94
BURN: CALIBRATION O F A NEUTRON MOISTURE METER 95
such soil, a consequence t h a t is increased by the presence of trees (Bozozuk and Burn, 1960).
In order to auglnent facilities for the study of these properties the Division of Building Research sought a method of in situ testing t h a t would make
possible repetitive measurement of moisture content in exact locations. T h e neutron method of lnoisture detection was selected and a moisture ineter of the scirltillation type was designed, constructed and calibrated in the labora- tory, using artificial media. This work was reported previously (Burn, 1960) and resulted in the calibration curve shown in Figure 1.
Based upon the experience of others, i t was hoped, although with some reserve, t h a t this curve would be valid for most soils in the field. Preliminary field tests, however, indicated substantially lower moisture contents, using
MOISTURE D E N S I T Y ( L B / F T ~ ) FIGURE 1. Calibration curve of neutron moisture meter
this relationship, than those obtained b y oven-clrying samples. As the cliffer- ences were quite large, it was considered necessary t o check the laboratory calibration o f the instrument in Lecla clay to seek the reason for the dis- crepancy.
Laboratory Co~ztrolled P o i n t s
T\vo large samples of Leda clav a t different moisture contents were obtained. Each was remoulded separately in slllall quantities to n liquid consistency ant1 stored in a humid room to prevent evaporation. When sufficiently large quantities had been prepared the samples were transferred to 43 gallon clrums.
A small pencil-type concrete vibrator was used t o break down lumps of re-gelled clay as the material was added t o each drum ancl vibrating had t h e added effect of releasing trapped air from tlie liquefied material.
I n order to obtain a third point on t h e calibration curve, the drier of t h e two samples was spread 011 a large table top for further drying. I t s ~ i ~ o i s t u r e content was kept a s ~iniform a s possible b! turning the sample every few minutes wit11 a small electric cake mixer. Althougl~ th e clay a t this reclucecl moisture content mas much stiffer than it llad been originally, it was still possible to make it flour slo\\rly in t h e drum by vibrating.
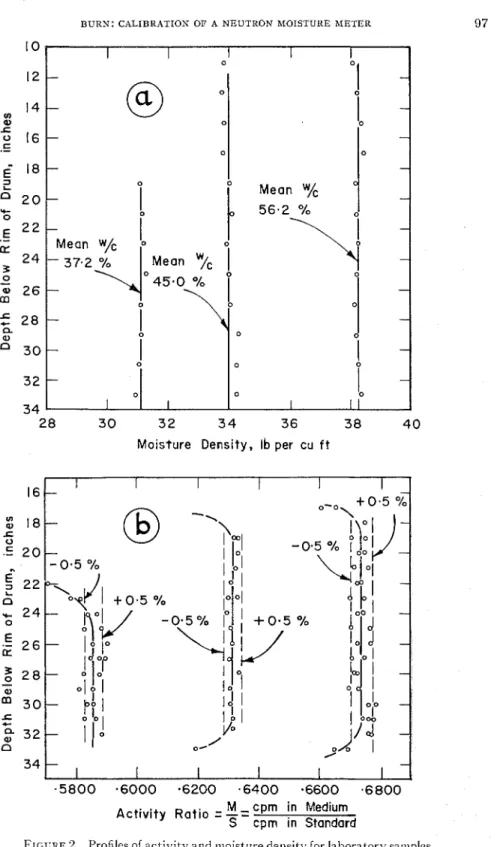
From about everv I! in. of depth three small sainples of clay were obtained for determining moisture content by oven-clr\.ing. A t about every G in. of deptli quantities of the clay were obtained for measurement of dellsit!.. T h e average ~ I I L I S obtained alas comparecl with the density obtainetl b y weighing the clrum and its contents and measuring the volume of the clay. T h e difference bet~veeil the two metl~ocls was less than 0.5 per cent. Moist~lre content clis- tl-ibution in the three clrums in tel-~ns of moist-ure clensit~- is sho\\~n in Figure 2(a).
Thermal neutron activity was recorclecl for each inch of d e p t h , ancl ratios of these reaclings t o readings in a \$;as st;~nclard were calc~ilatecl (Figure 2 ( b ) ) . h!Iean values of those act-ivit!; ratios un:lffected b > ~ the upper and lower limits of tlie srunple were cletel-~nined ancl plottecl against moisture density on an enlargecl section of the original calil~ration curve in Figure 3 . I t \vas imme- diately apparent t h a t the calibration points fell on a line parallel to the original calibration curve but considel-ably displaced froin it.
Field Trials
In advance of the work in the laboratory an access tube had been placed in t h e field in order t h a t re:ulings could be talcen perioclically during the summer of 1960 for later correlation. T h e access tube was located 20 ft. from the base of an elm tree, near enough to have accelerated moisture changes without running the risk of coming too close to the main roots. W i t h a drill rig to maintain vertical alig~ument a special Jamaicn spiral auger, ground t o
a diameter sliglitlv less than the outside diameter of the access tubes, was used t o bore the hole to n cleptli of 12 ft. The a l u m i n ~ i m access tube, t o which a conical tip hacl bcen welded, was pushed illto t h e hole wit11 the aicl of t h e
B U R N : CALIBRATION O F A N E U T R O N MOISTURE M E T E R
10
2 8 3 0 3 2 34 36 38 40
Moisture Density, Ib per cu f t
M
-
cpm in Medium Activity R a t i o=
--
S cpm in Standard
FIGURE 2. Profiles of activity and ~noisture density for laboratory sa~nples of Leda clay
CANADIAN GBOTECHNiCAL J O U R N A L CALIBRATION IN INERT -FROM F I G I
-
T E S T T R E N C H F I E L D SAMPLES BY AUGERING 2 0 25 3 0 35 4 0 45MOISTURE DENSITY, L B PER CU F T FIGURE 3. Calibration curve for Leda clay
hydraulic feed. Activity ratios were determined for every foot of depth a t intervals of tiine chosen to coincide with certain stages of dryness of the soil. These stages were estimated on the basis of weather records as described by Bozozul; and Burn (1960).
011 each day that neutron moisture ineter readings were made, water content samples were obtained by hand augering fro111 the soil adjacent to the access tube. The holes were a11 bored within a radius of 2.5 ft. of the access tube, but no closer than 1 ft. Measure~uents were made periodically from June to September, when a test trench was dug adjacent to the tube and blocl; samples for density measurements and for moisture content deter~uinations were pro- cured. Three sainples for each were taliei~ from each 6 in. of depth.
Density measllrements. Wet densities of the blocl; sainples were determined by two methods. T h e first, used for inost of the samples, consisted of com- puting the density fro111 weight in air and the volume by displaceinent of oil in a graduated tank. T h e second, used for a few sainples representing the whole profile, especially the more friable and porous near the surface, consisted of computing the density from weights in air and in water after the sample had been coated with a measured amount of wax of known specific gravity.
Results of the two methods agreed fairly well, but those of the second corlsistently gave v a l ~ ~ e s slightly lower than those obtained by the oil dis- placement method. All values a t any one depth agreed within 3 lb./cu. ft., with the exception of two or three a t the bottom of the profile t h a t varied by as much as 5 Ib./cu. ft. The standard deviation was 0.4 Ib./cu. ft. Mean
BURN: CALIBRATION OF A N E U T R O N MOISTURE METER 99
values of these wet densities were used in determining the dry densities for the clay.
The neutron meter actually averages conditions over a small increment of depth. Consequently the profile of dry density was established by taking the average of a value a t any one depth and those from immediately above and below it. The best curve through these points is shown in Figure 4.
Moisture density. i\/Ioisture density profiles were established using the values of dry density, obtained as just described, and the values of moisture content, obtained by oven-drying saillples froin the borings made periodically near the access tube. Again, because the neutron probe "samples" a volume of soil larger than a speciinen procured by hand boring, three successive v:ilues of moisture content were averaged for each depth: the moisture content a t that depth and those from immediately above and below.
12
60
7
0 80 9 0Dry Density, Ib per cu f t FIGURE 4. Dry density versus depth
100 CANADIAN GEOTECHNICAL J O U R N A L
Indiviclual values of iiioist~~re density thus determined for each depth in every profile are plotted against tlie appropriate activity ratio found a t the time of the boring. These relationships are shown as dots in Fig~ire 3 . They are clistributed on both sides of the new curve drawn through the three laboratory points, but most of them fall on the upper side.
Points iiiarked with crosses represent the results of tests on samples taken from the trench in the iininediate vicinity of the access tube and are therefore more reliable than those fro111 the boring operations. General distribution of the points is the same as tliat from the auger borings. Tlie average departure from the new curve is 0.6 Ib.,/cu. ft., which is considered good agreement. The scatter, tliougli appreciable, is probably just the reflection of natural varia- tions in ~ n o i s t ~ i r e content over short liorizontal distances. For example two borings, made 011 the sailie day
33
ft. apart, yielded water content proliles t h a t agreed within 1 per cent to a depth of 7 ft., b u t below this the clifferences increased rapidly to 10 per cent.Tlie general trend between 30 and 35 Ib./cu. ft., which rougllly delineates cleptlis between (i ancl 10 ft., lilay be tlle reflection to a slightly lesser degree
of the process that caused a general shift of this calibration curve for Leda clay to the right of t h a t for inert materials. This over-all shift in position from the original calibration curve t o the new one represents a reductio~i in detected neutron activity of about 11 per cent.
Possible Cur~ses of D~fferences in the Calibration Curves
If it is agreed tliat the initial calibration of the instrument in inert materials is s ~ ~ b s t a n t i a l l y correct, and tliat the instrument is stable with regard t o time as i~~clicatecl by reacli11gs of activity in the wax standard, only two possible explanations for the shift in position of the calibration curve appear t o remai~i. Either moisture c o n t e ~ ~ t s are not deterniinecl correctly by oven drying or there exists in Leda clay some otlier condition tliat reduces the flux of slo\\- neutrons in the vicinity of tlie detector.
Adsorbed water and 01-1 lattice water account for approximately 4 per cent of the dry weight so that the true value of moisture density is a little higher than that calculated fro111 ~lloisture contents based on oven-drying of sanlples a t 105" C. This, however, increases the difference between the two calibration curves; some otlier factor or factors therefore must be involved in this dis- crepancy.
Analyses of tlie pore water from samples of Leda clay indicated the preseiice of salts in varying amounts. Samples of the pore water involved in this cali- bration were subjected to spectrographic examination, which showed that Ca, AlIg, Si, S a were the main constituents of the salts, and t h a t they con- tained small q ~ ~ a n t i t i e s of chlorine. This element has a high capture cross- section for neutrons; further testing therefore was carried out to find tlie concentration of cliloride ions present in the pore water. The r e s ~ ~ l t s showed less than 0.1 gllitre for the two original laboratory samples. Such minute quantities could have very little effect on the n e ~ l t r o ~ i flux, and according to
BURN: CALIBRATION OF A NEUTRON MOISTURE BIETER 101 2 per cent. High salt concentrations of 13 g/litre are not coInnzon in Leda clay, but a t depths greater than 10 ft. they do often exceed the values of these two sa~nples (Crawford, 19G1) and must therefore be taken into con- sideration a t each location where the neutron nzeter is used as a tool t o study changes in water content.
A second possible reason for reduction in neutron flux would he the presence in the clay ~ninerals of some element or elements of high capture cross-section. Mineral analyses show that the particles are primarily feldspars, micas, quartz, and ampl~iholes, with some chlorite, ~ ~ ~ o ~ ~ t ~ ~ ~ o r i l l o n i t e , and vermiculite, which are not always present in detectable amounts. None of thc cl~emical formulae of thesc minerals indicated the presence of elements of very high capture cross-section for neutrons. Both potassi~!m and iron, however, have relatively higher capture cross-sections than other elements present in the soil, and if they occur in sufficiently large quantities they could produce an absorption effect equivalent to s~nall a m o \ ~ n t s of elements which have higll c,~pture cross- sections for slow neutrons.
From analyses of the mineral co~nposition (Brydon and Patry, 1961) and the chemical formulae of these minerals a rough esti~nate was made of the quantity of potassium occurring in Leda clay. It was necessary to rnalte solne broad assumptions, some of which proved later to be incorrect, but on the strength of this estimate sonze prelinlinary experiments to determine the absorption effect of potassiunz in solutions of potassium carbonate were con- ducted. The results showed an appreciable decrease in counting rgte, roughly linear with concentration; a r e d ~ ~ c t i o n of 4 per cent was measured in a solution whose concentration of potassium was equivalent to 2 per cent of the d r y weight of the soil a t a water content of 30 per cent. The estimated proportion of potassium in the clay was
5
per cent, which, if correct, would have caused a reduction in counti~lg rate of about 10 per cent. The results of partial chemical a n a l ~ e s of the samples used in the laboratory and lielcl calibration showed potassium co~zcentrations of only 0.5 to 1.0 per cent of dry weight, and this could not account for the discrepancy between the curves.Further chemical analyses, however, revealed a relatively high percentage of iron-between 6 and 7 per cent of dry \veiglzt. Tl~eoretically the absorption effect of this quantity of iron should be equivalent to the absorption effect of a little less than 5 per cent potassium, in which case it would account for a reduction of counting rate of about 10 per cent. This calculation is based upon the relative occurrence of atoms of the two elements and the relative magnitudes of their capture cross-sections. Iron is a little heavier than potas- sium and, therefore, has fewer atoms for a given weight, but this is largely offset by a slightly larger capture cross-section. When these two factors are considered it requires an extra 25 per cent by weight of iron over potassi~~rn to accomplish the same reduction in counting rate. By coincidence this is the approximate ratio of iron actually present in the soil to the calculated amount of potassium.
The combined absorption effect of slow neutrons, caused by the presence of iron and a small quantity of potassium, would then appear to explain the
102 CANADIAN GEOTECHNICAL JOURNAL
total shift in position of the calibration curve for inert artificial soil media to that for 1-eda clay. This may limit the usefulness of the neutron inethod of measuring moisture densities in Leda clay, but fortunately analyses (Brydon and Patry, 1961) show fairly uiliforin mineral coinposition throughout. It is therefore anticipated that the corrected calibration curve can be widely used in this deposit.
Instrument Stability
Although the instrument appeared to be stable in the laboratory, it was considered desirable to check its perforinance in the field. Accordingly, three sets of profiles were read in one access tube on one day, four on another. The results showed an average variation between inaxiinum and minimum readings to be 0.31 Ib./cu. ft., and the maxirnum variation t o be 1.0 Ib./cu. ft. of water. T h e standard deviation, however, was only 0.18 lb./cu. ft.
Since reporting the initial calibration of the neutron meter, decay of the detector crystal has caused a slow but perceptible change in the counting characteristics of the system, making it necessary to use higher voltages across the photomultiplier tube to maintain the level of counting. This is done by checking the position of the voltage plateau for the wax standard and inaliing the necessary voltage adjustment to operate on the flattest section of the curve. T h e accuracy of activity ratios is not affected, but it does mean that more time is involved in making readings, a~nounting to an extra hour every few days.
1. A substantial difference in counting rate by a neutron moisture meter exists between natural Leda clay and inert soil substitutes a t the same moisture density.
2. A calibration curve established for Leda clay appears to be parallel to that for artificial materials, indicating a uniform absorption of slow neutron flux amounting to 11 per cent.
3. The effect of chlorine salts in the pore water of the clay soils used in this calibration was investigated and the neutron absorption was found to be negligible because of very low concentrations. This factor would be signi- ficant where salt concentrations are higher.
4. T h e absorption effect of potassium on the neutron flux was investigated experimentally and found to cause a significant decrease in counting rate.
5 . Chemical analyses showed t h a t potassiuin is present only in sinall quantities, but t h a t iron is present in quantities regarded as sufficient to account for most of the reduction in the field countin, rate.
6. The general usefulness of the neutron meter as an absolute moisture measuring device appears to be liinited by neutron a l ~ s o r ~ t i o n . Further study of neutron absorption by iron and potassiu~n is needed.
7.
Moisture density of Leda clay a t the site under study can be determined within an accuracy of f 0.5 lb./cu. ft. This may well be extended to otherBURN: CALIBRATION OF A NEUTRON MOISTURE JIETEK 103
areas in this widespread deposit because of the uniform mineralogical com- position of the material.
8. T h e instrument appears to be stable, making it possible to reproduce readings of activity ratio equivalent to moisture densities with a standard deviation of less than 0.2 lb./cu. ft. Even without absolute values of d r y density this would permit the use of the instrument in following inoisture density changes very closely.
The writer wishes to thank R. Ironside, X.R.C., Division of Applied Chemistry, for the chemical analyses used in this report; Dr. Klaus Geiger of the N.R.C., Division of Applied Physics for many helpful discussions; and colleagues a t the Division of Building Research for their continued encouragement in this project; particularly L. Boyd, who spent many hours accumulating the readings upon which this work is based. This report is a coritribu- tion from the Division of Building Research and is published with the approval of the Director of the Division.
B o z o z u ~ , M. and BURN, K. N., 1960. "Vertical Ground Movements Near Elm Trees." Gdo-
lechnipue, 10, 1: 19-32.
BURN, I<. N., 1960. "Design and Calibration of a Neutron Moisture Meter." Presented t o Symposium on Nuclear Methods of Measuring Soil Density a n d Moisture. ASTM S T P 295: 14-26 (NRC 6131).
HOLMES, J. W., 1956. "Calibration and Field Use of the Neutron Scattering Method of Measuring Soil Water Content." Auslralian Journal of Applied Science, 7, 1: 45. CRAWFORD, C. B., 1961. "Engineering Studies of Leda Clay." In R. F. Legget, ed., Soils i n
Canada, Royal Society of Canada Special Publicatio~i no. 3 (Toronto): 200-17. BRYDON, J. E. and PATRY, L. M., 1961. "Mineralogy of Champlain Sea Sediments a n d a