HAL Id: hal-00485416
https://hal.archives-ouvertes.fr/hal-00485416
Submitted on 29 Jun 2020
HAL is a multi-disciplinary open access
archive for the deposit and dissemination of
sci-entific research documents, whether they are
pub-lished or not. The documents may come from
teaching and research institutions in France or
abroad, or from public or private research centers.
L’archive ouverte pluridisciplinaire HAL, est
destinée au dépôt et à la diffusion de documents
scientifiques de niveau recherche, publiés ou non,
émanant des établissements d’enseignement et de
recherche français ou étrangers, des laboratoires
publics ou privés.
sediments from a Mediterranean lagoon: a seasonal
perspective
K. Dedieu, C. Rabouille, Franck Gilbert, K. Soetaert, E. Metzger, C.
Simonucci, D. Jézéquel, F. Prévot, P. Anschutz, S. Hulth, et al.
To cite this version:
K. Dedieu, C. Rabouille, Franck Gilbert, K. Soetaert, E. Metzger, et al.. Coupling of carbon, nitrogen
and oxygen cycles in sediments from a Mediterranean lagoon: a seasonal perspective. Marine Ecology
Progress Series, Inter Research, 2007, 346, pp.45-59. �10.3354/meps07031�. �hal-00485416�
INTRODUCTION
In marine sediments, the biogeochemical cycles of carbon, oxygen and nitrogen are tightly coupled (e.g. Hulthe et al. 1998, Christensen et al. 2003). When the oxygen supply or organic carbon input vary, marked changes occur in the dominant metabolic pathways of the benthic microbial processes and affect the delicate
balance between the various nitrogen processes (e.g. Risgaard-Petersen et al. 1994, Rysgaard et al. 1994). Biogeochemical processes during nitrogen cycling in surface sediments of coastal marine systems include various reactions such as nitrification, denitrification, reoxidation of anaerobic byproducts by nitrate, dissim-ilatory reduction of nitrate (or nitrite) to ammonium (DNRA) and anaerobic ammonium oxidation by nitrite
© Inter-Research 2007 · www.int-res.com *Corresponding author.
Email: christophe.rabouille@lsce.cnrs-gif.fr
Coupling of carbon, nitrogen and oxygen cycles
in sediments from a Mediterranean lagoon:
a seasonal perspective
K. Dedieu
1, C. Rabouille
1,*, F. Gilbert
2, K. Soetaert
3, E. Metzger
4, C. Simonucci
4,
D. Jézéquel
4, F. Prévot
4, P. Anschutz
5, S. Hulth
6, S. Ogier
7, V. Mesnage
7 1Laboratoire des Sciences du Climat et de l’Environnement, UMR CEA-CNRS, domaine du CNRS, av. de la Terrasse,91198 Gif sur Yvette, France
2Laboratoire de Microbiologie, Géochimie et Ecologie Marines (COM), UMR CNRS 6117, Université de la Méditerranée,
Campus de Luminy, 13288 Marseille Cedex 9, France
3Netherlands Institute of Ecology, POB140, 4400 NT Yerseke, The Netherlands
4Equipe de Géochimie des Eaux, Institut de Physique du Globe de Paris, Université Paris 7, 75251 Paris Cedex 05, France 5Université Bordeaux 1, UMR CNRS 5805 EPOC, av. des Facultés, 33405 Talence, France
6Department of Chemistry, Göteborg University, 41296 Göteborg, Sweden 7UMR CNRS 6143 ‘M2C’, Université de Rouen, 76821 Mont-St-Aignan, France
ABSTRACT: Experimental data and simulations were used to investigate the seasonal coupling between carbon, nitrogen and oxygen cycles in marine sediments from a eutrophic shallow lagoon in the Mediterranean Sea area. A negative seasonal correlation was observed between oxygen con-sumption and coupled nitrification–denitrification rates in surface sediments. Elevated values of oxy-gen consumption rates were reached during warm periods (up to 87.7 mmol m–2d–1) whereas
nitrifi-cation and denitrifinitrifi-cation rates remained close to the lowest rates reported for coastal sediments (values around 0.021 to 0.35 mmol N m–2d–1for nitrification and 0.014 to 0.045 mmol N m–2d–1for
denitrification). A steady-state diagenetic model closely represented the seasonal negative correla-tion of oxygen uptake, coupled nitrificacorrela-tion–denitrificacorrela-tion rates, the vertical distribucorrela-tion patterns of pore water oxygen and the solid phase distribution of organic carbon when nitrification inhibition by sulfide was included. Simulation adjusted to field data also highlighted the importance of oxygen penetration depth in the seasonal variation of nitrification. The modelling indicated that anaerobic metabolism was the most significant pathway (65 to 80%) during organic matter mineralization with a clear seasonal increase during warm periods. These warm periods were also characterized by the higher benthic demand of oxygen mostly used to re-oxidize the by-products from anaerobic reactions (from 57 to 82%), the other part being used for carbon mineralization.
KEY WORDS: Nitrogen dynamics · Carbon · Oxygen · Coastal sediment · Diagenesis modelization
to dinitrogen gas (anammox) (e.g. Blackburn & Sørensen 1988, Kuypers et al. 2003, Dalsgaard et al. 2005). Nitrification, the bacterially mediated oxidation of ammonium and nitrite to nitrate by oxygen, is the main source of nitrate in marine environments. Several studies have pointed out the occurrence of anaerobic production of nitrate by manganese oxides (Luther et al. 1997, Hulth et al. 1999, Anschutz et al. 2000, Hyacinthe et al. 2001). Sediment denitrification can occur just below the oxic–anoxic interface when oxy-gen is depleted by oxic mineralization (e.g. Froelich et al. 1979, Jensen et al. 1993) or in anoxic microenviron-ments within the oxic surface layer (Brandes & Devol 1995). Denitrification is a key process in the sediment nitrogen cycle since it constitutes an important sink for nitrogen in organic rich sediments (e.g. Christensen et al. 1987, Devol 1991), although at least locally anam-mox may be as important (Dalsgaard et al. 2003). This nitrogen loss from the system can counteract the eutrophication process often occurring in shallow benthic environments (Eyre & Ferguson 2002). Major factors regulating nitrification and denitrification are usually the availability of oxidants (oxygen, nitrite/ nitrate) and the supply of reductants such as organic material for heterotrophic denitrification or ammonium (e.g. Henriksen & Kemp 1988, Lohse et al. 1993) as well as inhibiting metabolites such as hydrogen sulfide (Joye & Hollibaugh 1995). The stimulation of nitrifica-tion and inhibinitrifica-tion of denitrificanitrifica-tion by oxygen lead to a complex regulatory pattern for the coupled process of nitrification–denitrification (Kemp & Dodds 2002). Although carbon, nitrogen and oxygen cycles are tightly coupled and strongly dependent on seasonal variations, few studies have investigated the regula-tory factors in the context of temporal and spatial variability.
To elucidate the interplay between processes regu-lating nitrification and denitrification and their tempo-ral and spatial variations, we explored the biogeo-chemical cycling of C, O2and N in a shallow lagoon of
contrasted benthic environments and marked seasons. The Thau Lagoon in southern France is characterized by shellfish farming and a responsive drainage basin. In this lagoon, the changes in environmental condi-tions associated with shellfish farming and runoff from land strongly influence the nitrogen cycle at the sedi-ment –water interface (Gilbert et al. 1997). The sea-sonal and spatial variations of sedimentary oxygen dis-tributions appeared strongly related to the carbon input and temperature variations (Dedieu et al. 2007).
Using a combination of field and laboratory mea-surements with modelling, this temporal and spatial coupling was first investigated over different seasons at 2 stations (1 outside and 1 inside the shellfish farm-ing area) and then explained through the identification
of the various factors controlling nitrogen, carbon and oxygen dynamics. The relative importance of the main reaction pathways during organic matter mineraliza-tion was also investigated through the quantificamineraliza-tion of nitrification-denitrification rates and oxic-anoxic min-eralization rates.
MATERIALS AND METHODS
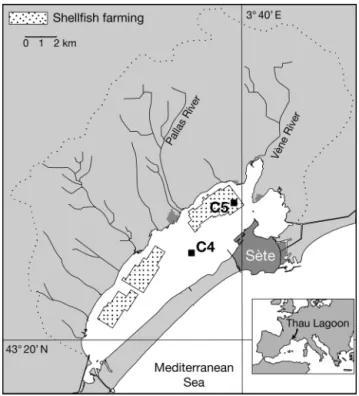
Study sites. The study was carried out during 5 cruises (December 2001, April and August 2002, Janu-ary and May 2003) in the Thau Lagoon, a shallow lagoon of 75 km2located in southeastern France near
Montpellier (Fig. 1). Average depth of the lagoon is 4 m (locally up to 10 m). This lagoon is connected to the sea through the narrow channels of Sète and receives freshwater mostly from the Vène and Pallas rivers, which represent 43% of the total watershed (280 km2).
Typical characteristics of the lagoon are related to shellfish farming activity. Activities associated with shellfish cultivation cover about 20% of the total lagoon area and produce about 35 000 t of shellfish yearly (Hamon & Tournier 1981). This study was car-ried out in 2 different sampling stations, one outside (Stn C4: 43° 24.029’ N, 3° 36.701’ E; ca. 8 m depth) and the other inside the shellfish park, more precisely in corridors located a few meters from mussel tables (Stn C5: 43° 25.990’ N, 3° 39.656’ E; ca. 8 m depth). Shellfish hang on ropes from a support table to a depth
Fig. 1. Thau Lagoon: sampling sites and 2 stations; Stn C4 outside and Stn C5 inside the shellfish farming area
of up to 1 m from the sediment floor. The shellfish farmers’ work consists of the weekly maintenance of the production by boat. In such conditions, sediment disturbance is insignificant at Stn C5 where water col-umn depth is high.
The sedimentary features observed on X-ray images, the grain size curve and porosity measure-ments roughly show the same lithological facies at both stations: a gray, silty, clay sediment with shells and shell debris, a mean grain size between 10 and 20 μm (Schmidt et al. 2007) and a mean (± SD) surface porosity of 0.90 ± 0.05 (Dedieu et al. 2007). Neverthe-less the density variation of gray levels observed on X-ray images is quite different along the cores. In the first 10 cm of Stn C4, shells are more abundant in homogeneous clay sediment. At Stn C5, sediments are made up of silty clay with small bivalve shells and have light gray levels near the interface, indicating a very fresh sedimentary deposit (Schmidt et al. 2007). This is in accordance with measurements of the Hydrogen Index (which gives a rough estimate of the organic matter quality) that revealed a more biodegradable material at this station compared with that at Stn C4 (Mesnage et al. 2007). Bioturbation rates derived from both 234Th and 7Be radionuclide profiles range between 1 and 10 cm2 yr–1 at Stn C4
and 1 and 31 cm2 yr–1 at Stn C5 with highest values
observed during the warmer periods. This latter sta-tion presents a higher seasonal variability, which is probably related to its position near oyster farms. Analyses of macrobenthos (organism density, total biomass, dominant species) and sediment reworking indicated roughly similar organism density and total biomass despite a different macrobenthos community and higher and deeper benthic mixing intensities at Stn C5 (210Pb cross-sectional profiles exhibit a
well-pronounced mixed layer of 10 cm depth at Stn C5) (Duport et al. 2007, Schmidt et al. 2007). Both stations consisted of a classical mixture of muddy sand in shel-tered areas and fine sand assemblages. At Stn C4, however, species characteristically associated with fine sand were dominant while Stn C5 was dominated by species characteristic of the muddy sand in shel-tered areas. The presence of Capitella capitata at Stn
C5 indicated a high level of organic material, proba-bly in relation to the proximity of shellfish tables.
Porewater and solid phase. In situ measurements of
vertical oxygen microprofiles were acquired using a microprofiler (Unisense®) mounted on a tripodal frame and positioned by divers on the sea floor with mini-mum sediment disturbance (Dedieu et al. 2007). A minimum time period of 30 min was allowed to pass before starting the measurement program. After this waiting period the cylinder was lowered step-wise by a pre-programmed motorized system. Dissolved oxygen
concentration was measured by polarographic oxygen microelectrodes provided with a built-in reference and an internal guard cathode (Revsbech 1989). The oxy-gen microsensor tip had an outer diameter of 100 μm, a stirring sensitivity below 1%, a 90% response time below 10 s and a current drift of less than 2% h–1.
The diffusive oxygen uptake (Jdiff) of the sediments
was estimated from oxygen microdistributions at the sediment –water interface using Fick’s First Law of diffusion:
where φ is the sediment porosity, Ds the molecular dif-fusivity of oxygen in sediment (cm2s–1), z the depth in
sediment (cm). The inverse of the formation resistivity factor (F–1), measured at each depth (Dedieu et al.
2007), can be scaled to porosity using the empirical Archie relation: F–1 = φm, where m is determined
experimentally depending on sediment type (Ullman & Aller 1982). For coastal muddy sediments where poros-ity ≥ 0.7, the value used for m is estimated to be 2.5 to 3. Following this relation, we find that Ds = Doφm–1and
φ Ds = Do φm= Do F–1, where Do is the molecular
diffu-sivity of oxygen in water at in situ temperature
(cm2 s–1). Validity of the calculations was checked
using the PROFILE software (Berg et al. 1998) to calcu-late diffusive oxygen fluxes (Dedieu et al. 2007). A fair consistency between Jdiffcalculated from the interface
method and those provided by the PROFILE software appeared, with differences lower than 10% in most instances. In marine sediments, total oxygen uptake represents the oxygen balance between production and respiration through processes such as diffusive and advective exchanges and fauna-mediated oxygen uptake. A preceding study on the oxygen dynamics compared total oxygen uptake with diffusive oxygen fluxes during April 2002 and May 2003 to evaluate the importance of advective processes and bioturbation in this studied system (Dedieu et al. 2007). At Stn C4, results showed that total oxygen uptake measured in a transparent benthic chamber was 3 times greater than diffusive oxygen fluxes in April 2002, which indicates that about two-thirds of oxygen uptake was fauna-mediated, whereas total oxygen uptake was statisti-cally equivalent to diffusive oxygen fluxes in May 2003. At Stn C5, average total oxygen uptake was sim-ilar to diffusive O2fluxes in April 2002 and May 2003,
indicating that the governing oxygen transport is mainly diffusive. Except at Stn C4 during April 2002, this indicates an acceptable estimation of total oxygen uptake through the determination of diffusive oxygen uptake. Because we do not have temporal variation of total oxygen uptake, we cannot extend this conclusion to the other seasons.
J Ds z z diff 2 dO d = ⋅ ⋅ ⎡⎣⎢ ⎤⎦⎥ = –φ 0
Separation of the porewaters from the sediment was performed by equilibration probes (peepers) (Hesslein 1976) or by centrifugation of sectioned sediment cores. Nitrate plus nitrite and ammonium contents were determined in both stations using the Merk Spectro-quant® 14752 according the method of Anderson (1979) and by flow injection analysis (FIA) according the method of Hall & Aller (1992). Only 2 nitrate plus nitrite profiles were acquired at both stations during December 2001 (data not shown) and measurements showed very low concentrations in the pore waters at all depths (≤1 μmol l–1).
During each cruise, sediments for microbial activity measurements were collected at both stations (3 sam-ples per station) by scuba diving using PVC cores (10 cm inside diameter, 30 cm height). Nitrification and denitrification rates in the sediment were assessed with the acetylene-blockage method that used various partial pressures of acetylene to selec-tively inhibit nitrification or denitrification (Klemedts-son et al. 1988).
To measure nitrification rates, the upper 2 cm of each sediment was divided into 3 sets of triplicate 0.7 ml samples and transferred into 10 ml tubes with 2 ml of seawater from each corresponding station. Seawater was then supplemented with chloramphenicol (final concentration, 1 g l–1) to prevent bacterial growth
dur-ing incubation. The tubes were sealed with rubber stoppers. In half of the tubes, acetylene was injected to 10 Pa final concentration to specifically inhibit the first step of nitrification (NH4+ oxidation) (Klemedtsson et
al. 1990). Then all of the tubes were vortexed. Samples were incubated in the dark at the experimental tem-perature for 0, 1, 3, 5 and 8 h. After incubation, each tube was treated with 0.1 ml of 1 M HgCl2solution.
The nitrification rate was measured as the difference of NO3–production in both the absence and presence of
acetylene.
To measure denitrification rates, subsamples (0.7 ml) from each upper 2 cm of sediment were transferred into 5 ml tubes with 2 ml of seawater from each corre-sponding station. Seawater was then supplemented with chloramphenicol (final concentration, 1 g l–1) to
prevent bacterial growth during incubation. The tubes were sealed with rubber stoppers and anaerobic con-ditions were obtained by flushing N2through the tube
for 2 min. Acetylene, which selectively inhibits the reduction of N2O to N2, was injected in the gas phase
(final concentration, 15 kPa) and the tubes were vor-texed. Samples were incubated in the dark at the
in situ temperature for 0, 1, 3, 5 and 8 h. Before
analy-sis, each tube was treated with 0.1 ml of 1 mol l–1HgCl 2
solution. Denitrifying activity was considered as the linear initial rate of N2O accumulation in the gas phase
during incubations.
Nitrous oxide (N2O) in the tubes was determined by
gas chromatography (HP5890, Series II) with an elec-tron capture detector and an automatic injector (Dani HSS 86.50; oven at 50°C; manifold, 50°C; injection tube, 150°C. Chromatographic operating conditions: oven 50°C; injector, 150°C; detector, 260°C). Nitrogen was used as carrier gas at a flow rate of 20 ml min–1.
Porewater nitrate was reduced on a Cu–Cd column adapted to Technicon II according to Treguer & Le Corre (1975). Nitrite concentrations were determined colorimetrically by the method of Bendschneider & Robinson (1972).
Total organic carbon (TOC) content (% by weight) of the investigated sediments was measured with Rock-Eval pyrolsis (Espitalié et al. 1985) and a RE6 device (Vinci Technologies). The analyses were carried out on 100 mg of dried and homogenized samples with a tem-perature program starting from 300°C for 20 min and increasing up to 600°C at 25°C min–1under a N
2flow,
followed by oxidation at 600°C for 7 min under an oxy-gen flow. TOC was only measured during an interme-diate cruise of April 2002 at both stations.
Diagenetic modelling. A steady state version of a numerical coupled diagenetic model, OMEXDIA (Soetaert et al. 1996), has been applied to the mea-sured profiles of oxygen, ammonium and TOC to esti-mate the seasonal variation of C and N cycling, the rates of total carbon oxidation and the relative contri-bution of the majors pathways linked to organic matter mineralization as a function of station and season.
Description of model: OMEXDIA is a numerical
non-linear coupled model based on the 1-dimensional diage-netic equations as presented by Berner (1980) and Boudreau (1997). Solutes are transported by molecular diffusion, whereas the solid phase is transported by advection, compaction and bioturbation. By describing aerobic carbon mineralization, nitrification and denitri-fication and combining anaerobic mineralization processes, the model generates profiles of oxygen, nitrate, ammonium, Oxygen Demand Units (ODU; i.e. the amount of oxygen necessary to reoxidize reduced counterparts from anaerobic mineralization) and carbon.
Solid phase organic carbon is modelled as 2 degrad-able fractions characterized by different first order degradation rates (labile and more refractory) and C:N ratios to account for decreasing organic matter reactiv-ity with sediment depth. Mineralization rates are mainly limited both by carbon (first order kinetics) and oxidant availability (Michaelis-Menten type kinetics). Nitrification of ammonium was described separately, which allowed a dynamic coupling of nitrification with anoxic mineralization.
Microbial processes: The idealized model reactions
considered to influence the distribution of porewater solutes were (Soetaert et al. 1996):
Oxic respiration: (CH2O)x(NH3)y(H3PO4) + xO2→ xCO2+ yNH3+ H3PO4+ xH2O, Nitrification: NH3+ 2O2→ HNO3+ H2O, Denitrification: (CH2O)x(NH3)y(H3PO4) + 0.8xHNO3→ xCO2+ yNH3+ 0.4xN2+ H3PO4+ 1.4xH2O, Anoxic respiration: (CH2O)x(NH3)y(H3PO4) +
an oxidant → xCO2+ yNH3+ H3PO4+ xODU + xH2O,
Reoxidation of reduced compounds by oxygen: ODU + O2→ an oxidant,
where the stoichiometry of the organic matter is repre-sented by the coefficients x (molar C:P ratio) and y
(molar N:P ratio) and ODU. As described in Soetaert et al. (1996), we assigned to ODU the diffusion coefficient of hydrogen sulfide (HS–) as it is the byproduct of sulfate reduction, the most prominent anoxic mineral-ization process in coastal marine sediments. This is particularly adapted to the benthic environment being studied where sulfate reduction is the dominant anoxic process compared to manganese or iron oxide reduc-tion (Metzger et al. 2007).
As suggested by Joye & Hollibaugh (1995) the pres-ence of sulfide may inhibit nitrification and, conse-quently, coupled denitrification. A possible control of the nitrogen cycle by sulfide in the sediments close to the shellfish zone was then tested with the diagenetic model by adding a coefficient of sulfur inhibition (ODU Inhibition Factor) in the initial nitrification equation that becomes (Eq. 1):
(1) where KinNit
ODUis the half-saturation constant for
nitri-fication inhibition by ODU (μmolO2 l–1), OxicMin1 is
the amount of labile carbon oxidized by oxygen and
OxicMin2is the amount of refractory carbon oxidized
by oxygen.
Model calibration: To calibrate the model, in situ
oxygen, nitrate, ammonium, TOC and ODU concentra-tions with depth in the sediment were reproduced and the goodness of fit was evaluated by visually compar-ing the profiles obtained from the models with those that were measured. Goodness of fit was also evalu-ated with the model cost function which quantifies the discrepancy between observed data and modelled val-ues. The lower the cost function was, the better the model described the data. Model calculations were performed using parameters measured in the field such as sedimentation rates, macrofaunal reworking activities (bioturbation), porosity profiles, bottom water
temperature and ion concentrations in bottom and intersitial waters (O2, NO3–, NH4+, H2S, SO42 –, Mn2+,
Fe2+). Biogeochemical parameters such as Q
10and NH4
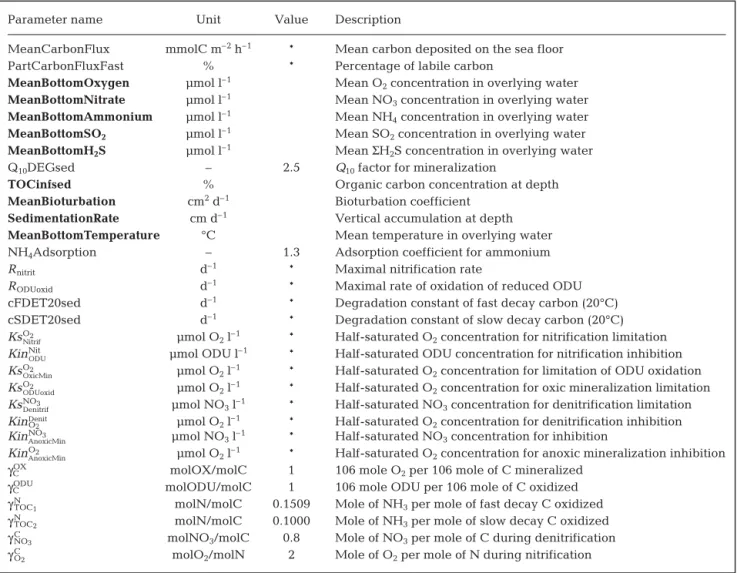
adsorption were obtained from literature, whereas the mean carbon flux, proportion of labile and refractory carbon, and the limitation and inhibition constants were adjusted to match both the observed concentra-tion profiles of O2, organic C, NO3–and NH4+and the
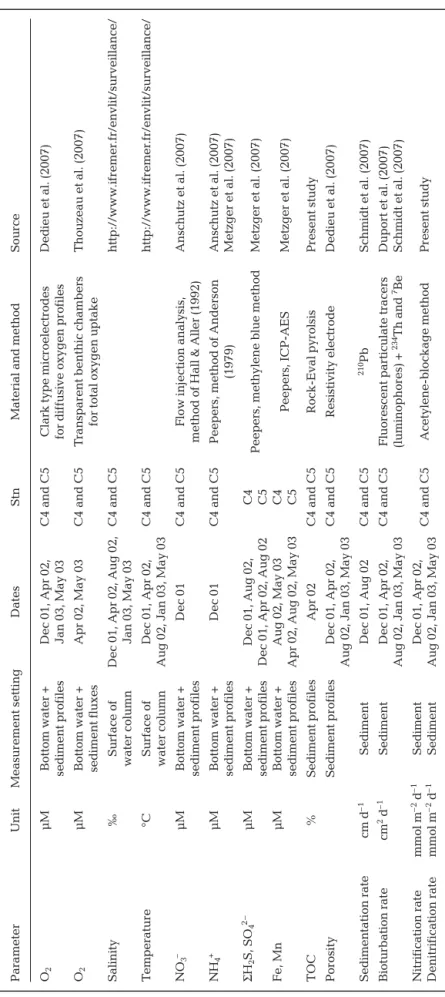
measured rates of oxygen uptake, nitrification and denitrification. The list and sources of all fixed parame-ters used in the model from field measurements are presented in Table 1. Those from literature and those obtained by calibration are presented in Table 2.
The bottom water nitrate concentration was arbitrar-ily fixed at 1 μmol l–1 according to the nitrate plus
nitrite profiles acquired during the December cruise at both stations. Finally, our calibration exercise aimed at providing the best fits to concentration versus depth profiles. The relative contribution of the different path-ways during organic matter degradation was deter-mined from these simulation results.
RESULTS
In situ temperature and bottom water oxygenation
The bottom water temperature followed a seasonal pattern and varied from 9.6°C in December 2001 to 23°C in August 2002, dropping to a minimum of 8.5°C in January 2003. Mean (± SD) oxygen concentration in the bottom water varied from 160 ± 8 to 320 ± 16 μmol l–1at Stn C4 and from 194 ± 8 to 315 ± 8 μmol l–1
at Stn C5 (Dedieu et al. 2007). Overall, the values mea-sured during the cold periods corresponded to 100% saturation, whereas values measured during warm pe-riods (August 2002 and May 2003) varied from 100% to 68% (May 2003 at Stn C4). Significant variability of measured oxygen concentration values in August 2002 and May 2003 indicate short-term variations of oxygen concentration in bottom waters, linked to stratification and vertical mixing of the water column. Except in May 2003, bottom water oxygenation was similar outside and inside the shellfish culture areas.
Porewater and solid phase distributions
A total of 85 oxygen profiles were measured at both stations during the 5 investigative cruises (Dedieu et al. 2007). The decrease of oxygen concentration with depth and the absence of oxygen over-saturation at the sediment interface indicate the dominance of benthic respiration overall. A microphytobenthos community could be present in such a shallow lagoon. However, in
ODU Inhibitor Factor ODU ODU NH ODUNit 3o = − + 1 Kin x xid nitrit 3 2 2 Nitrif O NH O O 2 = × × + ⎡ ⎣⎢R Ks + OxicMin11 2 1 × + ×
(
)
× −( )⎤⎦ × γTOCN 1 γTOCN 2 ODU In OxicMin Φ Φ h hibitor Factorthe Thau Lagoon, which was very turbid throughout the periods investigated, little microbenthos was found and no benthic oxygen production was measured at the sediment –water interface. Indeed, results from the LI-COR quantum sensor (LI-192SA), deployed inside clear chambers to record the amount of photosyntheti-cally active radiation (PAR, 400–700 nm) available for the enclosed photosynthetic organisms, revealed extremely low irradi-ance values at both stations (< 42 μmol quanta m–2s–1) (Thouzeau et al. 2007). By
comparison, irradiance measurements in a shallower site of benthic macroalgal photosynthesis, located on the northern fringe of the shellfish farming area (2.6 m deep), were 333 and 591 μmol quanta m–2
s–1in April 2002 and May 2003,
respec-tively. According to these low measured values of photosynthetically active radia-tion, microbenthos production was prob-ably inhibited by water turbidity rather than frame shading. Therefore, the diur-nal patterns in the oxygen profiles may not constitute a significant factor of het-erogeneity. Note that the investigated sediments at Stn C5 located in corridors a few m from mussel tables were not shaded by the farming setup.
Across all profiles, oxygen penetration depths ranged from 0.4 to 5.6 mm with an annual average of 2.9 and 1.2 mm at Stns C4 and C5, respectively. The shal-lowest oxygen penetration depth was measured during the warm periods of August 2002 and May 2003 at both sta-tions. This seasonal variation correlated well with the temperature increase and the bottom water oxygen decrease, which corresponded to a narrowing of the oxic zone. At the dm scale (corre-sponding to the distance between elec-trodes) oxygen microprofiles from each deployment showed a spatial hetero-geneity illustrated by different oxygen gradients and penetration depths. The presence of an oxygen peak at depth in the December 2001 Stn C4 profile cer-tainly indicates the presence of biologi-cal structures, and the irregular shape of some oxygen profiles, especially at Stn C5 in May 2003, may be associated with the higher sediment reworking activity during the warm periods.
Parameter Unit Measur ement setting Dates Stn M
aterial and method
Sour ce O2 μM Bottom water + Dec 01, Apr 02, C4 and C5
Clark type micr
oelectr odes Dedieu et al. (2007) sediment pr ofiles Jan 03, May 03 for dif fusive oxygen pr ofiles O2 μM Bottom water + Apr 02, May 03 C4 and C5 T ranspar
ent benthic chambers
Thouzeau et al. (2007)
sediment fluxes
for total oxygen uptake
Salinity
‰
Sur
face of
Dec 01, Apr 02, Aug 02,
C4 and C5 http://www .ifr emer .fr/envlit/sur veillance/ water column Jan 03, May 03 T emperatur e °C Sur face of Dec 01, Apr 02, C4 and C5 http://www .ifr emer .fr/envlit/sur veillance/ water column
Aug 02, Jan 03, May 03
NO 3 – μM Bottom water + Dec 01 C4 and C5
Flow injection analysis,
Anschutz et al. (2007)
sediment pr
ofiles
method of Hall & Aller (1992)
NH 4 + μM Bottom water + Dec 01 C4 and C5
Peepers, method of Anderson
Anschutz et al. (2007) sediment pr ofiles (1979) Metzger et al. (2007) Σ H2 S, SO 4 2– μM Bottom water + D ec 01, Aug 02, C4
Peepers, methylene blue method
Metzger et al. (2007)
sediment pr
ofiles
Dec 01, Apr 02, Aug 02
C5 Fe, Mn μM Bottom water + A ug 02, May 03 C4 Peepers, ICP-AES Metzger et al. (2007) sediment pr ofiles
Apr 02, Aug 02, May 03
C5 TOC % Sediment pr ofiles Apr 02 C4 and C5 Rock-Eval pyr olsis P resent study Por osity Sediment pr ofiles Dec 01, Apr 02, C4 and C5 Resistivity electr ode Dedieu et al. (2007)
Aug 02, Jan 03, May 03
Sedimentation rate cm d –1 Sediment Dec 01, Aug 02 C4 and C5 210 Pb Schmidt et al. (2007) Bioturbation rate cm 2d –1 Sediment Dec 01, Apr 02, C4 and C5 Fluor escent par ticulate tracers Dupor t et al. (2007)
Aug 02, Jan 03, May 03
(luminophor es) + 234 Th and 7Be Schmidt et al. (2007) Nitrification rate mmol m –2 d –1 Sediment Dec 01, Apr 02, C4 and C5 Acetylene-blockage method Pr esent study Denitrification rate mmol m –2 d –1 Sediment
Aug 02, Jan 03, May 03
T
able 1.
Main model state variables measur
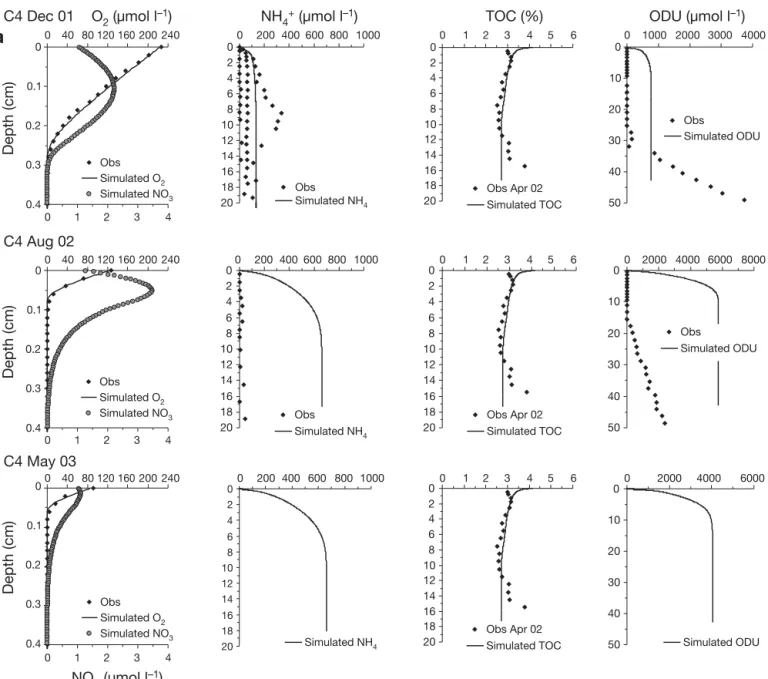
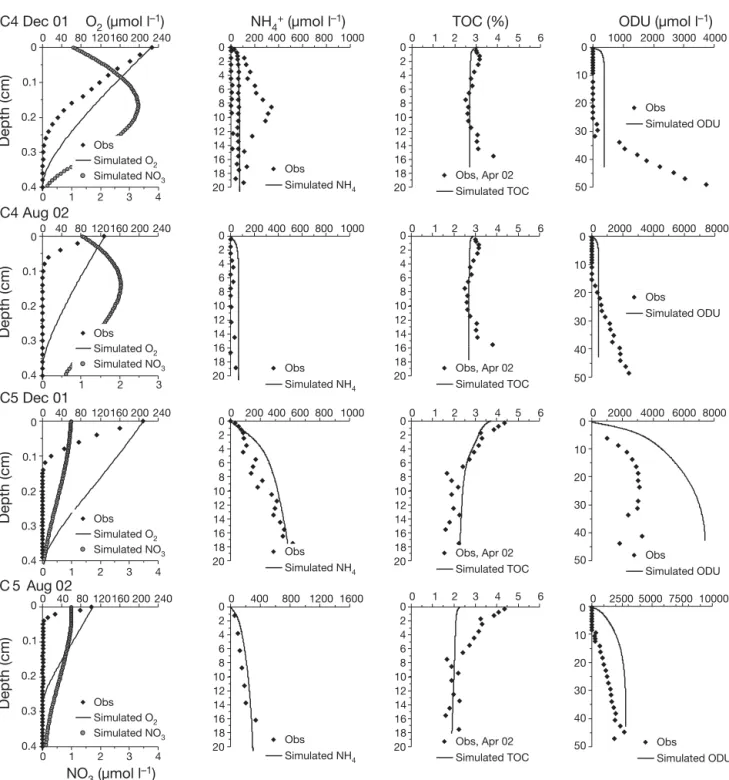
Ammonium profiles showed strong spatial hetero-geneity between seasons and stations, with higher content evident in December 2001 and at Stn C5 inside the shellfish area (Fig. 2a,b). At Stn C5, concentrations increased just below the sediment –water interface to reach approximately 600 μmol l–1 at the 20 cm depth.
At Stn C4, outside the shellfish area, profiles show a large seasonal variation with ammonium present just below the sediment –water interface in December 2001, whereas it remained below 30 to 40 μmol l–1in
the first 20 cm in August 2002. In May 2003, no ammo-nium profiles were obtained. In the overlying water, concentrations always remained below the analytical limit of detection (i.e. approximately 1 μmol l–1).
The 2 available TOC profiles measured in April 2002 were used for all model calculations (Fig. 2a,b). At Stn C5, TOC content in the solid phase of the sediment decreased sharply from 4.4% at the top of the core to
3.3% at 1.75 cm depth and 1.7% at 7.5 cm. Below 7.5 cm, TOC content remained constant. At Stn C4, TOC content increased slightly from 3% at the top of the core to 3.2% at 1.75 cm depth, decreasing there-after to 2.6% at 7.5 cm. Below this depth, TOC content remained constant down to 10.5 cm depth.
ODU profiles were calculated by multiplying ΣH2S
concentration by 2 as each sulfide requires 2 O2 to
reoxidize and thus, 2 ODUs. Fe2+ and Mn2+ were
neglected as they represent less than 10% of ΣH2S
concentration and represent half an ODU for Mn2+and
quarter of an ODU for Fe2+due to stoechiometric
reac-tions (Soetaert et al. 1996). The ODU profiles, obtained from porewater sulfide content in December 2001 and August 2002 (Metzger et al. 2007), showed differences between the stations and a marked temporal variation. At Stn C4, ODU appeared at a depth of 30 cm in December 2001 and at a much shallower depth in
Parameter name Unit Value Description
MeanCarbonFlux mmolC m–2h–1 * Mean carbon deposited on the sea floor
PartCarbonFluxFast % * Percentage of labile carbon
MeanBottomOxygen μmol l–1 Mean O
2concentration in overlying water
MeanBottomNitrate μmol l–1 Mean NO
3concentration in overlying water
MeanBottomAmmonium μmol l–1 Mean NH
4concentration in overlying water
MeanBottomSO2 μmol l–1 Mean SO2concentration in overlying water
MeanBottomH2S μmol l–1 Mean ΣH2S concentration in overlying water
Q10DEGsed – 2.5 Q10factor for mineralization
TOCinfsed % Organic carbon concentration at depth
MeanBioturbation cm2d–1 Bioturbation coefficient
SedimentationRate cm d–1 Vertical accumulation at depth
MeanBottomTemperature °C Mean temperature in overlying water
NH4Adsorption – 1.3 Adsorption coefficient for ammonium
Rnitrit d–1 * Maximal nitrification rate
RODUoxid d–1 * Maximal rate of oxidation of reduced ODU
cFDET20sed d–1 * Degradation constant of fast decay carbon (20°C)
cSDET20sed d–1 * Degradation constant of slow decay carbon (20°C)
KsO2
Nitrif μmol O2l–1 * Half-saturated O2concentration for nitrification limitation
KinNit
ODU μmol ODU l
–1 * Half-saturated ODU concentration for nitrification inhibition
KsO2
OxicMin μmol O2l–1 * Half-saturated O2concentration for limitation of ODU oxidation
KsO2
ODUoxid μmol O2l–1 * Half-saturated O2concentration for oxic mineralization limitation
KsNO3
Denitrif μmol NO3l–1 * Half-saturated NO3concentration for denitrification limitation
KinO2
Denit μmol O
2l–1 * Half-saturated O2concentration for denitrification inhibition
KinNO3
AnoxicMin μmol NO3l–1 * Half-saturated NO3concentration for inhibition
KinO2
AnoxicMin μmol O2l–1 * Half-saturated O2concentration for anoxic mineralization inhibition
γCOX molOX/molC 1 106 mole O2per 106 mole of C mineralized
γCODU molODU/molC 1 106 mole ODU per 106 mole of C oxidized
γN
TOC1 molN/molC 0.1509 Mole of NH3per mole of fast decay C oxidized
γN
TOC2 molN/molC 0.1000 Mole of NH3per mole of slow decay C oxidized
γC
NO3 molNO3/molC 0.8 Mole of NO3per mole of C during denitrification
γC
O2 molO2/molN 2 Mole of O2per mole of N during nitrification
Table 2. Model parameters (see Soetaert et al. 1996). *: obtained by calibration; bold: fixed through known in situ conditions at both stations (others obtained from literature). Oxygen Demand Units (ODU) correspond to reduced byproducts reoxidized by O2when
August 2002, whereas at Stn C5 sulfides were observed at a depth less than 10 cm.
Nitrification, denitrification and oxygen uptake rates
Mean (± SD) annual nitrification rates were 0.35 ± 0.05 and 0.021 ± 0.004 mmol N m–2d–1at Stns C4 and C5,
respectively, and mean annual denitrification rates were 0.045 ± 0.007 and 0.014 ± 0.004 mmol N m–2d–1,
respec-tively (Fig. 3). Nitrification and denitrification rates were close to the lowest reported for most coastal marine and estuarine sediments (ca. 0.3 to 17.2 mmol N m–2d–1for
nitrification and ca. 0.02 to 30.2 mmol N m–2 d–1 for
denitrification) (e.g. Rysgaard et al. 1996, Usui et al. 2001, Christensen et al. 2003). A large gradient of nitrifi-cation and denitrifinitrifi-cation activity appeared at the lagoon scale with significantly higher nitrification and denitri-fication rates occurring outside (Stn C4) than inside (Stn C5) the farming zone. Outside the shellfish area, nitrification rates decreased from December 2001 to Au-gust 2002. In January 2003, nitrification reached its high-est rate (0.60 ± 0.05 mmol N m–2d–1). The seasonal
vari-ation of denitrificvari-ation followed a similar pattern with higher values during the cold periods (December 2001, April 2002 and January 2003). At the station inside the
0 2 4 6 8 10 12 14 16 18 20 0 200 400 600 800 1000 Obs Simulated NH4 0 2 4 6 8 10 12 14 16 18 20 0 1 2 3 4 5 6 TOC (%) 0 10 20 30 40 50 0 1000 2000 3000 4000 ODU (µmol l–1) C4 May 03 0 2 4 6 8 10 12 14 16 18 20 0 2 4 6 8 10 12 14 16 18 20 0 10 20 30 40 50 C4 Dec 01 0
a
0.1 0.2 0.3 0.4 0 40 80 120 160 200 240 0 200 400 600 800 1000 0 1 2 3 4 5 6 0 2000 4000 6000 8000 0 40 80 120 160 200 240 0 200 400 600 800 1000 0 1 2 3 4 5 6 0 2000 4000 6000 Depth (cm) 0 0.1 0.2 0.3 0.4 Depth (cm) 0 1 2 3 4 0 1 2 3 4 C4 Aug 02 0 2 4 6 8 10 12 14 16 18 20 0 2 4 6 8 10 12 14 16 18 20 0 10 20 30 40 50 NO3 (µmol l–1) Obs Simulated ODU Simulated TOC Obs Apr 02 Simulated TOC Obs Apr 02 Simulated ODU Obs Simulated NH4 Obs Obs Simulated O2 Simulated NO3 Obs Simulated O2 Simulated NO3Simulated NH4 Simulated TOC
Obs Apr 02 Simulated ODU 0 40 80 120 160 200 240 0 0.1 0.2 0.3 0.4 Depth (cm) 0 1 2 3 4 Obs Simulated O2 Simulated NO3 NH4+ (µmol l–1) O2 (µmol l–1)
Fig. 2. (Above and facing page). In situ (f) and modeled ( ) oxygen, ammonium, TOC, ODU and ( ) simulated nitrate profiles at (a) Stn C4 and (b) Stn C5 during December 2001, August 2002 and May 2003. TOC profile measured during an intermediate
farming zone, a similar seasonal variation was evident with the highest nitrification and denitrification rates measured in December 2001 and January 2003.
A seasonal oxygen pattern emerged with maximum values of diffusive oxygen uptake through the sedi-ment –water interface occurring in August 2002 and May 2003 at both stations, whereas the lowest oxygen uptake rates occurred during the cold periods (Fig. 3). Mean (± SD) values varied from 8.6 ± 2.1 (January 2003) to 30.7 ± 8.3 (May 2003) mmol m–2d–1at Stn C4
and from 36.8 ± 18.5 (December 2001) to 87.7 ± 40.8 (May 2003) mmol m–2d–1at Stn C5. A biogeochemical
gradient at the lagoon scale then appeared between
the 2 stations, with diffusive oxygen uptake rates ca. 2 to 3 times higher at Stn C5, located under the shellfish parks and subjected to larger biodeposition, than at Stn C4 outside the shellfish farming area. Deposition of higher organic matter (OM) quality and quantity at Stn C5 would explain the larger oxygen demand and aero-bic respiration rates compared with that at Stn C4 (Dedieu et al. 2007). At a smaller scale, oxygen flux scatter at Stn C5 appeared significant especially dur-ing warm periods; a flux scatter factor of 6.6 in May 2003 and 4 in August 2002 was found between the minimum and maximum values of those months. This spatial heterogeneity could be linked to small scale
C5 Dec 01 C5 Aug 02 C5 May 03 0 40 80 120 160 200 240 0
b
0.1 0.2 0.3 0.4 Depth (cm) 0 1 2 3 4 0 40 80 120 160 200 240 0 0.1 0.2 0.3 0.4 Depth (cm) 0 1 2 3 4 0 40 80 120 160 200 240 0 0.1 0.2 0.3 0.4 Depth (cm) 0 1 2 3 4 Obs Simulated O2 Simulated NO3 Obs Simulated O2 Simulated NO3 Obs Simulated O2 Simulated NO3 NO3 (µmol l–1) 0 2 4 6 8 10 12 14 16 18 20 0 2 4 6 8 10 12 14 16 18 20 0 400 800 1200 1600 0 2 4 6 8 10 12 14 16 18 20 0 2 4 6 8 10 12 14 16 18 20 0 2 4 6 8 10 12 14 16 18 20 0 2 4 6 8 10 12 14 16 18 20 Simulated NH4 Obs Simulated NH4 Obs Simulated NH4 0 400 800 1200 1600 0 400 800 1200 1600 0 1 2 3 4 5 6 TOC (%) 0 10 20 30 40 50 ODU (µmol l–1) 0 10 20 30 40 50 0 1 2 3 4 5 6 0 2500 5000 750010000 0 1 2 3 4 5 6 0 10 20 30 40 50 Simulated TOC Obs, Apr 02 Simulated ODU Obs Simulated TOC Obs, Apr 02 Simulated ODU Obs, Apr 02Simulated TOC Obs
Simulated TOC 0 2000 4000 6000 8000 0 2500 5000 750010000 NH4+ (µmol l–1) O2 (µmol l–1) Fig. 2 (continued)
processes such as horizontal diffusion of oxygen from the benthic reworking activity. Note that because we used the diffusive fluxes calculation, we did not include rare bioturbated profiles (erratic shapes) in this study. In the previous study of Dedieu et al. (2007), statistical evaluation (Kruskal-Wallis test) of the oxy-gen flux heterooxy-geneity inside stations and between seasons showed a clear difference between oxygen fluxes of cold and warm periods at Stn C4 (95% of con-fidence level). Stn C5 showed a different pattern, with oxygen fluxes statistically grouped in a single pop-ulation. From the results, it appeared that a clear seasonal variation existed at Stn C4, whereas a large spatial heterogeneity hiding the temporal variability occurred at Stn C5.
Major model outputs
The first tests conducted without sulfide inhibition showed larger nitrification and denitrification rates than those measured experimentally (Table 3). The higher disparity appeared for the nitrification rate at Stn C5 (model output = 1.42 mmol N m–2d–1and mean
annual nitrification = 0.021 ± 0.004 mmol N m–2d–1). A
possible control of the nitrogen cycle by sulfide was
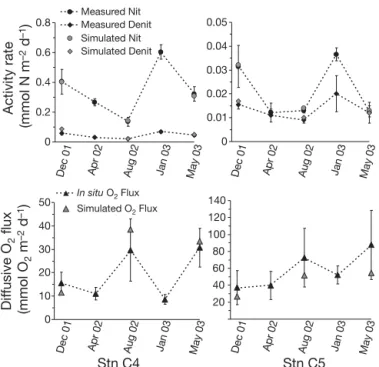
then tested with the diagenetic model by adding a coefficient of sulfur inhibition. Results showed that nitrification and denitrification rates were lower in the sulfide-enriched sediment and closer to measured rates indicating the natural potential of these processes in the sediments studied. Fig. 4 illustrates the good agreement between measured and calculated seasonal variations of nitrification, denitrification and oxygen fluxes when sulfide inhibition was added.
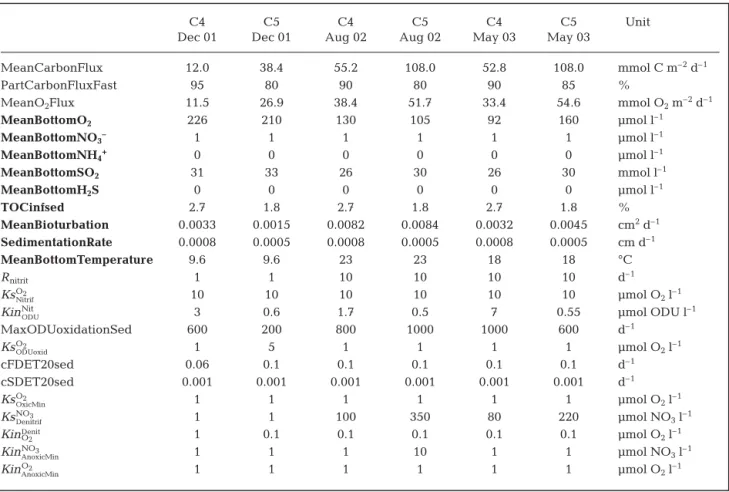
From this model adjustment, the major model out-puts showed that diffusive oxygen fluxes and carbon deposition rates were 2 and 3 times higher at the sta-tion inside the shellfish park than at the stasta-tion outside (Table 4). In December 2001, a high proportion of labile carbon was found at both stations, 95% at Stn C4 and 80% at Stn C5, with degradation constant values (at 20°C) of 0.06 and 0.1 d–1, respectively. In August
2002 and May 2003, the labile carbon fraction exceeded the slowly degradable one at both stations, 90% at Stn C4 and 80 to 85% at Stn C5, but the miner-alization constant value (at 20°C) of the labile material at both stations was similar at 0.1 d–1.
DISCUSSION Seasonal nitrogen dynamics
Measurements of nitrification and denitrification revealed a seasonal pattern with maximum rates occurring in December 2001 and January 2003. A neg-ative correlation between diffusive oxygen uptake and nitrification–denitrification rates appeared at both sta-tions; while maximum oxygen fluxes were reached in August 2002 and May 2003, the same periods had the minimum nitrification and denitrification rates (Fig. 3). Several factors are known to influence nitrogen and oxygen dynamics, such as temperature, bottom water oxygenation, oxic zone thickness and organic matter
With HS– Without HS– inhibition inhibition Stn C4 (Cflux= 55.2) Nitrification 0.143 1.834 (O2bw = 130) Denitrification 0.020 0.173 Stn C5 (Cflux= 108) Nitrification 0.014 1.416 (O2bw = 105) Denitrification 0.009 0.010
Table 3. Model nitrification and denitrification rates calcu-lated with or without a sulfur inhibition coefficient into the ini-tial nitrification equation. Tests were carried out under mea-sured O2bw(μmol O2l–1) and calculated Cflux(mmol C m–2d–1)
in August 2002. Nitrification and denitrification rates are expressed in mmol N m–2d–1 0 0.01 0.02 0.03 0.04 0.05 May 03 Jan 03 Aug 02 Apr 02 Dec 01 0 0.2 0.4 0.6 0.8 Measured Nit Measured Denit Simulated Nit Simulated Denit 20 40 60 80 100 120 140 0 10 20 30 40 50 In situ O2 Flux Simulated O2 Flux Activity rate (mmol N m –2 d –1 ) Dif fusive O 2 flux (mmol O 2 m –2 d –1 ) May 03 Jan 03 Aug 02 Apr 02 Dec 01 May 03 Jan 03 Aug 02 Apr 02
Dec 01 Jan May 03
03 Aug 02 Apr 02 Dec 01
Stn C4 Stn C5
Fig. 3. Comparison of simulated ( , , ) nitrification, denitri-fication and diffusive oxygen fluxes rates with those cal-culated from measured in situ oxygen profiles or sediment in-cubations (d, m, r) at Stns C4 and C5. In situ nitrification and denitrification rates assessed using the acetylene-blockage method; diffusive oxygen fluxes calculated from in situ
input (Henriksen & Kemp 1988, Herbert 1999, Kemp & Dodds 2002).
In this system, temperature was found to be one of the main variables regulating the seasonal oxygen dynamics (Dedieu et al. 2007). Nitrifying bacteria gen-erally exhibit optimal growth and activity during the late spring and summer when maximal temperatures and higher content of (fresh) organic matter in
sedi-ments are found (e.g. Hansen 1980, Seitzinger et al. 1984). However, results showed that temperature varies inversely with nitrification and denitrification since higher rates were measured during cold periods. Therefore, temperature does not directly control nitro-gen seasonal dynamics in this system.
With respect to the effect of bottom water oxygena-tion, some studies showed that potential nitrification
0 2 4 6 8 10 12 14 16 18 20 0 200 400 600 800 1000 NH4+ (µmol l–1) 0 1 2 3 4 5 6 TOC (%) 0 10 20 30 40 50 0 1000 2000 3000 4000 ODU (µmol l–1) C4 Dec 01 0 0.1 0.2 0.3 0.4 0 40 80 120160 200 240 O2 (µmol l–1) Depth (cm) 0 1 2 3 4 0 1 2 3 4 5 6 0 2000 4000 6000 8000 0 0.1 0.2 0.3 0.4 Depth (cm) 0 1 2 3 C4 Aug 02 0 10 20 30 40 50 Simulated TOC Obs, Apr 02 Simulated TOC Obs, Apr 02 Simulated ODU Obs Simulated NH4 Obs Simulated NH4 Obs Obs Simulated O2 Simulated NO3 Obs Simulated O2 Simulated NO3 Simulated NH4 Obs Simulated TOC Obs, Apr 02 Simulated ODU Obs 0 2 4 6 8 10 12 14 16 18 20 0 2 4 6 8 10 12 14 16 18 20 0 200 400 600 800 1000 0 40 80 120160 200 240 0 2 4 6 8 10 12 14 16 18 20 0 1 2 3 4 5 6 0 2000 4000 6000 8000 0 0.1 0.2 0.3 0.4 Depth (cm) 0 10 20 30 40 50 Simulated ODU Obs Obs Simulated O2 Simulated NO3 Obs Simulated O2 Simulated NO3 0 2 4 6 8 10 12 14 16 18 20 0 200 400 600 800 1000 0 40 80 120160 200 240 0 2 4 6 8 10 12 14 16 18 20 C5 Dec 01 C 5 Aug 02 0 40 80 120160 200 240 0 0.1 0.2 0.3 0.4 Depth (cm) 0 1 2 3 4 0 1 2 3 4 NO3 (µmol l–1) 0 400 800 1200 1600 0 1 2 3 4 5 6 0 2500 50007500 10000 Simulated NH4 Obs Simulated TOC Obs, Apr 02 Simulated ODU Obs 0 10 20 30 40 50 0 2 4 6 8 10 12 14 16 18 20 0 2 4 6 8 10 12 14 16 18 20
Fig. 4. In situ (f) and modeled ( ) oxygen, ammonium, TOC, ODU and ( ) simulated nitrate at Stns C4 and C5 during December 2001, August 2002 and May 2003. Parameters were fixed to better fit NH4+and ODU profiles. TOC profile measured
and denitrification began to decrease around 100 to 150 μmol O2l–1in temperate coastal waters (Rysgaard
et al. 1994, Kemp & Dodds 2002). No such oxygen con-ditions were measured at our stations during the cruise periods (with minima around 150 μmol O2 l–1 in
August 2002 and May 2003); thus, oxygen limitation cannot explain the decrease of coupled nitrification– denitrification rates during these warm periods.
Chemoautotrophic nitrifying bacteria are considered to be strictly aerobic and require free O2for NH4+and
NO2– oxidation. Consequently, growth of nitrifiers is
restricted to the oxic layers of sediments and the limits of downward oxygen diffusion directly affect micro-bial populations, altering and limiting coupled nitrification–denitrification. (e.g. Lorenzen et al. 1998). Our data set and modelling suggest that fluctuation in oxygen penetration depth is related to nitrogen dynamics, especially at Stn C5 since the observed strong contraction of the oxic zone in August 2002 and May 2003 corresponded to the minimum nitrification and denitrification rates.
From model runs, nitrification and denitrification rates and their seasonal evolution appeared in accor-dance with field data where intensity of these pro-cesses was low, with minimum rates occurring during the warm periods of August 2002 and May 2003. Table 5 presents the overall contribution of the main pathways (denitrification, oxic and anoxic mineraliza-tion) in the sediments estimated by the model. Anoxic mineralization appeared significantly higher for organic matter cycling compared with denitrification and oxic mineralization at both stations. In August 2002 and May 2003 more than 80% of total mineraliza-tion occurred through anoxic routes. The remainder was essentially attributed to oxic mineralization since denitrification represented less than 1% of the organic matter degradation pathways. The model suggests that anoxic mineralization was higher at Stn C5 inside the farming area as compared with that at Stn C4 far from the shellfish zone. This could be related to the overall larger input of organic matter from shellfish farming activity. On a seasonal basis, winter was more
favor-C4 C5 C4 C5 C4 C5 Unit
Dec 01 Dec 01 Aug 02 Aug 02 May 03 May 03
MeanCarbonFlux 12.0 38.4 55.2 108.0 52.8 108.0 mmol C m–2d–1
PartCarbonFluxFast 95 80 90 80 90 85 %
MeanO2Flux 11.5 26.9 38.4 51.7 33.4 54.6 mmol O2m–2d–1
MeanBottomO2 226 210 130 105 92 160 μmol l–1 MeanBottomNO3– 1 1 1 1 1 1 μmol l–1 MeanBottomNH4+ 0 0 0 0 0 0 μmol l–1 MeanBottomSO2 31 33 26 30 26 30 mmol l–1 MeanBottomH2S 0 0 0 0 0 0 μmol l–1 TOCinfsed 2.7 1.8 2.7 1.8 2.7 1.8 % MeanBioturbation 0.0033 0.0015 0.0082 0.0084 0.0032 0.0045 cm2d–1 SedimentationRate 0.0008 0.0005 0.0008 0.0005 0.0008 0.0005 cm d–1 MeanBottomTemperature 9.6 9.6 23 23 18 18 °C Rnitrit 1 1 10 10 10 10 d–1 KsO2 Nitrif 10 10 10 10 10 10 μmol O2l–1 KinNit
ODU 3 0.6 1.7 0.5 7 0.55 μmol ODU l
–1 MaxODUoxidationSed 600 200 800 1000 1000 600 d–1 KsO2 ODUoxid 1 5 1 1 1 1 μmol O2l–1 cFDET20sed 0.06 0.1 0.1 0.1 0.1 0.1 d–1 cSDET20sed 0.001 0.001 0.001 0.001 0.001 0.001 d–1 KsO2 OxicMin 1 1 1 1 1 1 μmol O2l–1 KsNO3 Denitrif 1 1 100 350 80 220 μmol NO3l–1 KinO2 Denit 1 0.1 0.1 0.1 0.1 0.1 μmol O 2l–1 KinNO3 AnoxicMin 1 1 1 10 1 1 μmol NO3l–1 KinO2 AnoxicMin 1 1 1 1 1 1 μmol O2l–1
Table 4. Model outputs with mean rates of carbon deposition on the surface sediment (MeanCarbonFlux) and % of labile organic carbon (PartCarbonFluxFast) oxygen flux from the bottom water into the sediment (MeanO2Flux). Bold = boundary conditions,
fixed through measured in situ conditions: MeanBottomO2, Dedieu et al. (2007); MeanBottomSO2and MeanBottomH2S, Metzerg
et al. (2007); MeanBioturbation and SedimentationRate, Schmidt et al. (2007) and Duport et al. (2007). Other parameter values obtained from literature: NH4Adsorption, Soetaert et al. (1996) and Q10, Thamdrup et al. (1998)
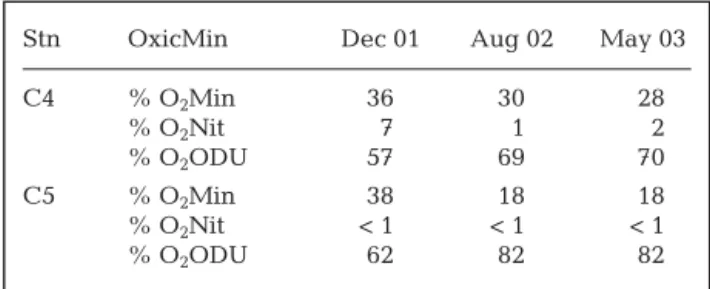
able to oxic mineralization at both stations presumably due to lower inputs of very labile organic matter. The model also revealed that the major part of oxygen con-sumption was used to re-oxidize byproducts from anaerobic reactions, especially at Stn C5 during the warm periods (Table 6).
Nitrogen and sulfur coupling
At the lagoon scale, the higher sulfide content in sur-face sediments of Stn C5 (Metzger et al. 2007) suggest a higher sulfide inhibition of nitrification, which would be in agreement with the lower nitrification and cou-pled denitrification rates measured in this station. At Stn C4, sulfide concentration started to increase at about the 15 cm depth in August 2002 and 30 cm in December 2001 and April 2002. According to Metzger et al. (2007), this is due to the rapid sulfide interaction with reactive ferric minerals keeping sulfide low. This reduced amount of sulfide near the oxic zone may result in a lower inhibition of nitrification compared with Stn C5. Some studies suggested that manganese oxides could consume the potential pool of available NH4+to form N2or NO3–(Luther et al. 1997, Hulth et al.
1999, Anschutz et al. 2000). However, neither NO3–nor Mn2+ concentrations,
required to support nitrification, were measured in significant amount in the anoxic zone of the sediments suggest-ing that this reaction did not occur.
Total NH4+ fluxes were measured in
benthic chambers (0.196 m2) in May
2003 (Thouzeau et al. 2007). Results showed a release of NH4+from the
sed-iment at both stations. NH4+efflux was
6 times higher at the station inside the shellfish area (8.23 ± 0.53 mmol N m–2
d–1) than outside (1.5 ± 0.71 mmol N m–2
d–1). This large measured NH
4+efflux is
in accordance with the large anaerobic
mineralization at both stations and measured low rates of nitrification, which prevents ammonium consump-tion. Model outputs in May 2003 showed a similar trend with larger NH4+ fluxes evident in the shellfish
area (Stn C5) compared with the reference station (Stn C4), but the absolute flux values were larger than those from benthic chambers (13.8 and 6.1 mmol N m–2
d–1 at Stns C5 and C4, respectively). Model outputs
also show larger NH4+and ODU concentrations in the
sediment porewaters (Fig. 2). This indicates a general overestimation of anoxic processes in the model that could be due to a temporal decoupling between aero-bic and anaeroaero-bic mineralization processes. Another set of simulations with adjustments of NH4+and ODU
profiles was achieved at both stations for the 2 distinct seasons of December 2001 and August 2003. The results show a large reduction of oxic and anoxic rates, which are incompatible with the observation made by microelectrodes, and have a lower impact on nitrifica-tion and denitrificanitrifica-tion rates (Table 7). This decoupling of oxic and anoxic processes could be due to the differ-ence in residdiffer-ence time in the oxic layer (a few days) compared with anoxic processes that occur deeper in the sediment and have a longer reaction time (a few months). There is also a seasonal pattern for the
decou-Stn Dec 01 Aug 02 May 03
C4 % OxicMin 34 21 18 % Denit 1 < 1 < 1 % AnoxicMin 65 79 82 C5 % OxicMin 27 9 9 % Denit < 1 < 1 < 1 % AnoxicMin 73 91 91
Table 5. Main processes contribution (%) of organic matter mineralization: oxic mineralization (OxicMin), denitrification
(Denit) and anoxic mineralization (AnoxicMin)
Stn OxicMin Dec 01 Aug 02 May 03
C4 % O2Min 36 30 28 % O2Nit 7 1 2 % O2ODU 57 69 70 C5 % O2Min 38 18 18 % O2Nit < 1 < 1 < 1 % O2ODU 62 82 82
Table 6. Percent (%) distribution of O2 demand processes
among 3 different processes that require oxygen: O2used in
aerobic mineralization (O2Min), O2used by nitrifying bacteria
(O2Nit) and O2used to oxidize the reduced products (O2ODU)
Stn C4 Stn C5 Simulation
Dec 01 Aug 02 Dec 01 Aug 02
Mean C Flux 8.16 7.20 7.20 7.20 NH4/ODU
12.00 55.20 38.40 108.00 O2/TOC
Mean O2Flux 8.30 7.11 5.72 6.50 NH4/ODU
11.50 38.40 26.90 51.70 O2/TOC
Nitrification 0.879 0.277 0.061 0.053 NH4/ODU
0.400 0.143 0.032 0.014 O2/TOC
Denitrification 0.110 0.023 0.027 0.008 NH4/ODU
0.086 0.020 0.017 0.009 O2/TOC
Table 7. Model outputs of the mean carbon and oxygen fluxes (mmol C m–2d–1)
and nitrification and denitrification rates (mmol N m–2.d–1) from simulations of
pling of oxic and anoxic mineralization processes. This discrepancy could be partly explained by large varia-tions in macrofaunal activity as shown by Schmidt et al. (2007). Indeed, those authors displayed clear varia-tions in the seasonal pattern and vertical distribution of sediment reworking intensities in the Thau Lagoon sediments that could influence transport of particulate and dissolved species. Modelling of reactive species took into account bioturbation, but not its variation with depth or time that could explain the NH4+ and
ODU profiles discrepancies. This decoupling empha-sizes the necessity to consider the nonstationary state in perturbed sediments to better estimate the anoxic mineralization rates and improve the general repre-sentation of solutes profiles. The in situ data set and
model information also suggest that oxygen availabil-ity in the sediment (oxic zone thickness) partially con-trols the seasonal variation of the nitrogen cycle, but plays a minor role in the average intensity of nitrifica-tion/denitrification at each station. Among the differ-ent processes that limit nitrification and denitrification, sulfide inhibition seemed to be significant in this lagoon whereas ammonium concentrations in pore waters and bottom water oxygenation were not limit-ing. These measurements also revealed that nitrifica-tion and denitrificanitrifica-tion intensity were negatively cor-related with the organic carbon mineralization due to the sulfide production in organic-rich sediments.
Acknowledgements. We thank B. Bombled who deployed the profiler and dived during cruises at the Thau Lagoon; G. Sarazin, D. Jézéquel, J.-J. Bourrand, R. Graille, B. de Ligondès and F. Zuberer for their assistance and diving dur-ing profiler deployment; and the crew of the ‘Chlamys J.-L. Guillou’. We thank R. C. Aller for his scientific input. We also thank the IFREMER Station of Sète for providing laboratory space and the research boat. This work was supported by a grant from the PNEC-ART1 (Microbent) and the Laboratoire des Sciences du Climat et de l’Environnement (CEA-CNRS), and by the EU commission (STREP COBO; contract number GOCE-CT-2003-505564). This is LSCE contribution number 2809.
LITERATURE CITED
Anderson LG (1979) Simultaneous spectrophotometric deter-mination of nitrite and nitrate by flow injection analysis. Anal Chem Acta 110:123–128
Anschutz P, Sundby B, Lefrançois L, Luther III GW, Mucci A (2000) Interactions between metal oxides and species of nitrogen and iodine in bioturbated marine sediments. Geochim Cosmochim Acta 64:2751–2763
Anschutz P, Chaillou G, Lecroart P (2007) Phosphorus diage-nesis in sediment of the Thau Lagoon. Estuar Coast Shelf Sci 72:447–456
Bendschneider K, Robinson RJ (1972) A new spectrometric method for determination of nitrite in sea water. J Mar Res 11:87–96
Berg P, Risgaard-Petersen N, Rysgaard S (1998) Interpretation of measured concentration profiles in sediment pore water. Limnol Oceanogr 43:1500–1510
Berner RA (1980) Early diagenesis: a theoretical approach. Princeton University Press, Princeton, NJ
Blackburn TH, Sørensen J (1988) Nitrogen cycling in coastal marine environments. John Wiley and Sons, New York Boudreau BP (1997) Diagenetic models and their
implemen-tation: modelling transport and reactions in aquatic sediments. Springer Verlag, Berlin
Brandes JA, Devol AH (1995) Simultaneous nitrate and oxy-gen respiration in coastal sediments: evidence for discrete diagenesis. J Mar Res 53:771–797
Christensen JP, Murray JW, Devol AH, Codispoti LA (1987) Denitrification in continental shelf sediments has major impact on the oceanic nitrogen budget. Global Biogeo-chem Cycles 1:97–116
Christensen PB, Glud RN, Dalsgaard T, Gillespie P (2003) Impacts of longline mussel farming on oxygen and nitrogen dynamics and biological communities of coastal sediments. Aquaculture 218:567–588
Dalsgaard T, Canfield DE, Petersen J, Tramdrup B, Acuña-González J (2003) N2production by the anammox reaction
in the anoxic water column of Golfo Dulce, Costa Rica. Nature 422:606–608
Dalsgaard T, Thamdrup B, Canfield DE (2005) Anaerobic ammonium oxidation (anammox) in the marine environ-ment. Res Microbiol 156:457–464
Dedieu K, Rabouille C, Thouzeau G, Jean F, Chauvaud L, Clavier J, Mesnage V, Ogier S (2007) Benthic O2 distrib-ution and dynamics in a Mediterranean lagoon (Thau, France): an in situ microelectrode study. Estuar Coast Shelf Sci 72:393 – 405
Devol AH (1991) Direct measurements of nitrogen gas fluxes from continental shelf sediments. Nature 349:319–321 Duport E, Gilbert F, Poggiale JC, Dedieu K, Rabouille C,
Stora G (2007) Benthic macrofauna and sediment rework-ing quantification in contrasted environments in the Thau Lagoon. Estuar Coast Shelf Sci 72:522–533
Espitalié J, Derro G, Marquis F (1985) La pyrolyse Rock-Eval et ses applications. Rev Inst Fr Pétrole 40:563–579 Eyre B, Ferguson AJP (2002) Sediment biogeochemical
indi-cators for defining sustainable nutrient loads to coastal ecosystems. Proceedings of Coast to Coast 2002 – ‘Source to Sea’. Tweed Heads, p 101–104
Froelich PN, Klinkhammer GP, Bender ML, Luedtke NA and 6 others (1979) Early oxidation of organic matter in pelagic sediments of the eastern equatorial Atlantic: suboxic dia-genesis. Geochim Cosmochim Acta 43:1075–1090 Gilbert F, Souchu P, Bianchi M, Bonin P (1997) Influence of
shellfish farming activities on nitrification, nitrate reduction to ammonium and denitrification at the water–sediment interface of the Thau lagoon, France. Mar Ecol Prog Ser 151:143–153
Hall POJ, Aller RC (1992) Rapid, small-volume flow injection analysis for SCO2 and NH4+ in marine and freshwaters. Limnol Oceanogr 37:1113–1119
Hamon PY, Tournier H (1981) Estimation de la biomasse en culture dans l’etang de Thau. Sci Pêche 313:1–23 Hansen JI (1980) Potential nitrification in marine sediments.
MSc thesis, University of Aarhus
Henriksen K, Kemp WM (1988) Nitrification in estuarine and coastal marine sediments. In: Blackburn TH, Sørensen J (eds) Nitrogen cycling in coastal marine environments. John Wiley and Sons, Chichester, p 207–249
Herbert RA (1999) Nitrogen cycling in coastal marine eco-systems. FEMS Microbiol Rev 23:563 – 590
Hesslein RH (1976) An in-situ sampler for close interval pore water studies. Limnol Oceanogr 21:912–914
Hulth S, Aller RC, Gilbert F (1999) Coupled anoxic nitrifica-tion/manganese reduction in marine sediments. Geochim Cosmochim Acta 63:49–66
Hulthe G, Hulth S, Hall POJ (1998) Effect of oxygen on degra-dation rate of refractory and labile organic matter in conti-nental margin sediments. Geochim Cosmochim Acta 62: 1319–1328
Hyacinthe C, Anschutz P, Carbonel P, Jouanneau JM, Joris-sen FJ (2001) Early diagenetic processes in the muddy sediments of the Bay of Biscay. Mar Geol 177:111–128 Jensen K, Revsbech NP, Nielsen LP (1993) Microscale
distrib-ution of nitrification activity in sediment determined with a shielded microsensor for nitrate. Appl Environ Microbiol 59: 3287–3296
Joye SB, Hollibaugh JT (1995) Influence of sulfide inhibition of nitrification on nitrogen regeneration in sediments. Sci-ence 270:623–625
Kemp MJ, Dodds WK (2002) The influence of ammonium, nitrate, and dissolved oxygen concentrations on uptake, nitrification, and denitrification rates associated with prairie stream substrata. Limnol Oceanogr 47:1380–1393 Klemedtsson L, Svensson BH, Rosswall T (1988) A method of selective inhibition to distinguish between nitrification and denitrification as sources of nitrous oxide in soil. Biol Fertil Soils 6:106–111
Klemedtsson L, Hansson G, Mossier A (1990) The use of acetylene for the quantification of N2and N2O production
from biological processes in soil. In: Revsbech NP, Sørensen J (eds) Denitrification in soil and sediment. Plenum Press, New York, p 167–180
Kuypers MMM, Sliekers AO, Lavik G, Schmid M and 5 others (2003) Anaerobic ammonium oxidation by anammox bacteria in the Black Sea. Nature 422:608–611
Lohse L, Malschaert JFP, Slomp CP, Helder W, Raaphorst WV (1993) Nitrogen cycling in North Sea sediments: interac-tion of denitrificainterac-tion and nitrificainterac-tion in offshore and coastal areas. Mar Ecol Prog Ser 101:283–296
Lorenzen J, Larsen LH, Kjaer T, Revsbech NP (1998) Biosen-sor determination of the microscale distribution of nitrate, nitrate assimilation, nitrification, and denitrification in a diatom-inhabited freshwater sediment. Appl Environ Microbiol 64:3264–3269
Luther I, George W, Sundby B, Lewis BL, Brendel PJ, Silver-berg N (1997) Interactions of manganese with the nitrogen cycle: alternative pathways to dinitrogen. Geochim Cos-mochim Acta 61:4043–4052
Mesnage V, Ogier S, Bally G, Disnar JR, Lottier N, Dedieu K, Rabouille C, Copard Y (2007) Nutrient dynamics at the
sediment-water interface in a Mediterranean lagoon (Thau, France): influence of biodeposition by shellfish farming activities. Mar Environ Res 63:257–277
Metzger E, Simonucci C, Viollier E, Sarazin G, Prevot F, Jeze-quel D (2007) Benthic response to shellfish farming in Thau lagoon: pore water signature. Estuar Coast Shelf Sci 72: 406–419
Revsbech NP (1989) An oxygen microsensor with a guard cathode. Limnol Oceanogr 34:474–478
Risgaard-Petersen N, Rysgaard S, Nielsen LP, Revsbech NP (1994) Diurnal variation of denitrification and nitrification in sediments colonised by benthic microphytes. Limnol Oceanogr 39:573–579
Rysgaard S, Risgaard-Petersen N, Sloth NP, Jensen K, Nielsen LP (1994) Oxygen regulation of nitrification and denitrification in sediments. Limnol Oceanogr 39:1643–1652
Rysgaard S, Risgaard-Petersen N, Sloth NP (1996) Nitrification, denitrification, and nitrate ammonification in sediments of two coastal lagoons in Southern France. Hydrobiologia 329: 133–141
Schmidt S, Jouanneau JM, Weber O, Lecroart P, Rada-kovitch O, Gilbert F, Jezequel D (2007) Sedimentary processes in the Thau Lagoon (France): from seasonal to century time scales. Estuar Coast Shelf Sci 72: 534 – 542
Seitzinger SP, Nixon SW, Pilson ME (1984) Denitrification and nitrous oxide production in a coastal marine ecosystem. Limnol Oceanogr 29:73–83
Soetaert K, Herman PMJ, Middelburg JJ (1996) A model of early diagenetic processes from the shelf to abyssal depths. Geochim Cosmochim Acta 60:1019–1040 Thamdrup B, Hansen JW, Jørgensen BB (1998) Temperature
dependence of aerobic respiration in a coastal sediment. FEMS Microbiol Ecol 25:189–200
Thouzeau G, Grall J, Clavier J, Chauvaud L and 5 others (2007) Spatial and temporal variability of benthic biogeo-chemical fluxes associated with macrophytic and macro-faunal distributions in the Thau lagoon (France). Estuar Coast Shelf Sci 72:432–446
Treguer P, Le Corre P (1975) Manuel d’analyse des sels nutri-tifs dans l’eau de mer (utilisation de l’autoAnalyseur II Technicon), 2nd edn. Laboratoire d’océanographie chi-mique, UBO, Brest
Ullman WJ, Aller RC (1982) Diffusion coefficients in nearshore marine sediments. Limnol Oceanogr 27: 552–556
Usui T, Koike I, Ogura N (2001) N2O production, nitrification
and denitrification in an estuarine sediment. Estuar Coast Shelf Sci 52:769–781
Editorial responsibility: Howard Browman (Associate Editor-in-Chief), Storebø, Norway
Submitted: December 15, 2005 Accepted: May 6, 2007 Proofs received from author(s): September 13, 2007