Publisher’s version / Version de l'éditeur:
Vous avez des questions? Nous pouvons vous aider. Pour communiquer directement avec un auteur, consultez la première page de la revue dans laquelle son article a été publié afin de trouver ses coordonnées. Si vous n’arrivez pas à les repérer, communiquez avec nous à PublicationsArchive-ArchivesPublications@nrc-cnrc.gc.ca.
Questions? Contact the NRC Publications Archive team at
PublicationsArchive-ArchivesPublications@nrc-cnrc.gc.ca. If you wish to email the authors directly, please see the first page of the publication for their contact information.
https://publications-cnrc.canada.ca/fra/droits
L’accès à ce site Web et l’utilisation de son contenu sont assujettis aux conditions présentées dans le site LISEZ CES CONDITIONS ATTENTIVEMENT AVANT D’UTILISER CE SITE WEB.
Internal Report (National Research Council of Canada. Institute for Research in Construction), 1991-12-12
READ THESE TERMS AND CONDITIONS CAREFULLY BEFORE USING THIS WEBSITE. https://nrc-publications.canada.ca/eng/copyright
NRC Publications Archive Record / Notice des Archives des publications du CNRC :
https://nrc-publications.canada.ca/eng/view/object/?id=ef42a73e-747a-47a5-b265-ede180205dc7 https://publications-cnrc.canada.ca/fra/voir/objet/?id=ef42a73e-747a-47a5-b265-ede180205dc7
NRC Publications Archive
Archives des publications du CNRC
For the publisher’s version, please access the DOI link below./ Pour consulter la version de l’éditeur, utilisez le lien DOI ci-dessous.
https://doi.org/10.4224/20375052
Access and use of this website and the material on it are subject to the Terms and Conditions set forth at
Fire resistance tests of exterior sheet steel walls insulated with 152 mm thick, 64 kg/m3 density, mineral wool insulation
National Research Conseil national Council Canada de recherches Canada
lnstitut de recherche en construction
IUC-CIUC
by M. Chabot
This is an internal report of the Institute for Research in Construction. Although not intended for general distribution, it may be cited as a reference in other publications Internal Report No. 617
Date of issue: December 1991
L I B R A R Y
E I B L I O T H $ Q U E
1
I R CFIRE RESISTANCE TESTS OF EXTERIOR SHEET STEEL WALLS
INSULATED WITH 152 mm THICK, 64 kg/m3 DENSITY, MINERAL
WOOL INSULATION
by M. Chabot
ABSTRACT
Two fire resistance tests of non-loadbearing exterior sheet steel wall assemblies, conducted in accordance with test method CAN4-S10l-M89,
are
described. The assemblies were sandwich-type sheet steel wall panels with a 152 mm thick, 64 kg/m3 density, mineral wool insulating core. Normal and thermal 2-bar sub-girts weresuccessively used to support the assemblies. The type of sub-girt showed little influence on the fire resistance of the assemblies, the sagging of the insulation being the dominating factor. The fire resistance ratings did not exceed 45 min, with failure occurring by
excessive temperature rise on the unexposed surface of the walls.
The equivalent opening factor (FEO) values of the wall assemblies, calculated for 1- and 2-hour fire resistance ratings are also given. The FD factor, as defined in the National Building Code of Canada, permits acceptance of an exterior wall assembly which fails to provide the required fire resistance rating due to excessive unexposed surface temperature rise.
INTRODUCTION
Insulated sheet steel walls are commonly used on the exterior of commercial and industrial steel-framed buildings. In many cases, the National Building Code of Canada (NBCC) [l] requires that the exterior walls of such buildings have a fire resistance rating of 45 min, 1 or 2 hours. Under a joint project between the Canadian Steel Construction Council and the National Research Council of Canada, a number of fire tests have been conducted over the past few years with the aim of producing an economical fire-rated sheet steel wall assembly [2].
This report describes the results of two f ~ e resistance tests conducted in November 1989 and May 1990 on sheet steel wall assemblies insulated with 152 mm thick mineral wool insulation of 64 kg/m3 density. The tests were performed in accordance with standard test method CAN4-S101-M89 [3] for a period of two hours for the purpose of assessing thefire resistance rating of the wall assemblies and evaluating the equivalent opening factor (FEo) values for fire-exposure periods greater than the fire resistance rating of the assemblies. The equivalent opening factor provision in the NBCC permits
acceptance of exterior walls which do not provide the required fire resistance rating based on failure by the unexposed surface temperature criterion, but which remained in place for the duration required by the NBCC.
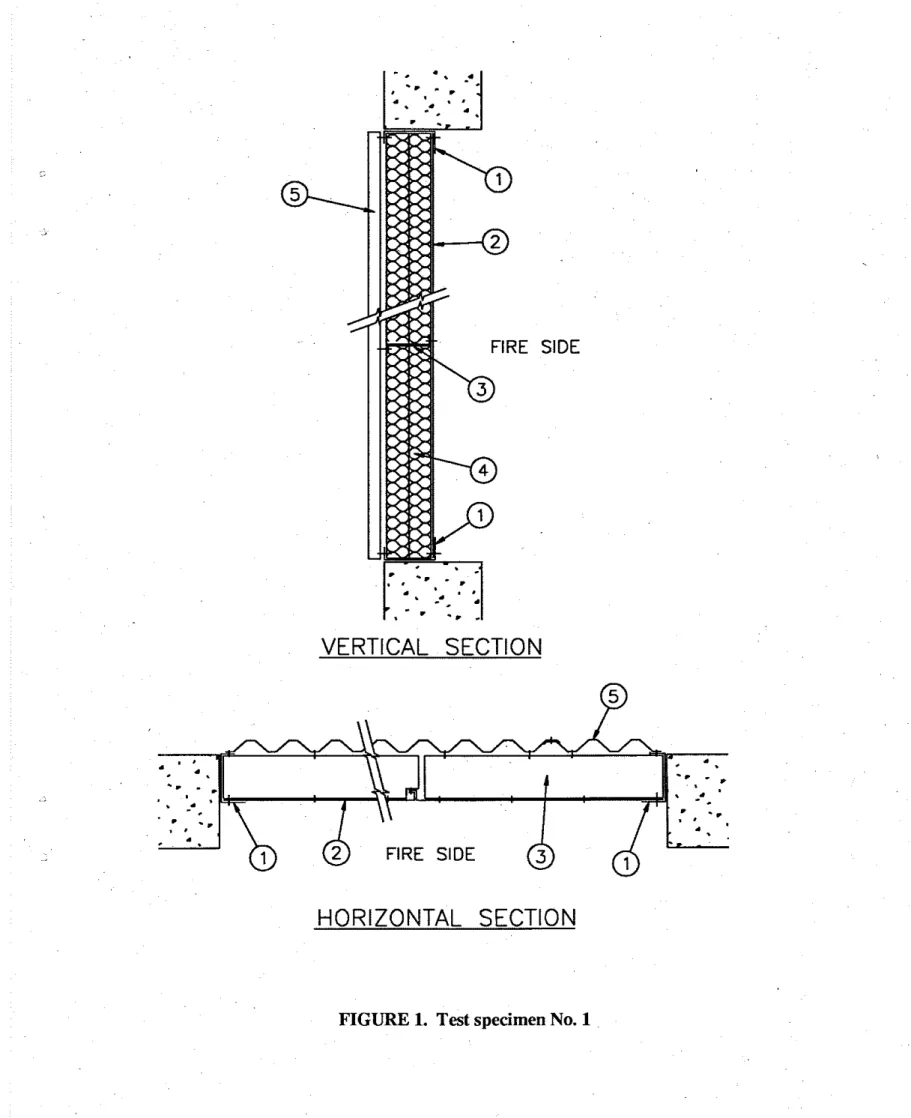
DESCRIPTION OF TEST SPECIMENS
The specimens were sandwich-type wall panels, 3660 mm (12 ft) high by 3050 mm (10 ft) wide, consisting of two sheets of galvanized steel encasing 152 mm (6 in.) of
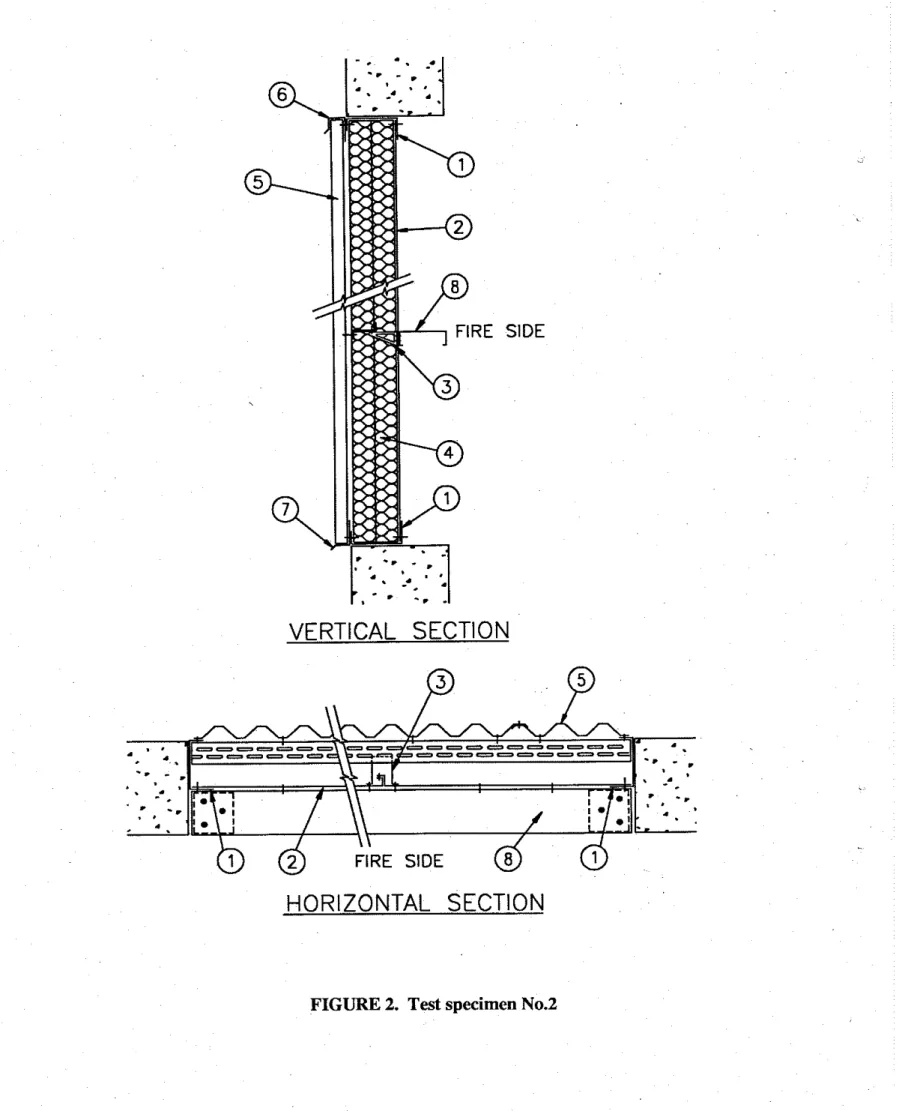
mineral wool baa insulation. The panels were supported at mid-height by a horizontal sub- girt placed between the two sheets. Two different types of Z-bar sub-girt were used in these tests: a normal notched Z-bar sub-girt in Test No. 1 and a "thermal" Z-bar sub-girt in Test No. 2. As these wall assemblies were non-loadbearing, they were built in a concrete frame so as to be restrained on all four edges. A detailed description of the specimens is given below, with item numbers referring to those in Figures 1 and 2. Product and supplier names are given in italics between brackets
"[I",
where appropriate.1. Flashing channels [VicWest Steel]: 152 mm (6 in.) wide channels with 45 mm (1.75 in.) and 76 mm (3 in.) flanges, fabricated from 1.52 mm thick (16 Ga) galvanized sheet steel. Fastened to the concrete frame with 6.4 mm x 45 mm (0.25 in. x 1.75 in.) concrete anchors spaced 406 mm (16 in.) OC.
2. Steel liner sheets [ B O O - VicWest Steel]: 800 mm (31.5 in) wide panels, fabricated from 0.61 mm thick (24 Ga) galvanized sheet steel. Fastened to flashing channels with sheet metal screws spaced 305 mm (12 in.) OC. Side lap joints (consisting of an interlocking lip and groove) sealed with factory-applied butyl caulking and secured with sheet metal screws spaced 305 mm (12 in.) OC. Because the liner acts as an air barrier, butyl tape was applied between the liner sheets and the flashing channels to seal the perimeter of the specimen.
In Test No. 2, the liner sheets were also fastened to a structural girt (Item No. 8) with sheet metal screws spaced 250 mm (10 in.) OC.
3. Z-bar sub-girt [VicWest Steel]:
Test No. 1: 152 mm (6 in.) wide x 800 mm (31.5 in.) long notched 2-bars with 25 mm (1 in.) and 38 mm (1.5 in.) flanges, fabricated from
1.22 mm thick (18 Ga) galvanized sheet steel. Fastened to the liner sheets with sheet metal screws spaced not more than 250 mm
(10 in.) OC.
Test No. 2: 76 mm (3 in.) wide x 1830 mm (60 in.) long slotted Zbars with
25 mm (1 in.) flanges, fabricated from 1.52 mm thick (16 Ga) sheet steel, fastened to 76 mm (3 in.) deep "U-shape" thermo-spacer clips with two sheet metal screws. Thermo-spacer clips, 1.91 mm thick (14 ga), fastened to the structural girt at every liner joint with four sheet metal screws (Figure 3).
4. Mineral wool batts: 64 kg/m3 (4 lbIft3) density, supplied in 76 mm (3 in.) thick
sheets, 610 mm x 1220 mm (24 in. x 48 in.). Two layers installed with both joints
.
-
staggered and attached to the liner sheets with stick pins riveted to the liner sheets.
Test No. 1: [Themjiber
-
United States Gypsum Company]; Four stick pins per sheet.Test No. 2: [Themjiber
-
Canadian Gypsum Company]Nine stick pins per sheet.
5. Exterior cladding [CL840 - VicWest Steel]: Painted, corrugated sheet steel panels, 935 mm (36.8 in.) wide, 0.46 mm thick (26 Ga), with 40 mm (1.57 in.) deep ribs 134 mm (5.27 in.) OC. Fastened to flashing channels with sheet metal screws spaced 406 rnm (16 in.) and to the 2-bar sub-girt with sheet metal screws
every second rib. Lap joints of adjacent panels fastened with sheet metal screws spaced 406 mm (16 in.).
The following items were used in Test No. 2 only.
6. Cap flashing [VicWest Steel]: 0.46 mm thick (26 Ga), 3660 mm (12 ft) long, used to
t
r
i
m
top of exterior cladding. Fastened to the top flashing channel and exterior cladding with sheet metal screws.7. Drip flashing [VicWest Steel]: 0.46 mm thick (26 Ga), 3660 mm (12 ft) long, used to trim base of exterior cladding. Fastened to bottom flashing channels with sheet metal screws.
8. Structural girt: C-channel, 1.91 mm thick (14 Ga), attached to 127 mm x
102 mm x 3.42 mm (5 in. x 4 in. x 0.135 in.) angles at both ends with three 9.5 mm
(0.375 in.) steel bolts in slotted holes. Angles attached to concrete frame with three 6.4 mm x 45 mm (0.25 in. x 1.75 in.) concrete anchors.
The sheet metals screws were #14 screws, 19 mm (0.75 in.) long. Before the test, the edges of the exposed face of the specimens were sealed with ceramic fibre blankets.
TEST PROCEDURE AND INSTRUMENTATION
The specimens were subjected to a fire endurance test in accordance with the standard test method CAN4-S101-M89 [3] for a period of two hours. The tests were performed in the propane gas-fired wall furnace of the National Fire Laboratory of the Institute for Research in Construction. The specimens were exposed to fue on the liner side.
The temperature in the furnace was mcasurcd by nine symmetrically dislributcd thcrmwouplcs and controlled to follow thc standard time-temperalure curve in CAN4-
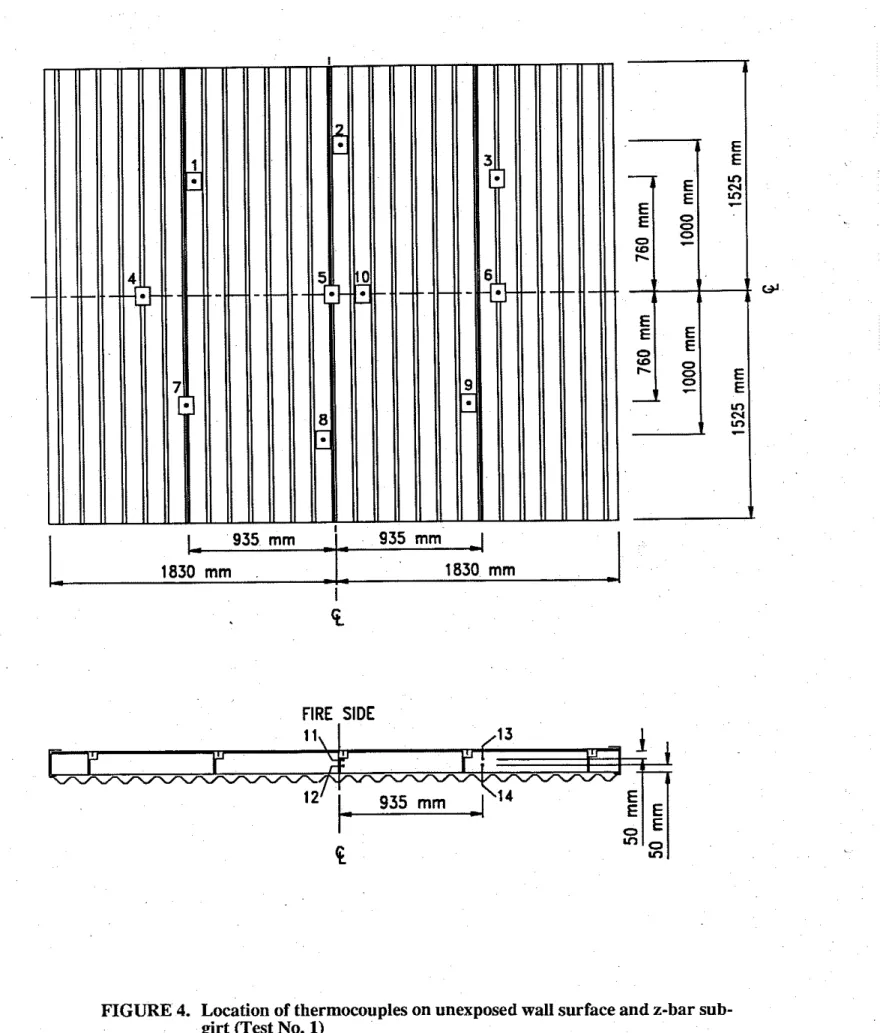
The temperature of the unexposed wall surface was measured by 10 thermocouples in both tests
Was.
1-10), as shown in Figures 4 and 5. These thermocouples, indicated by square boxes in Figures 4 and 5, were placed under standard 10 mm thick refractory fibre pads which were shaped to ensure full contact over the cormgated surface. Thermocouples Nos. 1 , 2 , 8 , 9 and 10 were placed in the valleys of the corrugations; the others, Nos. 3-7. were placed on the ridges. In Test No. 2, nine additional thermocouples (Nos. 11-19) were installed on the unexposed surface of the specimen to study the influence of the thermocouple pads on surface temperature measurements. The beads of these thermocouples were silver-soldered to the steel sheets.As illustrated in Figures 4 and 5, a number of thermocouples were also placed on the 2-bar sub-girt inside each specimen.
The lateral deflection of the specimen was measured in both tests with deflection gauges installed on the unexposed side of the specimen, opposite the Z-bar sub-girt.
During the tests, the intensity of radiation emitted by the unexposed surface of the specimen was measured using heat flux meters. In Test No. 1, one heat flux meter was placed at mid-height of the specimen, 1.2 m from its unexposed surface. In Test No. 2,
the radiation intensity was measured at three different locations: mid-height, 1.2 m from the unexposed surface, as well as 760 mm above and below mid-height, 0.9 m from the unexposed surface.
RESULTS AND DISCUSSION Observations
Test No. 1
- For the fust 30 min, flaming was observed at the liier joints and perimeter of the specimen on the exposed side, accompanied by light white smoke issuing from the top of the specimen on the unexposed side, indicating combustion of the butyl caulking and tape. As the test progressed, the white smoke, which appeared like steam, reduced in density and continued to issue from the top of the specimen for the duration of the test. The steam likely resulted from evaporation of the binder in the mineral wool insulation.
- The liner sheets started to warp after a few minutes into the test and the joints partially opened.
- At 41 min, the paint started to char around a screw on the unexposed side, opposite the Z-bar sub-girt, near thermocouple No. 5. At 54 min, the paint started to char near the top of the specimen. As the test progressed, the paint continued to char opposite the Z-bar sub-girt and near the top of the specimen.
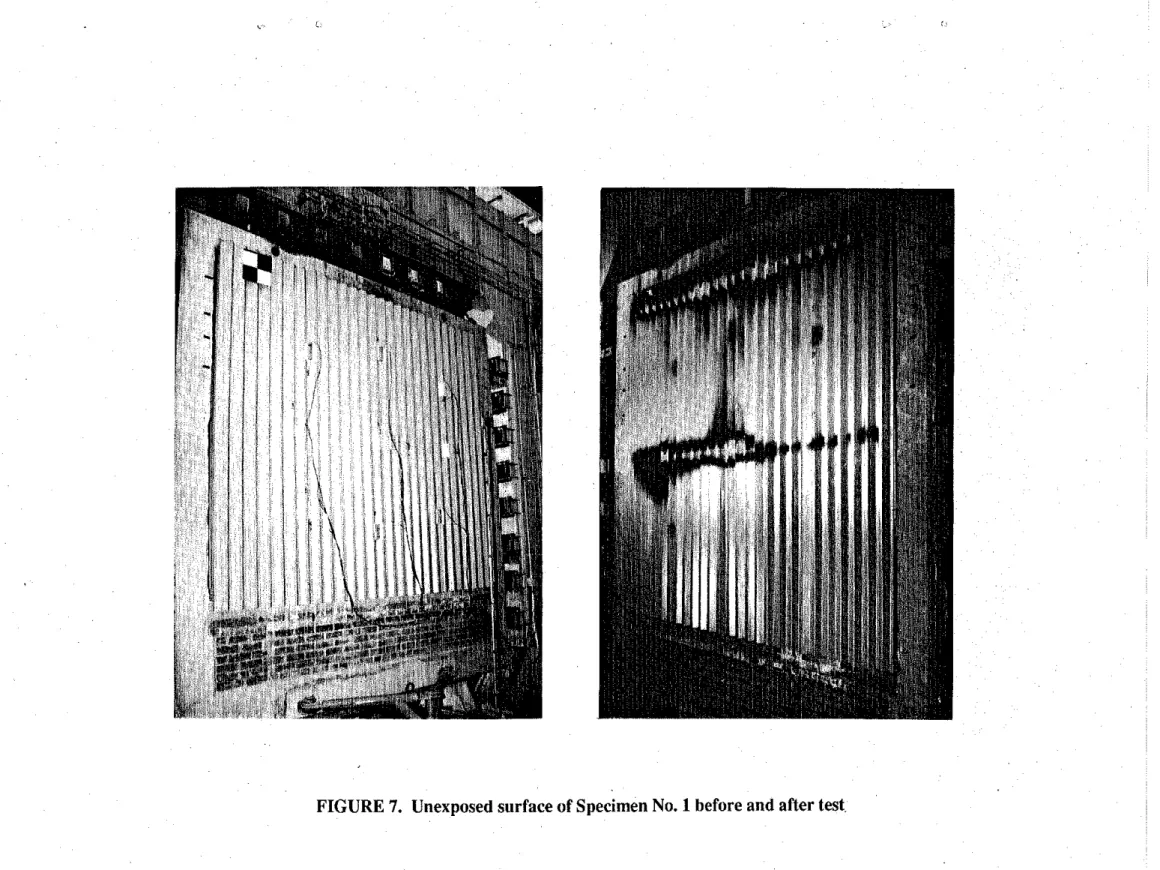
The specimen withstood the two-hour fue test without passage of flames or hot gases.
- Immediately after the fire test was terminated, the furnace was opened and the specimen was subjected to the effects of
a
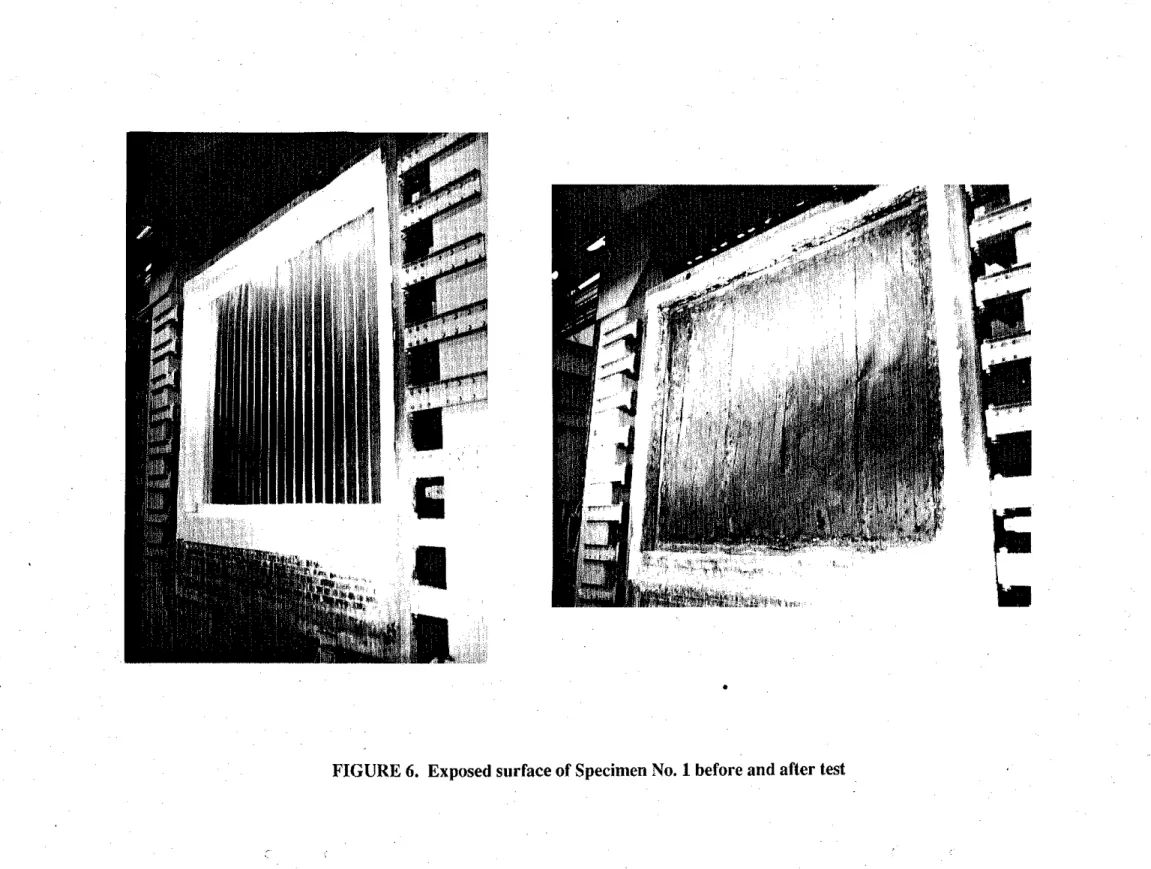
205 kPa hose stream test for180 seconds. The specimen showed no further deterioration as a result of the hose stream test and prevented passage of the hose stream. Figures 6 and 7 show the exposed and unexposed sides of the specimen before and after the fire and hose stream test.
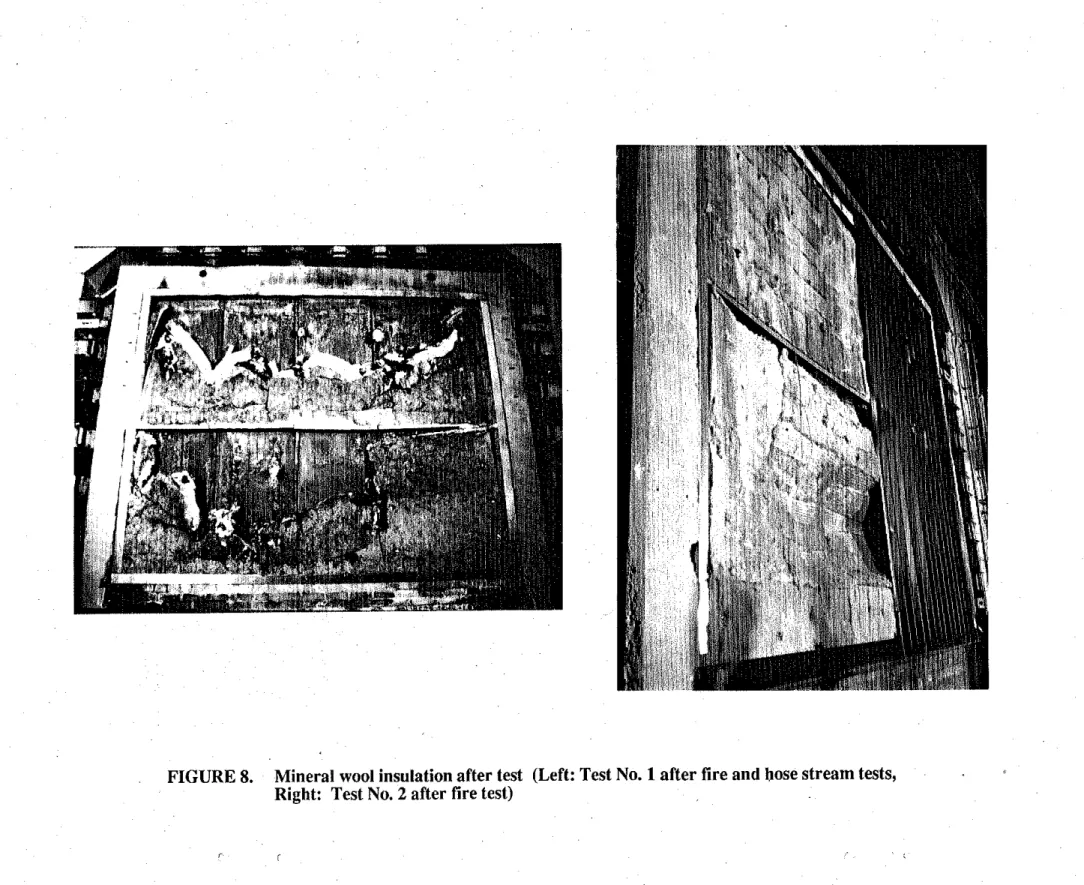
- After the specimen had cooled down, the exterior cladding was removed. As shown in Figure 8, the insulation had sagged considerably. Most of this sagging likely occurred during the hose stream test. The stick pins were still in place, held by the rivets. The mineral wool insulation was charred approximately 125 mm deep.
Test No. 2:
- For the fust 25 min, flaming was observed at the liner joints and perimeter of the specimen on the exposed side, accompanied by light white smoke issuing from the top of the specimen on the unexposed side, indicating combustion of the butyl caulking and tape. As in Test No. 1, the white smoke progressively reduced in density and continued to issue from the top of the specimen for the duration of the test.
- The liier sheets started to warp after
a
few minutes into the test and the joints partially opened.- At 40 min, the paint started to char around
a
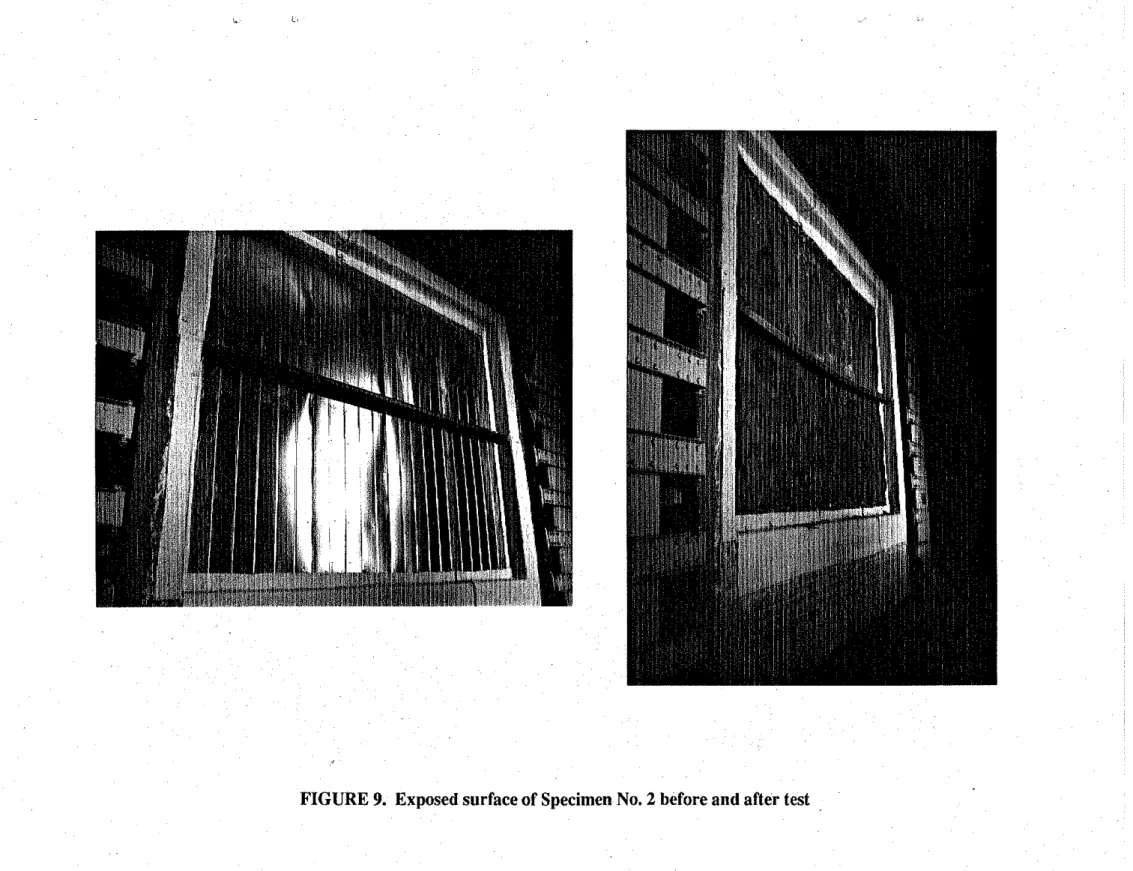
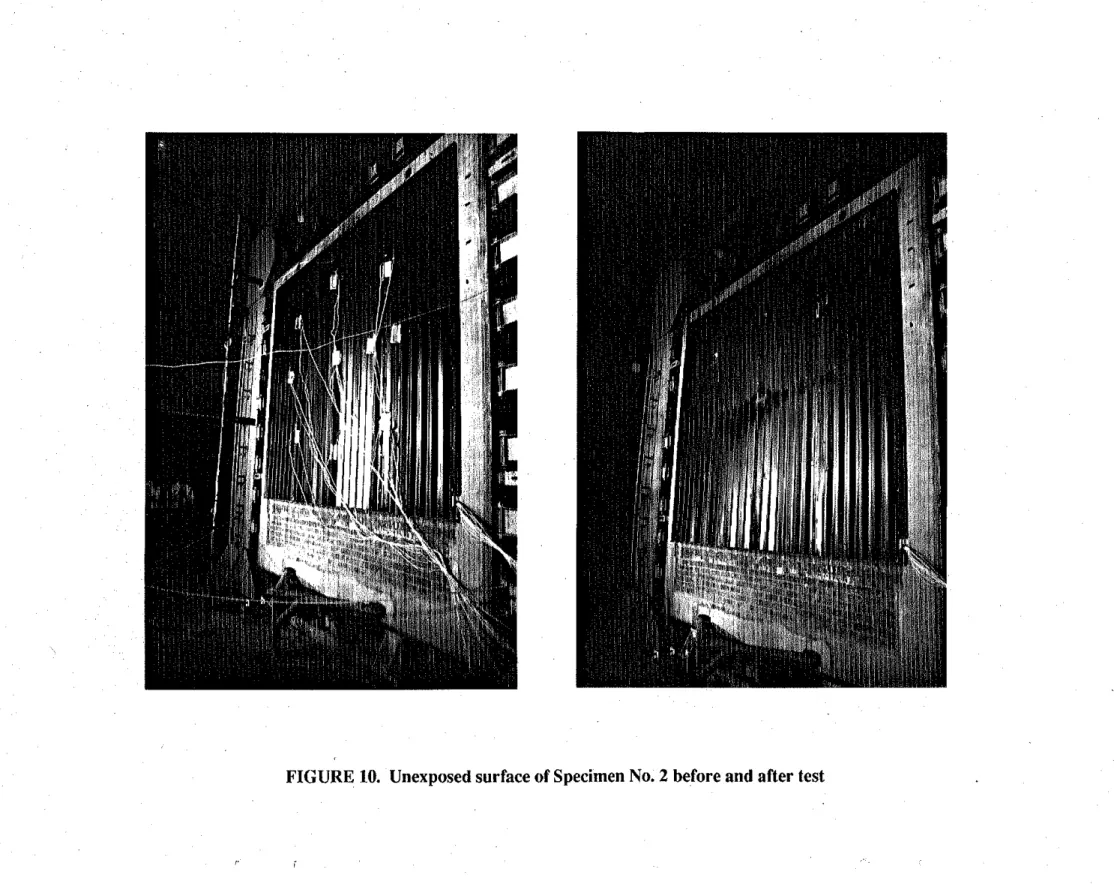
screw on the unexposed side, opposite the 2-bar sub-girt, near thermocouple No. 5. At 65 min, the paint started to char near the top of the specimen on the unexposed side. As the test progressed, the paint continued to char opposite the Z b a r sub-girt and near the top of the specimen.- The structural girt warped during the test, but remained fastened to the thermo- spacer clips and liner sheets. The specimen withstood the two-hour fire test without passage of flames or hot gases. Figures 9 and 10 show the specimen before and after the test. The specimen was not subjected to the hose stream test.
-
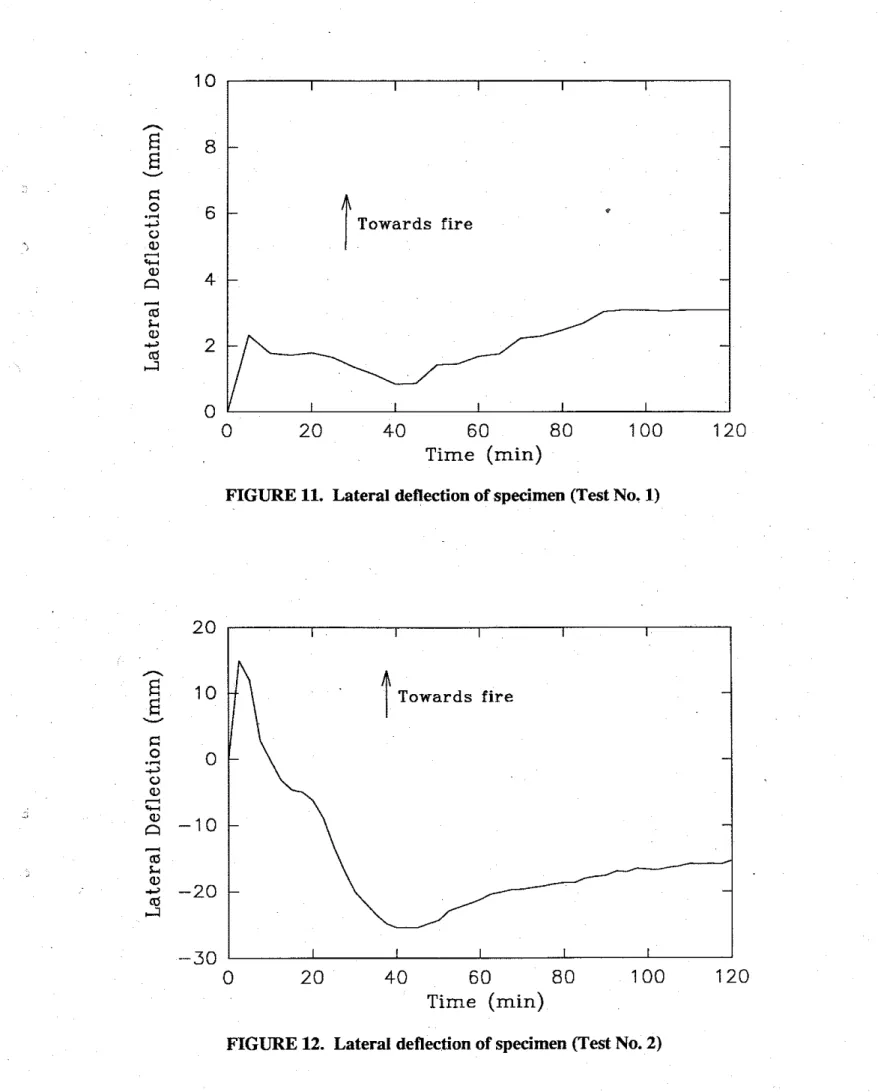
After the wall had cooled down, the exterior cladding was removed. As shown in Figure 8, there was a gap under the Z b a r sub-girt, caused by sagging of the mineral wool batts. This gap was greatest near the thermo-spacer clip at the centre of the wall. The sagging was less significant than in Test No. 1 mainly because the specimen has not been subjected to a hose stream test. The stick pins were still in place, held by the rivets. The mineral wool insulation was charred up to 125 mm deep in some areas.The lateral deflection of both specimens is plotted in Figures 11 and 12. Fire resistance
The average furnace temperature, maximum and average temperatures of the
unexposed surface of the specimen, as well as the temperatures measured on the 2-bar sub- girt are given in Tables 1 to 3 and shown in Figures 13 and 14 for both tests.
The specimen in Test No. 1 failed at,47 min because its unexposed surface
temperature recorded at Thermocouple Nos. 5 and 10, located opposite the 2-bar sub-girt, exceeded the maximum local temperature limit of 204OC (180°C temperature rise). The wall assembly thus achieved a 45 min fire resistance rating.
The specimen in Test No. 2 failed at 43 min because its unexposed surface temperature at Thermocouple No. 5, located opposite the 2-bar sub-girt, exceeded the maximum local temperature limit of 205°C (180°C temperature rise).
Based on the results of these tests, it appears that the type of sub-girt has little influence on the fue resistance of the wall assemblies. It was originally expected that using a thermal 2-bar sub-girt would reduce the heat transmission at the sub-girt level and, therefore, improve the fue resistance of the wall. The tests showed, however, that the fm
resistance is mainly governed by the sagging of the 64 kg/m3 mineral wool batts. Indeed, the ability of the insulation to remain in place appears to be the key factor in the fue
performance of sandwich-type sheet steel walls. The sagging is the result of the combined effect of the evaporation of the binder in the mineral wool batts and the warping of the liner sheets. The rigidity of mineral wool batts decreases as the binder evaporates. Using a larger number of stick pins in Test No. 2 did not apparently help prevent the insulation from sagging.
Equivalent opening factor FEO
The fue resistance ratings of the wall assemblies did not exceed 45 min, based on the unexposed surface temperature rise criterion in the standard test method CAN4-S101- M89. The assemblies, however, met all the other criteria of CAN4-S101-M89 for a 2-hour
fire-exposure period, including prevention of the passage of flames, hot gases and hose stream. The NBCC (Article 3.1.7.2) recognizes this situation and allows the unexposed surface temperature rise criterion to be waived for exterior walls, provided that a correction is made for radiation from the unexposed wall surface. This correction is achieved by translating the excessive unexposed wall surface temperature into an equivalent area of unprotected openings, using the formula given in Article 3.2.3.12 in the NBCC. This formula calculates an equivalent opening factor, FEO, for the wall at the required fue
resistance period, as follows:
where
T,
= average temperature of the unexposed wall surface at the time the required fire resistance rating is reached under test conditions; T, = 892°C for a fue resistance rating of 45 min927°C for a
fm
resistance rating of 1 hour 10IO°C for a fue resistance rating of 2 hoursThe FEO factor expresses the equivalent area of unprotected openings as a fraction or percentage of the wall surface area
As a result of this correction, the limiting distance between the wall and the property l i e (NBCC Tables 3.2.3.A and B) is now governed by
a n
increased area of unprotected openings which includes actual and equivalent unprotected openings.With this special provision, the NBCC thus permits acceptance of an exterior wall which does not meet the required fire resistance rating due to excessive temperature rise on its unexposed surface, but which remains in place for the required fire resistance period.
The FEO values for the wall assemblies described in this report
are
given below:Average unexposed
surface temp.
T,
(OC) FEO45 min 1-h 2-h 45 min 1-h 2-h
Specimen No. 1 - 200 283 - 2.4% 3.5% (45 min FR rating)
Specimen No. 2 127 204 350 1.4% 2.5% 5.6% (No FR rating)
Specimen No.1, for example, which has a 45-min fire resistance rating, will be accepted when a 1-hour fue-rated wall is required provided that an additional area of unprotected openings, equivalent to 2.4% of the wall surface area, is assumed when calculating the reauired limiting distance. Specimen No. 1 is thus eauivalent to a 1-hour fire-ratedwall wiih 2.4% unpr&cted openings.
Unprotected openings, whether actual or equivalent, are not permitted within a limiting distance of 1.2 m. Consequently, the sheet steel wall assemblies must comply with a minimum 1.2 m set-back when the equivalent opening factor provision is applied.
The set-back used in practice will vary with the area of actual unprotected openings in the wall, the building occupancy, as well
as
the area and the height to length ratio of the wall.Measurement of unexposed surface temperature in fire resistance tests
In Test No. 2, two different methods for measuring the unexposed surface
temperature of the specimen were used, namely, thermocouples covered with 10 mm thick refractory fibre pads (as required by CAN4-S101-M89) and exposed thermocouples silver- soldered to the steel sheet. The temperatures measured by these two methods are given in Table 2 and shown in 15. As expected, the thermocouples covered with pads yielded temperatures higher than those measured with the exposed thermocouples. The presence of the pads reduced heat loss from the wall surface and, therefore, the
thermocouples indicated temperatures in excess of those that would be expected on the wall surface. Exposed thermocouples are considered to give a more accurate representation of the true temperature of the surface.
As shown in Figure 15, the temperature difference between the two methods was small (about 15OC) until the surface temperature reached the limit specified in CAN4-S101- M89. It then increased substantially as the surface temperature increased. The difference in the average unexposed surface temperature between the two methods was
as
high as 7S°C (or 27%) after two hours of fire exposure. Consequently, the FEO values, which are based on the wall surface temperature measured by the covered thermocouple method specified in CAN4-S101-M89, are considered to be too conservative.Radiation from unexposed wall surface
Figures 16 and 17 show the results of the heat flux measurements made during the tests at 1.2 m and 0.9 m from the unexposed surface of the specimens. These figures also show the predicted radiation intensity at 1.2 m based on the average unexposed surface temperature of the specimen measured by the covered thermocouples. In the calculation, the surface of the specimens was considered as a black radiator (emissivity=l). For Test No. 2 (Figure 17), predicted radiation intensity values based on temperatures measured with the exposed thermocouples
are
also given.The measured radiation intensity was approximately 66% lower than that predicted using the covered thermocouple readings. As expected, the predicted radiation intensity values based on exposed thermocouple readings were in better agreement with the measured values. In that
case,
the measured radiation intensity was approximately 45% lower than the predicted radiation intensity. The difference between predicted andmeasured heat fluxes can be explained by the non-uniform temperature distribution on the unexposed wall surface and the emissivity of the wall surface.
According to the NBCC, unprotected openings, whether equivalent or actual, are not allowed within
a
limiting distance of 1.2 m. As a result, the sheet steel walls must have a limiting distance of 1.2 m or more if the equivalent opening factor provision is applied, i.e., if the wallsare
used where the required fire resistance rating exceeds their rating. In such situations, no adjacent structures will be located closer than 1.2 m to the wall. The maximum radiant heat fluxes measured at 1.2 m during the tests were approximately 1 kW/m2 and 2 kW/m2 in Test Nos. 1 and 2 respectively, after two hours of fue-exposure. These heat fluxes can be considered as very low since the critical heat flux for pilot ignition of combustible materials is 12 kW/m2
141.
In Test No. 2, the radiationis still well below the critical heat flux. This suggests that the minimum 1.2 m set-back is conservative for the wall assemblies under consideration.
CONCLUSION
The two fire resistance tests described in this report showed that the fxe resistance rating of sandwich-type exterior sheet steel wall assemblies insulated with 152 mm thick, 64 kgIm3 density, mineral wool insulation is limited to 45 min. The fire resistance rating is governed by the unexposed wall surface temperature rise. The type of Zbar sub-girt used to support the assemblies has little influence on their fire resistances. Sagging of the insulation has the determining effect.
The wall assemblies also qualifies where a 1- or 2-hour fire resistance rating is required provided that the distance from the property line is increased according to the equivalent opening factor provision in the NBCC. Radiation measurements made during the tests indicated, however, that the distances required by the NBCC are conservative.
The results of these tests also showed that measuring the unexposed surface temperature of f i e resistance test specimens using the method specified in CAN4-S101- M89 yields temperatures significantly higher than the true surface temperatures.
REFERENCES
1. National Building Code of Canada 1990, National Research Council of Canada, NRCC 30619, 1990.
2. Bardell, K.H., Fire tests on insulated sheet steel walls, Building Research Note No. 219, Institute for Research in Construction, National Research Council of Canada, 1984.
3. Standard Methods of Fire Endurance Tests of Building Construction and Materials - CAN4-SIOI-M89, Underwriters' Laboratories of Canada, 1989.
4. McGuire J.H., F i e and Spatial Separation of Buildings, Fire Technology, Vol. 1, NO. 4, 1965, pp. 278-287.
ACKNOWLEDGEMENTS
The author wishes to tha& R.C. Monette, D.W. Morwick and J.W. MacLaunn from the National Fire Laboratory of the Institute for Research in Construction for performing the tests and assisting in the preparation of this report.
The steel was supplied by VicWest Steel and the mineral wool by the United States Gypsum Company and the Canadian Gypsum Company.
SIDE
VERTICAL SECTION
HORIZONTAL SECTION
SIDE
VERTICAL SECTION
HORIZONTAL SECTION
FIRE SIDE
FIGURE 4. Location of thermocouples on unexposed wall surface and z-bar sub- girt (Test No. 1)
FIRE SIDE
FIGURE 5. Location of thermocouples on unexposed wall surface and z-bar sub- girt (Test No. 2)
FIGURE 8. Mineral wool insulation after test (Left: Test No. 1 after fire and hose stream tests, Right: Test No. 2 after fire test)
I
Towards fireTime (min)
FIGURE 11. Lateral deflection of specimen (Test No. 1)
FIGURE 12. Lateral deflection of specimen (Test No. 2)
I I I I I Towards fire - - - / - I I I I I 2 0 40 6 0 80 100 120
Time (min)
0 20 40 60 8 0 100 120
Time (min)
FIGURE 13. Furnace and unexposed wall surface temperatures (Test No. 1)
0 2 0 40 60 8 0 100 120
Time
(min)600 500
-
U 400 a,5
4 300 Id k a, 200 a, E 100 0 0 20 40 6 0 80 100 120 Time (min)FIGURE 15. Comparison between unexposed wall surface temperatures measured by covered and exposed thermocouples (Test No. 2)
FIGURE 16. Radiation intensity 1.2 m from unexposed wall surface (Test No. 1) 6
-
5 CUE
\ 4 -s
3 V 33
-
W%
2 - a,z
1 0L
- -Calculated radiation based on surface temp.
A: covered thermocouples
B: exposed thermocouples A /
5
,
I I I I I
- - - Calculated radiation based on surface temp.
measured at covered thermocouples -
- - Measured radiation ,
;1.2i~l
,,
-,
,
,
,
,
,
,
,.
, _ - - . - a / / / - / / /.
.
-
/ /I-
Measured radiation 1I
0 20 40 60 80 100 120 Time (min) 0 2 0 40 60 80 100 120 Time (min)FIGURE 17. Radiation intensity 1.2 m and 0.9 m from unexposed wall surface (Test No. 2)
TABLE
1. Furnace and unexposed wall surface temperatures (Test No. 1)* Failure by maximum unexposed surface temperature criterion Time (min) 0 5 10 15 20 25 30 35 40 45 50 55 60 65 70 75 80 85 90 95 100 105 110 115 120 Standard furnace temp. PC) 20 538 704 759 794 821 843 862 878 892 905 916 927 937 946 954 963 971 978 984 991 997 1002 1006 1010 Average furnace temp. (OC) 24 462 704 760 793 822 845 860 880 891 904 91 5 926 935 947 955 964 970 982 982 993 996 1002 1006 1010
Z-bar sub-girt temp. ("C) measured at Thermocouple No.
#11
#I
2 #I3 #I4 24 24 24 24 79 41 83 45 202 99 191 102 329 171 287 163 420 238 377 221 486 298 454 277 542 356 515 330 594 419 565 378 714 531 610 420 794 645 659 433 806 729 703 412 837 826 760 668 817 793 644 459 815 784 601 41 6 815 781 588 396 820 785 596 403 829 793 612 418 834 800 625 436 840 807 636 451 839 809 644 468 841 813 657 485 840 814 669 502 845 820 685 524 852 824 696 540 859 827 706 557Unexposed wall surface temperature ("C) Avg. 24 24 25 26 27 30 36 50 65 89 139 194 200 203 201 204 211 222 233 243 251 260 269 276 283
measured at covered Thermocouple No.
#1 #2 #3 #4 #5 #6 #7 #8 #9 #I0 25 26 25 24 24 24 22 22 22 24 25 26 25 24 24 24 23 22 22 24 26 26 25 27 26 25 23 22 22 27 25 26 25 32 29 27 21 21 21 32 26 27 24 39 34 29 20 20 20 40 27 28 25 50 40 33 21 19 20 49 30 30 26 68 48 37 35 20 20 59 41 42 28 94 65 42 79 26 22 74 57 67 35 1 1 1 101 49 88 50 30 100 76 108 51 134 156 64 80 88 58 135 152 169 85 184 315* 81 82 84 97 318' 228 245 125 220 453 107 88 79 80 575 231 246 167 241 382 120 94 76 71 557 222 260 217 252 352 117 102 73 70 511 213 259 204 264 348 112 116 76 72 489 208 251 200 279 358 112 132 79 76 497 207 249 202 298 372 116 148 84 81 516 209 255 209 321 390 126 164 90 87 540 212 262 216 343 408 137 176 97 93 562 217 270 224 359 425 149 187 104 99 576 221 277 231 378 437 161 195 110 105 585 225 290 240 391 448 174 203 117 110 594 230 299 247 403 458 187 212 123 115 606 234 304 254 411 463 199 218 127 120 619 238 309 262 418 469 211 223 131 124 631
TABLE 2. Furnace and unexposed wall surface temperatures (Test No. 2)
-
Measurement not reliable* Failure by maximum unexposed surface temperature criterion Time (min) 0 5 10 15 20 25 30 35 40 45 50 55 60 65 70 75 80 85 90 95 100 105 110 115 120 Standard furnace temp. PC) 20 538 704 759 794 821 843 862 878 892 905 91 6 927 937 946 9.54 963 971 978 984 991 997 1002 1006 1010 Average furnace temp. ("C) 23 542 697 760 791 815 836 855 873 891 905 916 928 937 943 949 958 964 976 984 988 998 1000 1003 1011
Unexposed wall surface temperature ("C) Avg. 24 26 27 30 34 38 58 87 109 127 145 170 204 237 261 277 288 299 309 318 325 333 340 344 350
Unexposed wall surface temperature ("C)
measured at covered Thermocouple No.
#I #2 #3 #4 #5 #6 #7 #8 KJ #lo 26 26 26 26 25 25
-
24 20 25 27 28 27 28 27 27-
26 20 26 29 29 29 29 33 28-
27 20 27 31 33 32 30 44 32 - 27 20 28 34 37 35 32 54 37-
28 28 30 41 42 44 35 68 43 - 27 26 34 76 82 88 46 109 62-
30 27 43 126 131 124 70 159 90 - 40 35 63 155 160 136 94 195 114-
55 51 93 181 176 144 109 223'128-
67 67 128 213 192 157 127 250 141 86 77 76 158 257 212 181 156 292 163 108 89 83 188 299 237 215 197 318 227 137 104 93 260 331 256 243 240 345 269 162 125 110 351 354 281 261 277 387 287 181 146 135 370 368 299 272 298 414 301 196 164 164 359 378 312 278 312 438 308 206 178 190 347 387 323 281 325 459 314 216 190 209 344 397 333 283 336 477 321 224 201 224 353 406 341 284 346 490 327 235 210 237 362 414 347 286 355 500 334 244 219 248 374 420 354 288 363 514 340 251 227 258 384 427 361 290 373 525 347 258 235 265 386 433 366 292 381 536 352 264 241 272 372 436 371 294 387 544 360 269 245 278 385 AVQ. 28 30 31 34 35 41 65 89 103 115 131 153 174 192 205 216 224 234 242 249 254 260 266 271 274measured at exposed Thermocouple No.
#II #12 #13 #I4 #I5 #I6 #I7 #I8 #I9 28 28 29 28 28 29 30 28 28 29 30 30 29 32 30 31 29 29 30 33 31 30 37 31 31 29 30 32 38 34 31 45 34 31 29 29 34 39 36 30 51 37 29 28 27 44 44 64 32 65 48 26 26 25 85 93 104 46 102 73 31 29 26 124 136 114 69 150 100 43 38 31 137 147 119 84 180 117 54 50 42 158 154 125 94 206 133 58 56 52 194 165 132 113 238 152 67 63 59 242 181 145 142 271 179 83 73 65 281 201 166 174 280 202 101 86 75 310 219 179 206 294 214 115 100 88 328 233 184 232 301 226 125 111 105 341 240 188 247 312 237 136 121 123 350 248 190 256 323 246 142 127 139 359 256 193 267 334 259 150 135 151 367 264 195 276 345 273 157 142 162 372 269 198 286 352 282 167 149 171 375 273 201 292 358 288 172 1.54 177 381 277 204 299 368 297 176 159 183 384 282 208 305 380 303 178 164 189 389 288 210 313 388 308 186 169 193 393 290 212 316 396 311 185 172 197
TABLE 3. 2-bar subgirt temperatures (Test No. 2) Time (min) 0 5 10 15 20 25 30 35 40 45 50 55 60 65 70 75 80 85 90 95 100 105 110 115 120 Average furnace temp.(OC) 23 542 697 760 791 815 836 855 873 891 905 916 928 937 943 949 958 964 976 984 988 998 1000 1003 1011
2-bar sub-girt temperatures ("C) measured at Thermocouple No.
#20 #21 #22 #23 #24 #25 #26 #27 #28 22 23 24 23 21 23 23 22 22 23 24 453 435 143 80 45 22 23 30 27 656 657 292 196 125 26 25 57 41 734 729 415 277 193 43 35 1 25 78 768 761 523 343 240 82 59 215 138 795 792 601 407 290 152 105 312 208 825 817 672 512 397 233 168 409 287 839 837 719 581 478 323 241 503 360 854 852 749 609 511 419 318 567 413 867 865 766 633 544 527 401 622 465 879 876 782 650 568 587 461 675 532 879 880 778 652 587 629 502 704 584 876 877 752 635 576 699 578 718 614 867 864 724 617 573 745 623 723 625 858 851 699 608 580 742 613 719 625 862 854 695 615 593 702 571 718 628 869 860 700 625 607 671 536 724 636 873 861 708 636 621 652 518 730 643 883 869 714 646 634 646 514 732 648 883 874 717 652 641 644 516 733 652 889 877 720 656 646 644 519 737 658 897 884 727 665 657 647 525 740 663 899 888 732 672 664 648 530 743 669 899 888 736 679 672 650 534 744 672 906 896 739 684 678 650 538