Publisher’s version / Version de l'éditeur:
Proceedings of the 16th International Conference on Port and Ocean Engineering under Arctic Conditions POAC’01, 1, pp. 319-328, 2001-08-12
READ THESE TERMS AND CONDITIONS CAREFULLY BEFORE USING THIS WEBSITE.
https://nrc-publications.canada.ca/eng/copyright
Vous avez des questions? Nous pouvons vous aider. Pour communiquer directement avec un auteur, consultez la première page de la revue dans laquelle son article a été publié afin de trouver ses coordonnées. Si vous n’arrivez pas à les repérer, communiquez avec nous à [email protected].
Questions? Contact the NRC Publications Archive team at
[email protected]. If you wish to email the authors directly, please see the first page of the publication for their contact information.
NRC Publications Archive
Archives des publications du CNRC
This publication could be one of several versions: author’s original, accepted manuscript or the publisher’s version. / La version de cette publication peut être l’une des suivantes : la version prépublication de l’auteur, la version acceptée du manuscrit ou la version de l’éditeur.
Access and use of this website and the material on it are subject to the Terms and Conditions set forth at Response of Confederation Bridge to Ice Forces: 2000 Winter Season
Kubat, Ivana; Timco, Garry
https://publications-cnrc.canada.ca/fra/droits
L’accès à ce site Web et l’utilisation de son contenu sont assujettis aux conditions présentées dans le site
LISEZ CES CONDITIONS ATTENTIVEMENT AVANT D’UTILISER CE SITE WEB.
NRC Publications Record / Notice d'Archives des publications de CNRC: https://nrc-publications.canada.ca/eng/view/object/?id=a7a4e908-6670-4eab-90d4-147ed4c88a3d https://publications-cnrc.canada.ca/fra/voir/objet/?id=a7a4e908-6670-4eab-90d4-147ed4c88a3d
RESPONSE OF CONFEDERATION BRIDGE TO ICE FORCES: 2000 WINTER SEASON
I.Kubat and R.Frederking Canadian Hydraulics Centre, Ottawa, ON, K1A 0R6, Canada
ABSTRACT
Tilt at two piers of the Confederation Bridge was measured from January to April 2000. Addit ionally, ice drift, current and ice thickness were measured in a collaborative effort with the Bedford Institute of Oceanography. Time- lapse video records of ice conditions were obtained from a traffic observation camera on bridge. The response of the piers to wind loads was used as a first order means to determine foundation stiffness and convert tilt to ice force. Typical tilt-time records for a two-day period in March are presented. A maximum ice load of 0.9 MN was obtained during a period when ice rid ges with keels up to 4 m deep were measured.
INTRODUCTION
The Confederation Bridge is a 13 km long bridge that spans the Northumberland Strait, connecting Prince Edward Island and New Brunswick in Canada. The duration of the ice season in the area is about 90 days long with level ice thickness reaching up to 1 m. The Strait is subject to reversing tidal currents that result in about 3000 km of total ice movement past the bridge each winter. These dynamic ice conditions produce ice ridges and numerous ice loading events on the piers supporting the bridge. The bridge is an ideal location for studying and measuring ice forces.
Because of this combination of environmental conditions and the uniqueness of the structure, an extensive monitoring and research program is being carried out under the auspices of a Natural Sciences and Engineering Research Council (NSERC) Collaborative Research and Development (R&D) Grant (Cheung et al, 1997). In addition to various aspects of bridge performance, that project has been measuring ice forces on two piers towards the New
Brunswick end of the bridge since 1997 (Brown et al, 2001). In 1999 a complimentary program
POAC ‘0 1
Ottawa, Canada
Proceedings of the 16 International Conference onth
Port and Ocean Engineering under Arctic Conditions POAC’01 August 12-17, 2001 Ottawa, Ontario, Canada
of ice force measurements was initiated on two piers near the central navigation span of the bridge (K ubat and Frederking, 2000). Thus a total of 4 piers are being used to measure response to ice loading. In the NSERC project one of the piers was loaded with a ship in order to calibrate foundation stiffness and provide a means of relating pier tilt to ice load (Bruce et al, 2001). This paper presents an alternate means for calibrating the foundation stiffness and some results from measurements made in the winter 2000 on the two piers adjacent to the navigation span.
MEASUREMENT PROGRAM
Measurement of pier response to ice loading for the winter of 2000 was resumed in January and continued until the middle of April. The same two piers instrumented in 1999, P23 and P24, were used. These piers are close to the navigation span, which is between piers P21 and P22. The two piers instrumented by the NSERC project in 1997 are closer to the New
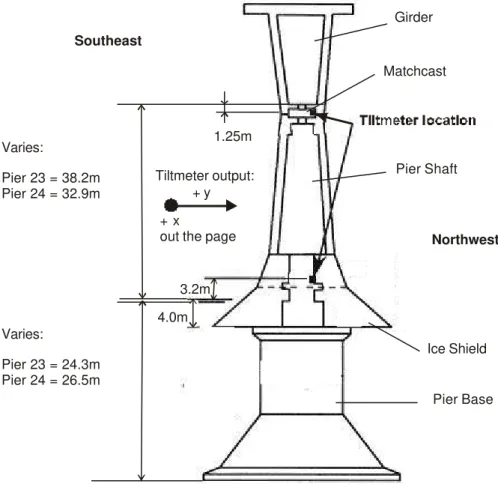
Brunswick end of the bridge at P31 and P32 (1.75 km from P24). Having two sets of piers provides an opportunity to see if there are systematic differences in ice loads depending on location in the Strait. Two tiltmeters were installed inside each pier on the upstream side (northwest), one at the bottom of the pier and one at the top of the pier as shown in Figure 1.
The X-axis tilts, Y-axis tilts, temperature of lower level of the pier, and battery voltage were measured. The X-axis tilts are in the longitudinal direction of the bridge (northeast –
Girder Matchcast Pier Shaft Ice Shield Pier Base Varies: Pier 23 = 38.2m Pier 24 = 32.9m Varies: Pier 23 = 24.3m Pier 24 = 26.5m 4.0m 3.2m 1.25m Northwest Southeast + x
out the page + y Tiltmeter output:
southwest) and are primarily in response to the thermal expansion or contraction of the
spans.The Y-tilts are perpendicular to the longitudinal axis of the bridge and are in response to ice and wind loading. The readings of tilts were taken every second and a 20-second average was recorded every 20 second. The temperature and battery voltage readings were stored every 3rd hour. The detailed description of the instrumentation and of the installation of tiltmeters was described by Kubat and Frederking (2000).
This season some video records of ice conditions were also obtained. The Confederation Bridge Control Centre uses a number of video cameras to monitor conditions and traffic on the bridge. The signal from a camera above P23 was recorded on a time- lapse video recorder. The videos were useful in determining the presence of ice, direction and speed of drift, any
occurrence of jamming and ice failure behaviour on piers.
As in the previous year, the project involved an extensive collaboration with the
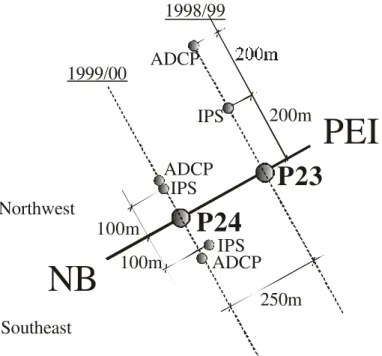
Department of Fisheries and Oceans through the Bedford Institute of Oceanography (BIO), and Public Works and Government Services Canada (PWGSC). BIO was conducting a program to investigate the ice conditions in Northumberland St. and the affect of the Bridge on them. As part of this study, they have carried out helicopter surveys of ice conditions and measured the ice thickness and drift velocity using an Ice Profiling Sonar (IPS) and Acoustic Doppler Current Profiler (ADCP), respectively. In the previous year the IPS and ADCP were located 200 m and 400 m, respective ly, northwest from pier P23. In 2000, the IPS and ADCP were deployed on either side of the pier P24 to reflect the ice conditions on both sides of the bridge pier. Pier P24 was selected for Winter 2000, because its foundation is about 50% softer than that of pier P23, which resulted into higher tilt response to loads induced by ice and wind. Also, the instruments were located closer to the pier: IPSs were about 100 meters from the pier along the main channel axis and ADCPs were few meters further (Figure 2). The detailed description of these
instruments and data processing is presented in the paper by Belliveau et al. (2001).
PEI
NB
P24
P23
Northwest Southeast 200m 100m 100m 250m 1998/99 1999/00 ADCP IPS ADCP ADCP IPS IPSDATA ANALYSIS
This paper presents forces determined for some typical ice loading events. The response of the piers to wind loads was used as a means to determine foundation stiffness and convert tilt to ice force. Since the tiltmeters were installed in January, there was no guarantee that there was no ice loading on the pier during the installation. Therefore the baseline for tilts was set after obtaining all data with the knowledge of conditions where there was no ice acting on the pier. The same correction factors for wind induced tilt as those in the previous year were used. The detailed description of the period selection with no ice loading on the pier is given in paper by Kubat and Frederking (2000).
Calibration of Foundation Stiffness
The instrumentation of the piers with tiltmeters provides a means of measuring their response to ice and wind loads. To convert the measured tilts to forces, requires a knowledge of the stiffness of the foundation material underlying the pier bases. In the case of pier P31, an actual calibration test was done using an icebreaker to pull on the pier with a known force (Bruce et al, 2001). An alternative approach is to use the wind force as a means of determining
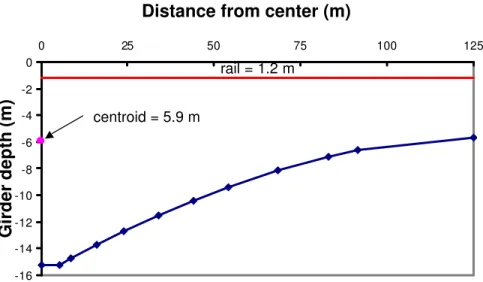
foundation stiffness. Because of the long spans of the bridge, 250 m, the girder is necessarily deep, presenting a large area of the bridge to wind action. The girder is 14 m deep at the pier and reduces to a depth of 4.5 m at mid span (see Figure 3).
-16 -14 -12 -10 -8 -6 -4 -2 0 0 25 50 75 100 125
Distance from center (m)
Girder depth (m)
centroid = 5.9 m
rail = 1.2 m
Figure 3 Girder Cross Section
Estimating the guard rail to be 1.2 m high, the cross sectional area of the girder plus rail is calculated to be 2340 m2. Wind force is given by the following equation
Fw = A CD ?a V2/2 (1)
where A = cross-sectional area, CD = drag coefficient (assumed = 1), ?a = density of air (1.3 kg/m3) and V = wind velocity.
The wind force acts on the centroid of the girder area (9.3 m above the base of the girder) producing a lateral force and moment on the top of the pier, causing the pier shaft and pier base to bend, as well as tilting of the pier on the foundation. The relative bending of the pier shaft and base and tilt about the foundation is a function of the length and diameter of the shaft and base. These relative tilts can be calculated, knowing the dimensions of the piers. The complexity of that calculation, however, is beyond the scope of this paper. As a first order approximation, the amount of tilt measured at the lower tiltmeter will be taken to be a function of the moment applied to the pier.
?lower = k M (2)
where k is calibration factor and M is the moment about the base of the pier from wind and ice actions. For the case of only wind acting on the pier
M = L Fw (3)
where L is the distance from the pier base to the point of wind load application and Fw is the wind load as determined from equation (1). A wind loading event with no ice loading on piers P23 and P24 can be used to determine the calibration factor, k, for each pier. For the case of only ice acting on the pier, moment M is a function of the ice force, Fi, and its moment arm, a (distance from pier base to waterline). Substituting the moment due to ice action into equatio n (2) the ice force is given by the following expression
FI = ?lower / k a (4)
A wind loading event on March 16, 2000 was used to obtain a calibration of pier foundation stiffness. Figure 4 is a plot of the normal wind velocity (m/s) and the tilt measured by the lower tiltmeters on piers P23 and P24.
-35 -30 -25 -20 -15 -10 -5 0 5 21:00 21:05 21:10 21:15 21:20 21:25 21:30 21:35 21:40
Time, March 16, 2000 ( UTC, hr:min)
Tilt (µ Rad) -14 -12 -10 -8 -6 -4 -2 0 Wind Velocity (m/s) P23 - Bottom Y P24 - Bottom Y Wind normal to bridge alignment
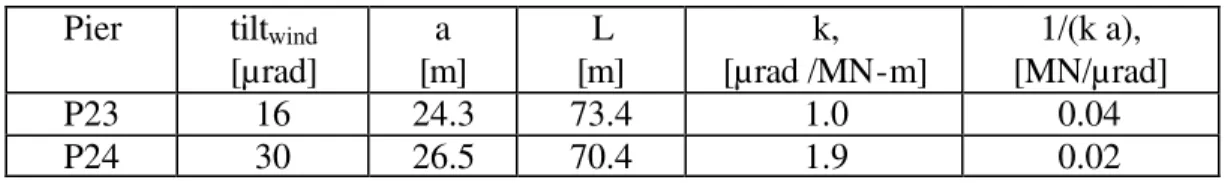
The average maximum wind speed during the event is taken to be 12 m/s and when substituted into equations (1) gives a force of 0.22 MN. The corresponding average tilts on piers P23 and P24 are 16 and 30 µrad, respectively. Taking into account pier lengths, L, and load action
length, a, factors for converting measured tilt at the lower level to ice force can be determined, as presented in Table 1.
Table 1 Calibration factors for converting ice induced pier tilt to ice force
Pier tiltwind [µrad] a [m] L [m] k, [µrad /MN-m] 1/(k a), [MN/µrad] P23 16 24.3 73.4 1.0 0.04 P24 30 26.5 70.4 1.9 0.02
Cheung et al (1997) indicated that an approximate calibration factor for converting tilts measured at the lower level for piers P31 and P32 was 0.03 MN/ µrad, which is in a good agreement with calibration factors we derived.
Sign Convention
A decrease of the tiltmeter output indicates ice impact from the northwest side of the pier. A positive current measured by the ADCP located on the northwest side of the pier is a current to the northwest. On the other hand, a northwest wind blows from the northwest. For wind, the sign convention is that the normal component from the northwest is negative, so that an increasing wind from the northwest will produce an increasing negative tilt.
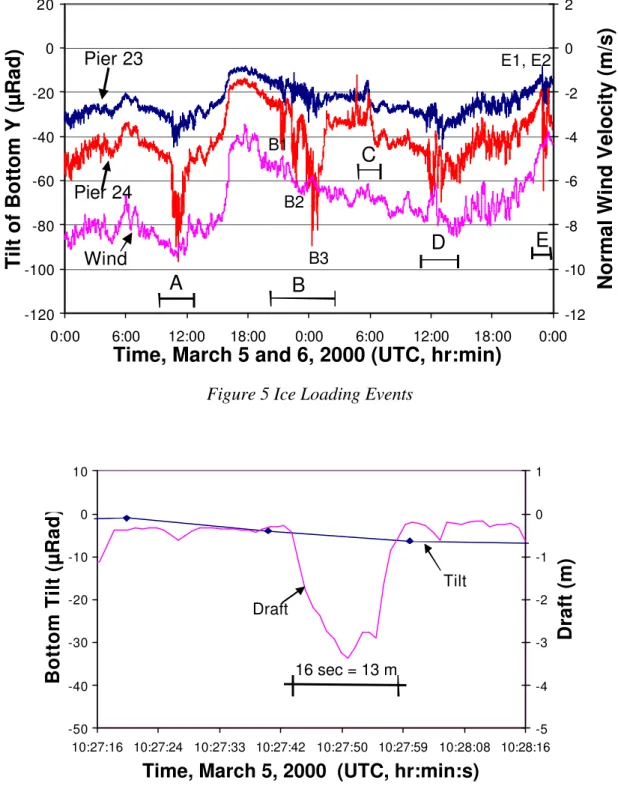
Ice Loading Events
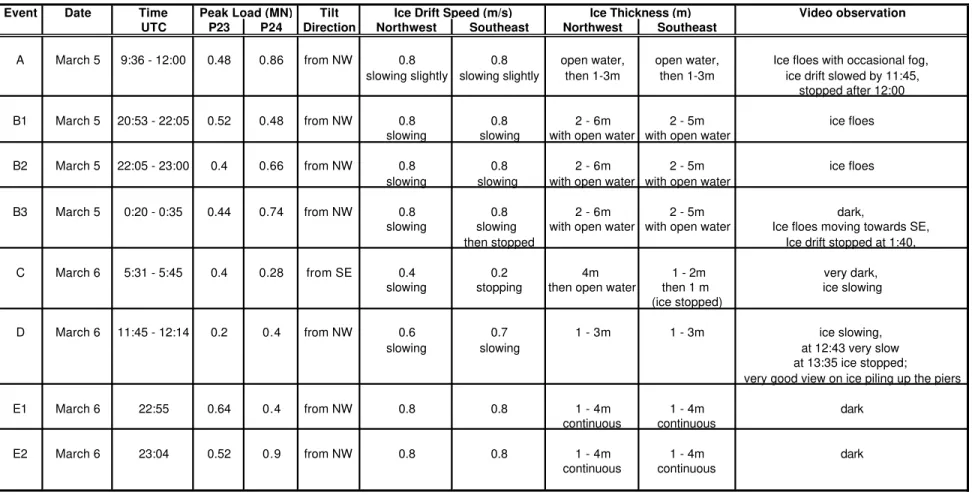
Eight typical ice loading events are presented in this paper. These events occurred during the period between March 5 and March 7, 2000 (see Figure 5). Note that tilt values have already been corrected for wind effect. For each event the following properties were analyzed: pier tilt induced by ice loading, pier tilt induced by wind loading, ice speed, ice thickness, ice profile, and the current speed. The summary of these events is shown in Table 2. Even though the instruments for measuring the current velocity and keel depth were located closer to the pier than in the previous year, they were still far enough away to have several minutes difference between ice keel draft and tilt response of the pier. Figure 6 shows the typical profile of an ice ridge keel recorded over 1 minute period. Note that in this case the ice keel draft output was shifted to clear the difference between ice keel draft and tilt response of the pier.
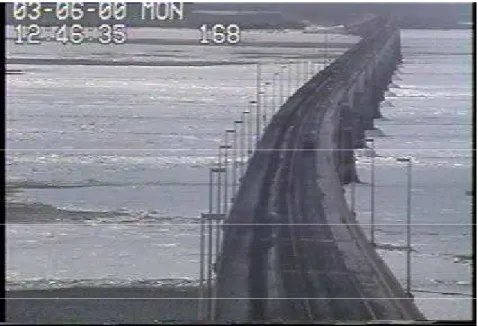
Knowing the speed at which the ice was moving, the keel width could be estimated. In this case the ice velocity is 0.8 m/s so the keel width is about 13 m. Figure 7 represents a typical picture from the video record of ice failing against the bridge piers. Two of the events are
-120 -100 -80 -60 -40 -20 0 20 0:00 6:00 12:00 18:00 0:00 6:00 12:00 18:00 0:00
Time, March 5 and 6, 2000 (UTC, hr:min)
Tilt of Bottom Y (µ
Rad)
-12 -10 -8 -6 -4 -2 0 2Normal Wind Velocity (m/s)
A
B
B1 B2 B3C
D
E
Pier 23 Pier 24 Wind E1, E2Figure 5 Ice Loading Events
-50 -40 -30 -20 -10 0 10 10:27:16 10:27:24 10:27:33 10:27:42 10:27:50 10:27:59 10:28:08 10:28:16 Time, March 5, 2000 (UTC, hr:min:s)
Bottom Tilt (µ Rad) -5 -4 -3 -2 -1 0 1 Draft (m) Tilt Draft 16 sec = 13 m
Table 2 Ice Loading Events Summary
Event Date Time Peak Load (MN) Tilt Ice Drift Speed (m/s) Ice Thickness (m) Video observation UTC P23 P24 Direction Northwest Southeast Northwest Southeast
A March 5 9:36 - 12:00 0.48 0.86 from NW 0.8 0.8 open water, open water, Ice floes with occasional fog, slowing slightly slowing slightly then 1-3m then 1-3m ice drift slowed by 11:45,
stopped after 12:00
B1 March 5 20:53 - 22:05 0.52 0.48 from NW 0.8 0.8 2 - 6m 2 - 5m ice floes
slowing slowing with open water with open water
B2 March 5 22:05 - 23:00 0.4 0.66 from NW 0.8 0.8 2 - 6m 2 - 5m ice floes
slowing slowing with open water with open water
B3 March 5 0:20 - 0:35 0.44 0.74 from NW 0.8 0.8 2 - 6m 2 - 5m dark,
slowing slowing with open water with open water Ice floes moving towards SE, then stopped Ice drift stopped at 1:40,
C March 6 5:31 - 5:45 0.4 0.28 from SE 0.4 0.2 4m 1 - 2m very dark,
slowing stopping then open water then 1 m ice slowing (ice stopped)
D March 6 11:45 - 12:14 0.2 0.4 from NW 0.6 0.7 1 - 3m 1 - 3m ice slowing,
slowing slowing at 12:43 very slow
at 13:35 ice stopped; very good view on ice piling up the piers
E1 March 6 22:55 0.64 0.4 from NW 0.8 0.8 1 - 4m 1 - 4m dark
continuous continuous
E2 March 6 23:04 0.52 0.9 from NW 0.8 0.8 1 - 4m 1 - 4m dark
Figure 7 Ice piling on the bridge piers
Event B2 lasted for 1 hour from 22:05 to 23:00 UTC on March 5th. The peak load
recorded at pier P23 was 0.4 MN and at the pier P24 it was 0.66 MN. The ice was moving from the northwest with speed 0.8 m/s. The speed was slowing during the event. The same speed was recorded by the ADCP on the southeast side of the pier also slowing and then coming to a stop at the end of the event. The IPS on the northwest side indicated that there was ice with keel depth 2-6m (ridges) and also open water during the event. The IPS on the southeast side indicated that the maximum keel depth of the ice was up to 2-5m with open water. Since the ice was moving from the northwest, the ice floe properties measured by IPS on the northwest side of the pier represent the ice that hit the pier 2 minutes after the keel draft measurements were taken (based on the speed of ice) and on the southeast side the keel depth of the floe that hit the pier 2 minutes before the tilt measurements were taken. According to video records there were ice floes around the piers moving towards the southeast. The ice drift stopped at 1:40 UTC on March 6.
Event C lasted for 15 minutes from 5:31 to 5:45 UTC on March 6th. The peak load at pier
P23 was 0.4 MN and at pier P24 it was 0.28 MN. The ADCP located on the northwest side indicated that the ice was moving from southeast with speed 0.4 m/s and then slowing. The ADCP located on the southeast side of the pier indicated that the ice was moving with speed 0.2m/s at the beginning of the event and then stopped. The IPS on the southeast side indicated that the keel depth of the ice was up to 4 m at the beginning of the event and then changed to open water, the IPS on the northwest side indicated that the keel depth of ice was 1-2 m at the beginning of the event and then 1m. The ice was moving from the southeast during this event. The thickness of the ice floe obtained from the IPS on the northwest side represents the keel depth of the ice 100 m away from the pier. Therefore the keel depth of the floe measured was the keel depth of the floe that hit the pier 4 minutes before that for which the tilts were measured by the tiltmeters at that time. The keel depth obtained from IPS on the southeast side of the bridge represents the keel depth of the ice floe that would hit the pier 8 minutes later. According to
video records there were ice floes moving towards the northwest with decreasing speed. The visibility, however, was not very good since it was dark.
SUMMARY AND CONCLUSION
During this monitoring program the magnitude of the pier tilt was recorded from January to April 2000. Additional information on wind, ice and current drift, keel depth, and video records were obtained for analyzing the ice loads on the piers. A method was derived to
determine foundation stiffness and convert tilt to ice force. Factors for converting measured tilt at the lower level of the pier to ice force are 0.04 MN/µrad and 0.02 MN/µrad for pier P23 and pier P24, respectively. A maximum ice load of 0.9 MN was obtained during a period when ice ridges with keels up to 4 m deep were measured. The results obtained here are not in sufficient detail to make a direct comparison of ice loading and ice feature size. Closer positioning of the IPS at the piers would remove some uncertainty.
ACKNOWLEDGEMENTS
The assistance of Murray Scotney, Simon Prinsenberg, and Helen Hayden of the Bedford Institute of Oceanography for the recovery of tilt data from the bridge and for collection of oceanographic data is greatly appreciated. The assistance of Jim Bruce of IFN Engineering is also appreciated. The collaboration of the Public Works and Government Services Canada is gratefully acknowledged. Funding support from the Program of Energy Research and
Development facilitated this work.
REFERENCES
Belliveau, D.J., Hayden, H., and Prinsenberg, S., 2001, Ice Drift and Draft Measurement from Moorings at the Confederation Bridge, Proceeding of the 16th International Conference on Port and Ocean Polar Engineering under Arctic Conditions, Ottawa, Ontario, August 12-17
Brown, T.G., 2001, Four Years of Ice Force observation on the Confederation Bridge,
Proceeding of the 16th International Conference on Port and Ocean Polar Engineering under
Arctic Conditions, Ottawa, Ontario, August 12-17
Bruce J.R., and Brown, T.G., 2001, Operationg an Ice Force Monitoring System on the
Confederation Bridge, Proceeding of the 16th International Conference on Port and Ocean Polar Engineering under Arctic Conditions, Ottawa, Ontario, August 12-17
Cheung, M.S., Tadros, G.S., Brown, T., Dilger, W.H., Ghali, A. and Lau, D.T., 1997, Field Monitoring and Research on Performance of the Confederation Bridge, Canadian Journal of
Civil Engineering, NRC, 24: 951-962.
Kubat, I., Frederking R., and Hayakawa, T., 2000, Response of the Confederation Bridge to Ice Action, CSCE 2000 Conference, 8pp.London, Ontario, Canada