HAL Id: hal-02470111
https://hal.archives-ouvertes.fr/hal-02470111
Submitted on 30 Oct 2020
HAL is a multi-disciplinary open access
archive for the deposit and dissemination of
sci-entific research documents, whether they are
pub-lished or not. The documents may come from
teaching and research institutions in France or
L’archive ouverte pluridisciplinaire HAL, est
destinée au dépôt et à la diffusion de documents
scientifiques de niveau recherche, publiés ou non,
émanant des établissements d’enseignement et de
recherche français ou étrangers, des laboratoires
Curves 0–50,000 Years cal BP
Paula Reimer, Edouard Bard, Alex Bayliss, J Warren Beck, Paul Blackwell,
Christopher Bronk Ramsey, Caitlin Buck, Hai Cheng, R Lawrence Edwards,
Michael Friedrich, et al.
To cite this version:
Paula Reimer, Edouard Bard, Alex Bayliss, J Warren Beck, Paul Blackwell, et al.. IntCal13 and
Marine13 Radiocarbon Age Calibration Curves 0–50,000 Years cal BP. Radiocarbon, University of
Arizona, 2013, 55 (4), pp.1869-1887. �10.2458/azu_js_rc.55.16947�. �hal-02470111�
INTCAL13 AND MARINE13 RADIOCARBON AGE CALIBRATION CURVES 0–50,000 YEARS CAL BP
Paula J Reimer1,2 • Edouard Bard3 • Alex Bayliss4 • J Warren Beck5 • Paul G Blackwell6 • Christopher Bronk Ramsey7 • Caitlin E Buck6 • Hai Cheng8,9‡ • R Lawrence Edwards8 • Michael Friedrich10,11 • Pieter M Grootes12 • Thomas P Guilderson13,14 • Haflidi Haflidason15† • Irka Hajdas16 • Christine Hatté17† • Timothy J Heaton6 • Dirk L Hoffmann18‡ • Alan G Hogg19 • Konrad A Hughen20 • K Felix Kaiser21,22* • Bernd Kromer11 • Sturt W Manning23 • Mu Niu6 • Ron W Reimer1 • David A Richards24 • E Marian Scott25† • John R Southon26 • Richard A Staff7‡• Christian S M Turney27 • Johannes van der Plicht28,29
114CHRONO Centre for Climate, the Environment and Chronology, School of Geography, Archaeology and Palaeoecology, Queen’s University Belfast BT7 1NN, United Kingdom.
2Corresponding author. Email:p.j.reimer@qub.ac.uk.
3CEREGE, Aix-Marseille University, CNRS, IRD, Collège de France, Technopole de l’Arbois BP 80, 13545 Aix en Provence Cedex 4, France.
4English Heritage, 1 Waterhouse Square, 138-142 Holborn, London EC1N 2ST, United Kingdom. 5Department of Physics, University of Arizona, Tucson, Arizona 85721, USA.
6School of Mathematics and Statistics, University of Sheffield, Sheffield S3 7RH, United Kingdom.
7Research Laboratory for Archaeology and the History of Art, University of Oxford, Dyson Perrins Building, South Parks Road, Oxford OX1 3QY, United Kingdom.
8Department of Earth Sciences, University of Minnesota, Minneapolis, Minnesota 55455-0231, USA. 9Institute of Global Environmental Change, Xi’an Jiaotong University, Xi’an 710049, China. 10Institute of Botany (210), Hohenheim University, D-70593 Stuttgart, Germany.
11Heidelberger Akademie der Wissenschaften, Im Neuenheimer Feld 229, D-69120 Heidelberg, Germany 12Institute for Ecosystem Research, Christian-Albrechts-Universität zu Kiel 24098, Germany.
13Center for Accelerator Mass Spectrometry L-397, Lawrence Livermore National Laboratory, Livermore, California 94550, USA.
14Ocean Sciences Department, University of California–Santa Cruz, Santa Cruz, California 95064, USA. 15Department of Earth Science, University ofBergen, N-5007 Bergen, Norway.
16Labor für Ionenstrahlphysik, ETH, 8092 Zurich, Switzerland.
17Laboratoire des Sciences du Climat et de l’Environnement, UMR8212 CEA-CNRS-UVSQ, Domaine du CNRS, F-91198 Gif-sur-Yvette, France.
18Centro Nacional de Investigación sobre la Evolución Humana CENIEH, Burgos 09002, Spain. 19Radiocarbon Dating Laboratory, University of Waikato, Private Bag 3105, Hamilton, New Zealand.
20Department of Marine Chemistry & Geochemistry, Woods Hole Oceanographic Institution, Woods Hole, Massachusetts 02543, USA.
21Swiss Federal Institute for Forest, Snow and Landscape Research WSL, Zurcherstr. 111, 8903 Birmensdorf, Switzerland. 22Department of Geography, University of Zurich-Irchel, 8057 Zurich, Switzerland.
23Malcolm and Carolyn Wiener Laboratory for Aegean and Near Eastern Dendrochronology, Cornell Tree Ring Laboratory, Cornell University, Ithaca, New York 14853, USA.
24School of Geographical Sciences, University of Bristol, Bristol BS8 1SS, United Kingdom. 25School of Mathematics and Statistics, University of Glasgow, Glasgow G12 8QQ, Scotland. 26Department of Earth System Science, University of California–Irvine, Irvine, California 92697, USA.
27Climate Change Research Centre, School of Biological, Earth and Environmental Sciences, University of New South Wales, Sydney, NSW 2052, Australia.
28Centrum voor Isotopen Onderzoek, Rijksuniversiteit Groningen, Nijenborgh 4, 9747 AG Groningen, the Netherlands. 29Faculty of Archaeology, Leiden University, P.O. Box 9515, 2300 RA Leiden, the Netherlands.
*Deceased.
†IntCal Oversight Committee members. ‡Guest contributor.
ABSTRACT. The IntCal09 and Marine09 radiocarbon calibration curves have been revised utilizing newly available and
updated data sets from 14C measurements on tree rings, plant macrofossils, speleothems, corals, and foraminifera. The cali-bration curves were derived from the data using the random walk model (RWM) used to generate IntCal09 and Marine09, which has been revised to account for additional uncertainties and error structures. The new curves were ratified at the 21st International Radiocarbon conference in July 2012 and are available as Supplemental Material at www.radiocarbon.org. The database can be accessed at http://intcal.qub.ac.uk/intcal13/.
INTRODUCTION
Radiocarbon dating has transformed our understanding of the timing of events and rates of change in archaeological and environmental proxy records since it was developed in the late 1940s (Libby et al. 1949). It is now well known that 14C years do not directly equate to calendar years (de Vries 1958; Stuiver and Suess 1966; Reimer et al. 2009) because atmospheric 14C concentration varies through time due to changes in the production rate, caused by geomagnetic and solar modulation of the cosmic-ray flux, and the carbon cycle. Hence, a calibration is required, which, to be accurate and precise, should ideally be based on an absolutely dated record that has carbon incorporated directly from the atmosphere at the time of formation.
CALIBRATION
The IntCal13, SHCal13, and Marine13 calibration curves presented here and by Hogg et al. (2013a, this issue) represent the mid-latitude Northern and Southern Hemisphere atmospheric reservoirs and a hypothetical “global” marine reservoir, which serves as a baseline for regional oceanic variations. The Northern Hemisphere calibration is well defined by tree-ring measurements from 0 to 13,900 cal BP and supplemented by the addition of the Lake Suigetsu macrofossil data, the only other bona fide atmospheric record, from 13,900 cal BP to the end of the range of the dating method. However, there are still portions of the curve where the atmospheric data are sparse or highly vari-able, or where there are discrepancies between data sets that cannot be attributed to changes in the global carbon cycle. To address these issues, we have utilized key data sets that provide a first-order reconstruction of past changes in atmospheric 14C. Specifically, we have exploited non-varved marine foraminifera data, which have large calendar age uncertainties but provide a backbone for the atmospheric curve, and U-Th-dated corals and speleothems, both of which have precise calendar ages, pin-pointing the atmospheric curve within the limits of reservoir age or dead-carbon fraction variability. Although the ocean mixed layer has a delayed response to changes in atmospheric 14C variations and attenuates the signal on the decadal to centennial scale (Stuiver and Braziunas 1993), the marine records nevertheless can be used to support reconstruction of past atmospheric 14C lev-els. Likewise, speleothem 14C ages do not represent a direct record of atmospheric 14C but include a fraction of C inherited during interaction with older reservoirs, e.g. the soil and vadose zone, that may vary through time with changes in precipitation, temperature, and vegetation cover. Where multiple marine or speleothem archives are available, they add support to the calibration curve. For a discussion of the merits and limitations of the various archives and selection criteria, see Reimer et al. (2013, this issue). All ages are reported relative to AD 1950 (before present, BP). 14C ages are henceforth referred to as “BP” and calibrated/calendar ages as “cal BP” or cal kBP (thousands of calibrated years before AD 1950).
The IntCal13, Marine13, and SHCal13 curve estimations provide a valuable update and are intended to replace the previously reported calibration curves (IntCal09, Marine09, and SHCal04). The 3 curves are available as supplemental information from the Radiocarbon website (www.radiocar-bon.org).
It should be noted that, because Marine13 is based on tropical and subtropical records, its applica-tion to 14C ages from samples at higher latitudes must take into consideration additional and possi-bly large changes in the age of the local surface ocean (Bard 1988; Bard et al. 1994; Voelker et al. 2000; Björck et al. 2003; Eiríksson et al. 2004; Bondevik et al. 2006, Sarnthein et al. 2007, 2013; Austin et al. 2011).
The effect of using the IntCal13 curve for calibration, as opposed to IntCal09 or the stand-alone Lake Suigetsu data, for dating terrestrial materials and, specifically, the Paleolithic, is discussed by Bronk Ramsey et al. (2013, this issue). Age ranges derived using Lake Suigetsu data alone and IntCal13 overlap, but using the Suigetsu data set results in more disjointed ranges than using the smoother IntCal13 curve.
THE DATA SETS
It is difficult to overstate the importance of the IntCal data sets because the requirement for 14C cal-ibration will not diminish in the future. Some of the calcal-ibration data that has been collected to date has been sampled from natural archives that no longer exist and decades of effort have been devoted to the production of millennial-scale dendrochronologies using tree-ring archives. While, in princi-ple, the IntCal data sets have all been published, many of them have undergone revisions since ear-lier publication because various supplemental information has since been obtained. Also, many of the archives used in producing calibration curves have reservoir corrections associated with them, and since our knowledge of these reservoirs has changed with time, it is critical that the 14C mea-surements and their reservoir assessment are archived separately. The database described in this paper is the result of a community effort to produce the best calibration sets from the currently avail-able data.
A full list of the IntCal13 and Marine13 data sets, along with information on the online database structure and usage, and access to the database is available at http://intcal.qub.ac.uk/intcal13/. New data sets and changes or additions to data sets used in IntCal09 and Marine09 are summarized in the following sections. The data sets included within the accompanying SHCal13 curve are presented by Hogg et al. (2013a, this issue).
Terrestrial 14C Archives
Tree rings: The IntCal09 calibration curve update did not include any changes to the IntCal04 tree-ring data sets from 0–12,550 cal BP. For IntCal13, several additional data sets have been included to improve resolution, or to strengthen or extend the curve (Table 1). In addition, 1 correction was made to the database: the Swiss Ollon 505 (VOD505) larch tree had been matched to the Preboreal pine chronology (PPC) in order to fill a gap in IntCal04, but the match was later found to be errone-ous (Hogg et al. 2013b, this issue). These measurements have now been removed from the database (decadal midpoints 11,794.5—12,127.5 cal BP). Measurements on an absolutely dendro-dated tree-ring sequence to fill this gap were completed too late for the construction of IntCal13 and will be included within the next iteration of the IntCal curve.
The floating Late Glacial pine (LGP) chronology tree-ring sequence (Friedrich et al. 2004; Kromer et al. 2004; Schaub et al. 2008) was anchored by a 14C wiggle-match as described by Hua et al. (2009). There is the potential that this link may change as additional trees are measured. An uncer-tainty in the match of ±20 yr was accounted for in the statistical methodology using implementa-tional changes described in Niu et al. (2013, this issue, section 3.4).
Plant macrofossils: 14C measurements on terrestrial plant macrofossils extracted from the varved sediments of Lake Suigetsu, Japan (Kitagawa and van der Plicht 1998a,b, 2000; Bronk Ramsey et
from the lake to circumvent issues with the previous project’s varve chronology, which were prima-rily the result of there being short, but unquantified sections of missing sediment between successive sections of the single sediment core extracted SG93 (Staff et al. 2010). The multiple lake coring also reduces the likelihood of potential problems with slumps or hiatuses, which had additionally limited confidence in the previous chronology (van der Plicht et al. 2004), and the calendar age scale has been made more robust with the integration of both thin-section microscopic and µXRF methods (Marshall et al. 2012; Schlolaut et al. 2012).
The SG06 varve chronology and its link to U-series-dated speleothem chronologies is detailed by Bronk Ramsey et al. (2012), and the method for linking the SG93 cores is described by Staff et al. (2013, this issue). Data for the period 10.2–13.9 cal kBP from the varved portion of this record have not been included as they would not contribute significantly to the much higher data density avail-able from the tree-ring data sets.
Speleothems: 14Cmeasurements from 3 U-series-dated speleothems >14 cal kBP have been included in IntCal13 (Bahamas: Beck et al. 2001, Hoffmann et al. 2010; Hulu Cave: Southon et al. 2012). Corrections for dead carbon fraction (DCF) in each sample are assumed to be constant and estimated from the period of overlap with the IntCal13 tree-ring data set (10–13.9 cal kBP). The use of an ultra-low-blank processing line for analysis of Bahamas speleothem GB-89-25-3 (Hoff-mann et al. 2010) indicated that an incorrect sample-mass 14C-blank dependence used previously for GB-89-24-1 (Beck et al. 2001) had produced artifacts in the older part of that record. Conse-quently, only data from the 14 to 26 cal kBP section of GB-89-24-1 are included in IntCal13, and a revised blank correction has been implemented for these data. To estimate the uncertainty in DCF, we have assumed, as before, that the observed difference between 14C ages of tree rings and speleo-them calcite at calendar age t is a function of secular variation in DCF and speleospeleo-them measure-ment (U-series and 14C age) uncertainty. For consistency, the uncertainty for DCF incorporated in the random walk model for the 3 speleothem records in IntCal13 is calculated in the same manner as that presented by Southon et al. (2012), i.e. DCF = (DCF(t)2 – combined(t)2), where DCF(t) is the standard deviation of the difference between the measured 14C ages of speleothem data and the IntCal13 tree-ring data set, and combined(t) is the mean combined measurement uncertainty of the uncorrected speleothem and interpolated IntCal 14C ages, for each calendar age t. A modeled com-parison of the speleothem records with the Lake Suigetsu macrofossil data produces mean DCF corrections that agree within uncertainty to those calculated from the tree-ring overlap (Bronk Ramsey et al. 2012, supplemental online material).
Table 1 Additional tree-ring samples, cal age ranges, number of samples (n), and number of rings per sample included in the IntCal13 database.
Samples
Approximate age range (cal BP)
Nr of rings
per sample References
Netherlands oak (n = 13) 670–840 10–24 van der Plicht et al. (1995)
Irish oak (n = 57) 1140–1710 10 McCormac et al. (2008); Hogg et al. (2009)
Bristlecone pine (n = 53) 2300–2750 10 Taylor and Southon (2013) German oak (n = 111) 2600–2640
3060–3660 9–10 Kromer et al. (2010); IntCal13 data-base Floating German and
Swiss trees (n = 232) 12,580–13,900
a 3–47 Hua et al. (2009); Schaub et al. (2008); IntCal13 database
aThe tree-ring data set extends back to 14,200 but has been terminated in the model at 13.9 cal kBP due to sparse measure-ments for the earlier period.
Marine 14C Archives
New U-Th and 14C measurements from coral collected on the Tahiti IODP cruises provide impor-tant, independently dated data points (Durand et al. 2013, this issue). The timescales for the non-varved Cariaco Basin and Iberian Margin data sets previously published (Hughen et al. 2006; Bard et al. 2004) have been recalculated by correlation to the new high-resolution U-Th-dated Hulu Cave 18O record (Hulu2, Edwards et al., submitted) using a Gaussian process model (Heaton et al. 2013, this issue). An additional record from the Pakistan Margin is also tuned to the Hulu2 timescale using a multiproxy approach (Bard et al. 2013, this issue). Tie-points used for aligning paleoclimate records were based on the rapid transitions between interstadial and stadial events. These are the most abrupt and clearly definable events in each record (Hughen et al. 2006; Bard et al. 2013, this issue), minimizing the potential for error from misidentification of events, or due to significant time lags between regions. Points were selected midway through the abrupt transitions to avoid artifacts from differences in resolution between records. From 0 to 10.5 cal kBP, Marine13 is based on the ocean-atmosphere box diffusion model (Oeschger et al. 1975) with parameters set as in Marine04 and Marine09 (Hughen et al. 2004; Reimer et al. 2009).
Table 2 Speleothem samples, age ranges, and DCF included in the IntCal13 curve. The mean DCF and associated uncertainty in the mean calculated through a model comparison to Lake Suigetsu (Bronk Ramsey et al. 2012) is given in parentheses.
Samples Approximate age range cal kBP Dead carbon fraction correction (14C yr) References Bahamasa GB89-25-3 (n = 247) 14–15 b
24–44 (2500 2139 ± 313± 90) Hoffmann et al. 2010, revised (see text) Bahamasa
GP89-24-1 (n = 172) 14–25
b 1512 ± 244 Beck et al. 2001,
revised (see text) Hulu Cave
H82 (n = 246) 14–27
b 460 ± 50
(440 ± 25) Southon et al. 2012 aBahamas speleothem calendar ages were erroneously entered into the database and random walk model with their
associ-ated 2, not 1, uncertainties. This error serves to reduce the weighting of this data in the calibration curve by a small amount. The much greater 14C age uncertainties were correctly incorporated.
bSpeleothem data younger than 14 cal kBP not included in the IntCal13 curve.
Table 3 New and updated marine records, age ranges, and marine reservoir corrections included in the IntCal13
curve >13.9 cal kBP and Marine13 curve >10.5 cal kBP. Reservoir ages were calculated from the 14C difference
of the overlap with the tree rings. The greater of the calculated uncertainty and ±100 14C yr was used for all
marine records <13.9 cal kBP, whereas an increased uncertainty of ±200 14C yr was used for >13.9 cal kBP.
Samples Approx. age range cal kBP Marine reservoir correction (R) (14C yr) References
IODP Tahiti coral (n = 65) 10–36 260 Durand et al. (2013, this issue)
Non-varved sediment records on Hulu2 timescale
Cariaco Basin (n = 373) 13–16 17.5–50a
aData beyond 50 cal kBP are not included in the IntCal13 curve.
430 Hughen et al. (2006); Heaton et al. (2013, this issue)
Iberian Margin (n = 41) 13–49 500 Bard et al. (2013, this issue); Heaton et al. (2013, this issue)
Pakistan Margin (n = 28) 12–45 560 Bard et al. (2013, this issue); Heaton et al. (2013, this issue)
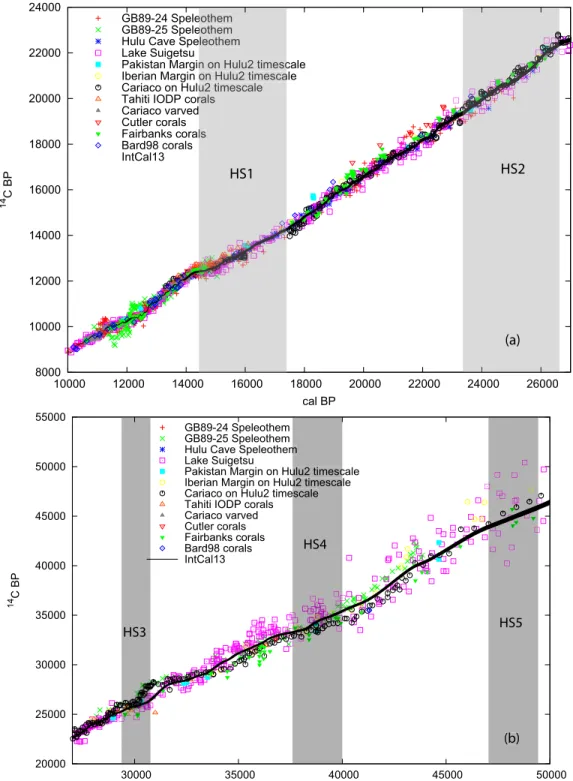
Figure 1 A comparison of the IntCal13 data sets (marine data corrected for the reservoir ages specified in Table 3) for a) the period 10–27 cal kBP and b) 27–50 cal kBP (with the approximate timing of Heinrich stadials in the North Atlantic shown as gray boxes). Uncertainties in the data are not given for clarity but are shown in the supplemental Figures S1–S25. A 1-standard deviation envelope of the IntCal13 curve is also shown.
8000 10000 12000 14000 16000 18000 20000 22000 24000 10000 12000 14000 16000 18000 20000 22000 24000 26000 14 C BP cal BP GB89-24 Speleothem GB89-25 Speleothem Hulu Cave Speleothem Lake Suigetsu
Pakistan Margin on Hulu2 timescale Iberian Margin on Hulu2 timescale Cariaco on Hulu2 timescale Tahiti IODP corals Cariaco varved Cutler corals Fairbanks corals Bard98 corals IntCal13 eothem eothem leothem n on Hulu2 timesc on Hulu2 timesca u2 timescale rals ls HS1 HS2 (a) 20000 25000 30000 35000 40000 45000 50000 55000 30000 35000 40000 45000 50000 14 C BP cal BP GB89-24 Speleothem GB89-25 Speleothem Hulu Cave Speleothem Lake Suigetsu
Pakistan Margin on Hulu2 timescale Iberian Margin on Hulu2 timescale Cariaco on Hulu2 timescale Tahiti IODP corals Cariaco varved Cutler corals Fairbanks corals Bard98 corals IntCal13 m ulu2 timesc u2 timesca escale (b) HS3 HS4 (b) HS5
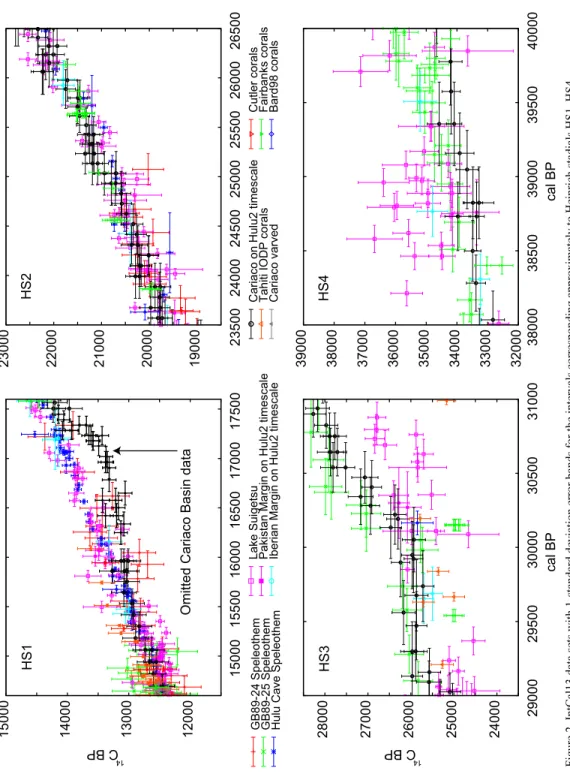
Figur e 2 In tCal13 d
ata sets with
1-standar d deviation er ro r ba nd s fo r the in terv als co rr espo nd in g appr oximately to Heinr ich sta dia ls HS1 –H S 4 12000 13000 14000 15000 15000 15500 16000 16500 17000 17500 14 C BP
Omitted Cariaco Basin data
19000 20000 21000 22000 23000 23500 24000 24500 25000 25500 26000 26500 24000 25000 26000 27000 28000 29000 29500 30000 30500 31000 14 C BP cal BP 32000 33000 34000 35000 36000 37000 38000 39000 38000 38500 39000 39500 40000 cal BP
GB89-24 Speleothem GB89-25 Speleothem Hulu Cave Speleothem Lake Suigetsu Pakistan Margin on Hulu2 timescale Iberian Margin on Hulu2 timescale Cariaco on Hulu2 timescale Tahiti IODP corals Cariaco varved Cutler corals Fairbanks corals Bard98 corals
HS1
HS2
HS3
A modeled comparison of the new and the existing marine records with Lake Suigetsu (Bronk Ram-sey et al. 2012, supplemental online material) suggests that the variability of the reservoir ages for the period 14–45 cal kBP may have been underestimated in IntCal09/Marine09. Accordingly, the reservoir age uncertainty for all of the marine records beyond the tree-ring overlap was increased to ±200 14C yr. For the Iberian Margin and for the Barbados corals and the Cariaco Basin, this addi-tional uncertainty encompasses most of the modeled uncertainty at 2 standard deviations. For the Pacific corals, the modeled comparison suggests that ±200 14C yr remains an underestimation for the Last Glacial Maximum; however, these results are preliminary and may change in the future. More marine data are needed, as well as efforts to strengthen the Lake Suigetsu varve chronology, especially beyond 40 cal kBP, to confirm the estimated reservoir age uncertainty. In the absence of confirming evidence, ±200 14C yr has nevertheless been used.
A close comparison of the Cariaco Basin and Barbados data to floating tree rings (Muscheler et al. 2008; Hua et al. 2009) previously suggested that the Cariaco and Barbados reservoir ages dropped abruptly during the onset of the Younger Dryas stadial (12.55–12.9 cal kBP), and these data were therefore removed from the IntCal09/Marine09 data sets (Reimer et al. 2009). Another possible res-ervoir age discrepancy within Heinrich stadial 1 (HS1), ~14.6–17.6 cal kBP, was discussed by Reimer et al. (2009) based on a specific mismatch between the Cariaco record and the few samples then available in the HS1 time range from the Bahamas speleothems and the Iberian Margin sedi-ments. Since 2009, further evidence to support this reservoir age offset has come from U-Th and 14C dating of a suite of corals collected offshore Tahiti in the framework of IODP (Durand et al. 2013, this issue) and from 14C data from the Hulu Cave speleothem (Southon et al. 2012) and the Lake Suigetsu plant macrofossils (Bronk Ramsey et al. 2012). It is beyond the scope of this paper to inter-pret the complexities of the impact of the Heinrich events on marine 14C outside the main ice-rafting belts, but it is interesting to note that the Cariaco Basin reservoir age offset correlates with H1b observed in ice-rafted debris off the coast of Portugal (Bard et al. 2000).
The discrepancies observed during both the YD and HS1 are tightly constrained and the 14C data have thus been removed from the Cariaco and Barbados data set prior to incorporation into IntCal13/Marine13. While the YD and HS1 discrepancies in the Cariaco Basin and Barbados records suggest that a similar pattern might be expected during the other Heinrich stadials (possibly due to shutdown of the Atlantic Meridional Overturning Circulation; McManus et al. 2004), we observe no such differences within the uncertainty of the available IntCal data sets (Figures 1 and 2).
CURVE CONSTRUCTION
The random walk modeling approach and associated implementation (Niu et al. 2013, this issue) are based on those used for IntCal09 and Marine09 (Blackwell and Buck 2008; Heaton et al. 2009), but have been revised to account for the presence of additional, irreducible uncertainty that could not be quantified from the data available, uncertainties that derive from wiggle-matching (in addition to ring or layer counting uncertainty), and dependent calendar age uncertainties.
IntCal13 and the Estimate of the Random Walk Variance
The IntCal13 curve estimate was obtained from the output of 2 different specially written computer implementations of the random walk model (Niu et al. 2013, this issue). The implementation used to construct the tree-ring (i.e. younger) part of the curve allows for uncertainty on the variance of the random walk and makes use of all of the IntCal13 tree-ring data (including those that rely on wiggle-matching for their calendar age estimates). The implementation used to construct the older part of the curve accommodates data with a range of calendar age error structures, but assumes a fixed
vari-ance on the random walk, which is taken to be the mean of the posterior distribution estimated when deriving the tree-ring part of the curve. The estimate for the older part of the curve is based on data from archives other than tree rings (i.e. speleothems, terrestrial plant macrofossils, and marine sed-iments) and is tied to the estimate based on tree rings by assuming that the first point in the former is the same as the last point in the latter (i.e. 13.9 cal kBP with 14C estimate 12,049 ± 22 BP). The posterior standard deviations on the estimated mean of the calibration curve derived from the tree-ring data were considerably smaller than those derived from the other data sets. Thus, in order to form a smooth connection between the 2 estimates the final IntCal13 estimate of the curve was obtained using a weighted average of the posterior means and standard deviations from the 2 imple-mentations of the random walk code. These weights were chosen to vary linearly so that at 13.9 cal kBP only the output from the tree-based estimate contributed to the final curve while at 14 cal kBP only the non-tree-based estimate was used.
It might be expected that atmospheric 14C variability would have been higher during the Last Glacial Maximum (LGM) than during the Holocene because the lower geomagnetic field was not as effec-tive a shield from solar cosmic-ray modulation (Bard et al. 1990; Mazaud et al. 1991); also, lower atmospheric CO2 concentrations may have resulted in a more sensitive carbon reservoir (Muscheler et al. 2004). However, an investigation of the random walk variance using a floating tree-ring series from Japan, 14C wiggle-matched to IntCal09 at 23,290–23,678 cal BP (van der Plicht et al. 2012), did not indicate an increase in the variability of atmospheric 14C across 300 yr during this period. Thus, although this does not constitute proof that atmospheric 14C variability during deglacial and glacial times was the same as during the Holocene, we use, for lack of suitable data, the variability in atmospheric 14C levels obtained from the tree-ring data in IntCal13 for the full curve.
Marine13
The Marine13 curve is composed of 3 sections. From 0–10.5 cal kBP, the marine atmosphere ocean box model (Oeschger et al. 1975; Stuiver and Braziunas 1993) was used with the IntCal13 curve as the input to create a global marine surface ocean curve (marmod13). We used the same parameter set as deployed in Marine04 and Marine09 (Hughen et al. 2004; Reimer et al. 2009). Although more sophisticated models have been shown to produce higher 14C production rates for the Holocene from the IntCal09 curve (Roth and Joos 2013), the marmod13 model fits well with marine data from the IntCal database (Figure 3).
From 10.5–13.9 cal kBP, the marine data include the varved Cariaco Basin data set, without the 12.55–12.9 cal kBP interval, and several coral data sets used in Marine09 (Reimer et al. 2009). For this section, we used the same code that was used to estimate the older part of IntCal13, but ran it only on marine data. Again, to create a smooth connection between the 2 estimates, in the interval 10.5–11 cal kBP the final estimate of the curve was obtained using a weighted average of the output from the atmosphere-ocean box model and marine-only run of the code. These weights were chosen to vary linearly along this interval so that at 11 cal kBP only the marine-only output contributed to the curve while at 10.5 cal kBP only the atmosphere-ocean box model was weighted.
For the oldest portion of the Marine13 curve, all of the available data (marine, speleothem, and ter-restrial) were used. Since there is more uncertainty in the calendar timescales of the tie-pointed records, the uncertainty of the 14C measurement increases for old samples, and the marine reservoir corrections are also uncertain, we simply used the IntCal13 curve offset by 405 14C yr. To create a continuous curve from these 2 estimates, over the period 13.9–14.2 cal kBP we used a weighted average of the 2 estimates as outlined above.
RESULTS AND DISCUSSION
The IntCal13 curve plotted as 1-standard deviation envelopes over the full range of the 14C dating method (0–50 cal kBP) in intervals of 2000 yr, with all the data points and uncertainties shown, is given in the online Supplemental Material (Figures S1–S25). They represent the “state of the art” in the ongoing community effort to develop 14C calibration over the full range of the method. Comparisons of the contributing IntCal data sets allow a discussion of any systematic differences between the different data sets (reservoir age, dead carbon fraction, calendar age) and their variabil-ity with time, location, and climate, as well as our understanding of their causes.
A comparison of all the IntCal data in Figure 1a shows that for the period 10–27 cal kBP, there is a general data agreement within a bandwidth of ~500 yr, while the RWM calibration envelope gradu-ally widens with increasing age from about 100 to 200 yr. Further back in time, significant discrep-ancies between the 2 most densely populated data sets, Cariaco and Suigetsu, become evident (Fig-ure 1b) and beyond 40 cal kBP the data density becomes low and data scatter large, so that the calculated calibration envelope, which still is only ~450 14C yr wide at 45 cal kBP, must be inter-preted with considerable caution. It is important to keep in mind that the RWM calibration envelope represents a best estimate (and associated 1 uncertainty) for the true relationship between 14C and calendar ages. In interpreting the IntCal13 curve and data (Figures S1–S25), we must remember that the IntCal data are noisy observations of the underlying true values and that (as outlined in Niu et al. 2013, this issue), for the non-tree data, we have also allowed for irreducible uncertainty that cannot be determined by the data providers.
A close inspection of the pre-tree period >13.9 cal kBP shows that the calibration envelope is close to the Hulu speleothem data, available back to 27 cal kBP. This reflects the small uncertainty in the
Figure 3 Results of the marine atmosphere ocean box model (marmod13) compared with marine data from the IntCal database from 6000 to 10,500 cal BP.
5500 6000 6500 7000 7500 8000 8500 9000 9500 10000 6000 6500 7000 7500 8000 8500 9000 9500 10000 10500 cal BP
Marine atmosphere ocean box model Marine data
Hulu 14C age and, generally, also in the calendar age, which gives these data a great weight in the averaging. The Suigetsu data are generally close to the Hulu speleothem data and the calibration envelope, but their larger scatter and, often, larger 14C age uncertainty related to the small size of many of the dated plant remains, make it difficult to quantify age offsets or the fine structure of temporal changes. The non-varved Cariaco data on the Hulu2 timescale are used with their pre-scribed minimum 14C uncertainty of 200 yr up to ~27 cal kBP and also display considerable uncer-tainty in calendar age due to the scarcity of tie-points to the underlying Hulu2 chronology in this age range. This reduces their influence on the calibration envelope; nevertheless, after removal of the 16–17.5 cal kBP data as discussed above, they are generally close to the Hulu speleothem and Suigetsu data and the calibration envelope back to 27 cal kBP.
Beyond 28 cal kBP, the data scatter increases and data sets start to diverge and deviate from the cal-ibration envelope (e.g. Figure 4a). Cariaco and Bahamas speleothem GB89-25 plot older than the envelope around 29.5 and 30–32 cal kBP, where the curve is anchored by a few Suigetsu and coral data points. Additional marine and terrestrial data are needed to resolve these discrepancies. From 34 to 39 cal kBP, Cariaco 14C ages are systematically younger than Suigetsu. The difference of 1000 yr or more is too large to be attributed solely to a low reservoir age at Cariaco, since it would require negative reservoir ages. If we exclude systematic 14C dating problems as a possible cause, this suggests the Hulu2 age of Cariaco and/or the modeled age of Suigetsu may be incorrect. An increase of Suigetsu calendar ages by ~1000 yr, or a similar decrease in Cariaco ages, would largely remove the systematic inconsistency. This change is well outside the estimated uncertainty in calen-dar ages but not impossible.
The Bahamas speleothem record GB89-25, with its own U-Th timescale, provides an independent check on these hypotheses, but the results are ambiguous. GB89-25 agrees well with Cariaco in the intervals 30–32 and 36–39 cal kBP (Figure 4a), but beyond 39 cal kBP it becomes older, and it plots closer to the Suigetsu data in the interval 34–35 cal kBP. Beyond 39 cal kBP, Suigetsu shows gener-ally large scatter that encompasses both Cariaco and Bahamas data sets (Figure 4b). The calendar age models for all 3 data sets (Suigetsu SG062012, Cariaco-Hulu2, and Bahama GB89-25) are sup-ported by the match of the peaks in 14C around 41 cal kBP with the peak in Greenland 10Be flux, connected with the Laschamp geomagnetic excursion (Singer et al. 2009) on the GICC05 timescale (Svensson et al. 2008).
The coral data included in IntCal13 often plot older than the calibration envelope up until 26 cal kBP. For older calendar ages, the coral points are younger than IntCal and often follow Cari-aco. The Iberian and Pakistan Margin data show considerable uncertainty, both in 14C and in calen-dar age, and fit the calibration envelope within this statistical uncertainty. They follow Cariaco and GB89-25 until ~39 cal kBP, beyond which they appear to follow GB89-25 (Figure 1b).
Effect of Covariance in Calendar Age Estimation
The IntCal13 database contains 4 data sets where, within each data set, the estimates of the calendar ages are interdependent. Within each of the data sets, the level of dependence between any 2 esti-mates is expressed mathematically by a covariance matrix whose diagonal elements represent the variances of individual estimates; the coefficients of correlation between the observations are readily obtained from this matrix. What impact adding this additional uncertainty information has on the estimates of the curve depends largely on the magnitude and extent of these correlations. High correlations between substantial numbers of data points in a data set mean that the relevant cal-endar age estimates can only vary when the others do too, and thus considerably restricts the range of plausible calendar age estimates. Of the 4 relevant data sets, Cariaco Basin, Iberian Margin, and
Figure 4 Comparison of IntCal13 curve and data sets for a) 28–34 cal kBP and b) 34–45 cal kBP 23000 24000 25000 26000 27000 28000 29000 30000 31000 32000 28000 29000 30000 31000 32000 33000 34000 14 C BP cal BP GB89-25 Speleothem
Pakistan Margin on Hulu2 timescale Iberian Margin on Hulu2 timescale Cariaco on Hulu2 timescale Tahiti IODP corals Cutler corals Fairbanks corals Bard98 corals Lake Suigetsu IntCal13 (a) 25000 30000 35000 40000 45000 50000 55000 34000 36000 38000 40000 42000 44000 14 C BP cal BP GB89-25 Speleothem
Pakistan Margin on Hulu2 timescale Iberian Margin on Hulu2 timescale Cariaco on Hulu2 timescale Tahiti IODP corals Cutler corals Fairbanks corals Bard98 corals Lake Suigetsu IntCal13 (b)
Pakistan Margin show moderate levels of internal correlation, but because the Lake Suigetsu record is a varve chronology, it has very high correlations between its calendar age estimates. Since Suigetsu is also an extremely long record, with calendar age estimates used for the covariance cal-culation from 11,271 to 52,824 cal BP, and also has small calendar age uncertainties relative to other data sets in the database, it has a substantial impact on the final estimate of the calibration curve. For this reason, in places, IntCal13 follows the Suigetsu record very closely even when it differs from other records (Figure 4a,b).
COMPARISON TO INTCAL09 AND MARINE09
The tree-ring portion of the IntCal13 curve is very similar to IntCal09 from 0–12,000 cal BP, although additional data have been included (Table 1) that have produced some minor changes (Fig-ure 5). Differences are more pronounced between 12,000 and 13,900 cal BP due to additional meas-urements of German pine and the inclusion of the floating tree-ring chronology. There are signifi-cant differences between 14–50 cal kBP (Figure 6).
One consequence of the modeling approach used here is that where there are many different data sets with different internal structures, the resultant mean curve averages these out, whereas when the different records all show the same structure it does appear in the final curve (as in the Holocene). It is important to note that the true variability in 14C during the Pleistocene on submillennial and shorter timescales can be greater than the IntCal13 age-corrected 14C values suggest (Figure 7). At present, if we give credence to all of the records, we are unable to unambiguously determine this fine structure for earlier periods.
Figure 5 The tree-ring portion of the IntCal13 curve from 0–14,000 cal BP compared to IntCal09. Insets show 2 sections where new data have contributed to changes in the curve.
0 2000 4000 6000 8000 10000 12000 14000 0 2000 4000 6000 8000 10000 12000 14000 14 C BP cal BP IntCal13 IntCal09 2200 2300 2400 2500 2600 2300 2400 2500 2600 2700 14C BP cal BP 2700 2800 2900 3000 3100 3200 3300 3400 3500 3000 3100 3200 3300 3400 3500 3600 14C BP cal BP
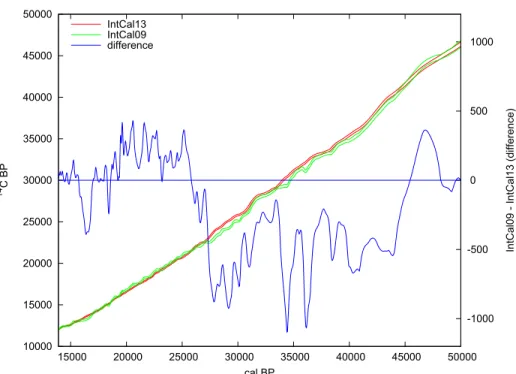
Figure 6 IntCal13 and IntCal09 curves compared from 14–50 cal kBP
Figure 7 IntCal13 and IntCal09 age-corrected 14C values compared to 10Be flux from GRIP and GISP2 ice cores (Muscheler et al. 2005) corrected onto the GICC05 timescale (Svensson et al. 2008) and converted to the cal BP timescale.
10000 15000 20000 25000 30000 35000 40000 45000 50000 15000 20000 25000 30000 35000 40000 45000 50000 -1000 -500 0 500 1000 14C BP
IntCal09 - IntCal13 (difference)
cal BP IntCal13 IntCal09 difference 350 400 450 500 550 600 650 700 750 800 20000 25000 30000 35000 40000 45000 50000 0 0.1 0.2 0.3 0.4 0.5 0.6 0.7 0.8 Age Corrected Δ 14 C 10 Be flux (10 6 atoms/cm 2 yr) cal BP IntCal13 IntCal09 10Be flux
The addition since IntCal09 of several new data sets, and the extension of existing ones, has greatly improved the database for the construction of IntCal13 and Marine13 for the period beyond the tree-ring calibration. The resulting spread of data points likely retains some systematic differences not solely attributable to noise, particularly with respect to potentially varying reservoir and DCF corrections. These unquantified errors are handled by the inclusion of an additive parameter in the RWM algorithm (Niu et al. 2013, this issue). The resulting IntCal13 calibration envelope is somewhat narrower and much smoother than IntCal09, and centennial and millennial-scale fluctuations in 14C concentration in the temporal structure of the individual records are largely removed. Some of these variations are likely related to 14C production events, climate, fluctuations in atmospheric CO2, and atmosphere-ocean exchange and thus represent a real and important signal. However, the critical point is that for the period beyond the tree rings, the scatter and the systematic offsets in the presently available data are too large to distinguish these real 14C variations from random fluctuations.
The increased smoothing compared to IntCal09 and a shift to older 14C ages beyond ~27 cal kBP, resulting from the addition of Suigetsu and other data sets, is shown by Figure 6. Figure 7 compares the variability in atmospheric 14C concentration, expressed as 14C, in IntCal09 and IntCal13 with the variability in 10Be flux derived from the Greenland ice cores (Muscheler et al. 2005). Despite smoothing, IntCal09 and IntCal13 both show a reasonable correspondence with 10Be production from about 23 to 45 cal kBP, suggesting that production variations were a major factor in 14C changes over this interval. The younger part of the 10Be record shows less structure, while the IntCal data show a substantial drop in 14C. The atmospheric 14C record through the Last Glacial Maxi-mum (LGM) and deglaciation may thus have been more influenced by climate-related changes in the global carbon cycle.
CONCLUSIONS AND FUTURE DIRECTIONS
As always, 14C calibration should be seen as a work in progress. We encourage researchers to use the available data to synthesize curves in their own way and potentially contribute new and improved strategies to the construction of the 14C calibration curve. It is difficult to foresee where new records will come from or in what way our understanding of the physical processes that affect atmospheric and marine 14C levels will improve. However, we are confident that some of the issues in the current calibration curve will be resolved with the measurement of more archives and potential linkages of the floating kauri 14C sequences (Palmer et al. 2006) to 10Be in ice cores (Muscheler et al. 2005), as well as the further development of geophysical models of marine and atmospheric 14C (Singarayer et al. 2008; Butzin et al. 2012). Additionally, recent reports of very large interannual 14C changes in single-year tree-ring records (Miyake et al. 2012; Usoskin et al. 2013) highlight the importance of supplementing the presently decadal pre-440 cal BP tree-ring calibration with single-year data as they become available.
There is especially a need for further atmospheric data sets as well as for marine data sets, docu-menting 14C concentrations that vary with oceanographic location and time, to improve calibration of oceanographic 14C ages and to verify the marine modeling of the recent period as well as for atmospheric data sets where discrepancies exist between the IntCal13 data sets. Region-specific marine calibration curves may possibly be developed where sufficient tephra horizons can be iden-tified to provide reliable tie-points for an age-depth model (Austin et al. 2011; Olsen et al. 2013). It is also clear from this exercise that the next phase of curve construction will need to deal with the atmosphere-marine relationship on the basis of the basic constraints of the carbon cycle. While we will continue to use marine records for comparison to terrestrial records, it is hoped that future
cal-ibration curves can be wholly marine and wholly terrestrial. The data available are now sufficiently comprehensive that we need to consider the system as a whole, something that was beyond the scope of this data-integration exercise.
ACKNOWLEDGMENTS
Funding for this work was provided in part by the Natural Environment Research Council, UK grant NE/I01666X/1 and NE/E019129/1. The US National Science Foundation supported contributions by some of the coauthors. Travel expenses for 2 members to attend Working Group meetings of the IntCal Oversight Committee were funded by IGBP – PAGES (International Geosphere-Biosphere Programme – Past Global Changes) Project. Additional support for the working group meetings was provided by the Collège de France, the 14CHRONO Centre, QUB and by individual IWG members. We appreciate the constructive review by Tim Jull and the many useful discussions with Bill Austin, Maarten Blaauw, Raimund Muscheler, Jesper Olsen, and many others.
ONLINE SUPPLEMENTAL MATERIAL
Figures S1–S25. The IntCal13 curve with a standard deviation error envelope and the data with 1-standard deviation uncertainty in the 14C age and cal age shown in 2000-yr windows. The number of data points for each record within the window is given in parentheses.
REFERENCES
Austin WEN, Hibbert FD. 2012. Tracing time in the ocean: a brief review of chronological constraints (60– 8 kyr) on North Atlantic marine event-based stratigra-phies. Quaternary Science Reviews 36:28–37. Austin WEN, Telford RJ, Ninnemann US, Brown L,
Wil-son LJ, Small DP, Bryant CL. 2011. North Atlantic reservoir ages linked to high Younger Dryas atmo-spheric radiocarbon concentrations. Global and Plan-etary Change 79(3–4):226–33.
Bard E. 1988. Correction of accelerator mass spectrom-etry 14C ages measured in planktonic foraminifera: pa-leoceanographic implications. Paleoceanography 3(6):635–45.
Bard E, Hamelin B, Fairbanks RG, Zindler A. 1990. Cal-ibration of the 14C timescale over the past 30,000 years using mass spectrometric U-Th ages from Barbados corals. Nature 345(6274):405–10.
Bard E, Arnold M, Mangerud J, Paterne M, Labeyrie L, Duprat J, Mélières MA, Sønstegaard E, Duplessy J-C. 1994. The North Atlantic atmosphere-sea surface 14C gradient during the Younger Dryas climatic event. Earth and Planetary Science Letters 126(4):275–87. Bard E, Rostek F, Turon J-L, Gendreau S. 2000.
Hydro-logical impact of Heinrich events in the subtropical northeast Atlantic. Science 289(5483):1321–4. Bard E, Rostek F, Ménot-Combes G. 2004. Radiocarbon
calibration beyond 20,000 14C yr B.P. by means of planktonic foraminifera of the Iberian Margin. Qua-ternary Research 61(2):204–14.
Bard E, Ménot G, Rostek F, Licari L, Böning P, Edwards RL, Cheng H, Wang YJ, Heaton TJ. 2013. Radiocar-bon calibration/comparison records based on marine
sediments from the Pakistan and Iberian margins. Ra-diocarbon 55(4), this issue.
Beck JW, Richards DA, Edwards RL, Silverman BW, Smart PL, Donahue DJ, Hererra-Osterheld S, Burr GS, Calsoyas L, Jull AJT, Biddulph D. 2001. Ex-tremely large variations of atmospheric 14C concentra-tion during the last glacial period. Science 292(5526): 2453–8.
Björck S, Koç N, Skog G. 2003. Consistently large ma-rine reservoir ages in the Norwegian Sea during the Last Deglaciation. Quaternary Science Reviews 22(5– 7):429–35.
Blackwell PG, Buck CE. 2008. Estimating radiocarbon calibration curves. Bayesian Analysis 3(2):225–48. Bondevik S, Mangerud J, Birks HH, Gulliksen S, Reimer
P. 2006. Changes in North Atlantic radiocarbon reser-voir ages during the Allerød and Younger Dryas. Sci-ence 312(5779):1514–7.
Bronk Ramsey C, Staff RA, Bryant CL, Brock F, Kita-gawa H, van der Plicht J, Schlolaut G, Marshall MH, Brauer A, Lamb HF, Payne RL, Tarasov PE, Haragu-chi T, Gotanda K, Yonenobu H, Yokoyama Y, Tada R, Nakagawa T. 2012. A complete terrestrial radiocarbon record for 11.2 to 52.8 kyr B.P. Science 338(6105): 370–4.
Bronk Ramsey C, Scott EM, van der Plicht J. 2013. Cal-ibration for archaeological and environmental terres-trial samples in the time range 26–50 ka cal BP. Ra-diocarbon 55(4), this issue.
Butzin M, Prange M, Lohmann G. 2012. Readjustment of glacial radiocarbon chronologies by self-consistent three-dimensional ocean circulation modeling. Earth
and Planetary Science Letters 317–318:177–84. de Vries H. 1958. Variation in concentration of
radiocar-bon with time and location on earth. Proceedings of the Koninklijke Nederlandse Akademie Van Weten-schappen Series B 61:94–102.
Durand N, Deschamps P, Bard E, Hamelin B, Camoin G, Thomas AL, Henderson GM, Yokoyama Y, Matsuzaki H. 2013. Comparison of 14C and U-Th ages in corals from IODP #310 cores offshore Tahiti. Radiocarbon 55(4), this issue.
Edwards RL, Cheng H, Wang YJ, Yuan DX, Kelly MJ, Kong XG, Wang XF, Burnett A, Smith E. 2013. A re-fined Hulu and Dongge Cave climate record and the timing of the climate change during the last glacial cy-cle. Earth and Planetary Science Letters, submitted. Eiríksson J, Larsen G, Knudsen KL, Heinemeier J,
Símo-narson LA. 2004. Marine reservoir age variability and water mass distribution in the Iceland Sea. Quaternary Science Reviews 23(20–22):2247–68.
Friedrich M, Remmele S, Kromer B, Hofmann J, Spurk M, Kaiser KF, Orcel C, Küppers M. 2004. The 12,460-year Hohenheim oak and pine tree-ring chronology from central Europe—a unique annual record for ra-diocarbon calibration and paleoenvironment recon-structions. Radiocarbon 46(3):1111–22.
Heaton TJ, Blackwell PG, Buck CE. 2009. A Bayesian approach to the estimation of radiocarbon calibration curves: the IntCal09 methodology. Radiocarbon 51(4):1151–64.
Heaton TJ, Bard E, Hughen K. 2013. Elastic tie-point-ing—transferring chronologies between records via a Gaussian process. Radiocarbon 55(4), this issue. Hoffmann DL, Beck JW, Richards DA, Smart PL,
Singa-rayer JS, Ketchmark T, Hawkesworth CJ. 2010. To-wards radiocarbon calibration beyond 28 ka using speleothems from the Bahamas. Earth and Planetary Science Letters 289(1–2):1–10.
Hogg A, Palmer J, Boswijk G, Reimer P, Brown D. 2009. Investigating the interhemispheric 14C offset in the 1st millennium AD and assessment of laboratory bias and calibration errors. Radiocarbon 51(4):1177–86. Hogg AG, Hua Q, Blackwell PG, Niu M, Buck CE,
Guil-derson TP, Heaton TJ, Palmer JG, Reimer PJ, Reimer RW, Turney CSM, Zimmerman SRH. 2013a. SHCal13 Southern Hemisphere calibration, 0–50,000 years cal BP. Radiocarbon 55(4), this issue. Hogg A, Turney C, Palmer J, Southon J, Kromer B,
Bronk Ramsey C, Boswijk G, Fenwick P, Noronha A, Staff R, Friedrich M, Reynard L, Guetter D, Wacker L, Jones R. 2013b. The New Zealand kauri (Agathis aus-tralis) research project: a radiocarbon dating inter-comparison of Younger Dryas wood and implications for IntCal13. Radiocarbon 55(4), this issue. Hua Q, Barbetti M, Fink D, Kaiser KF, Friedrich M,
Kromer B, Levchenko VA, Zoppi U, Smith AM, Ber-tuch F. 2009. Atmospheric 14C variations derived from tree rings during the early Younger Dryas. Quaternary Science Reviews 28(25–26):2982–90.
Hughen KA, Baillie MGL, Bard E, Beck JW, Bertrand CJH, Blackwell PG, Buck CE, Burr GS, Cutler KB, Damon PE, Edwards RL, Fairbanks RG, Friedrich M, Guilderson TP, Kromer B, McCormac G, Manning S, Bronk Ramsey C, Reimer PJ, Reimer RW, Remmele S, Southon JR, Stuiver M, Talamo S, Taylor FW, van der Plicht J, Weyhenmeyer CE. 2004. Marine04 ma-rine radiocarbon age calibration, 0–26 cal kyr BP. Ra-diocarbon 46(3):1059–86.
Hughen K, Southon J, Lehman S, Bertrand C, Turnbull J. 2006. Marine-derived 14C calibration and activity record for the past 50,000 years updated from the Car-iaco Basin. Quaternary Science Reviews 25(23–24): 3216–27.
Kitagawa H, van der Plicht J. 1998a. Atmospheric radio-carbon calibration to 45,000 yr B.P.: Late Glacial fluc-tuations and cosmogenic isotope production. Science 279(5354):1187–90.
Kitagawa H, van der Plicht J. 1998b. A 40,000-year varve chronology from Lake Suigetsu, Japan: exten-sion of the 14C calibration curve. Radiocarbon 40(1): 505–15.
Kitagawa H, van der Plicht J. 2000. Atmospheric radio-carbon calibration beyond 11,900 cal BP from Lake Suigetsu laminated sediments. Radiocarbon 42(3): 369–80.
Kromer B, Friedrich M, Hughen KA, Kaiser F, Remmele S, Schaub M, Talamo S. 2004. Late Glacial 14C ages from a floating, 1382-ring pine chronology. Radiocar-bon 46(3):1203–9.
Kromer B, Manning SW, Friedrich M, Talamo S, Trano N. 2010. 14C calibration in the 2nd and 1st millennia BC—Eastern Mediterranean Radiocarbon Compari-son Project (EMRCP). Radiocarbon 52(3):875–86. Libby WF, Anderson EC, Arnold JR. 1949. Age
determi-nation by radiocarbon content: world-wide assay of natural radiocarbon. Science 109(2827):227–8. Marshall M, Schlolaut G, Nakagawa T, Lamb H, Brauer
A, Staff R, Bronk Ramsey C, Tarasov P, Gotanda K, Haraguchi T, Yokoyama Y, Yonenobu H, Tada R, Sui-getsu 2006 Project Members. 2012. A novel approach to varve counting using XRF and X-radiography in combination with thin-section microscopy, applied to the Late Glacial chronology from Lake Suigetsu, Ja-pan. Quaternary Geochronology 13:70–80. Mazaud A, Laj C, Bard E, Arnold M, Tric E. 1991.
Geo-magnetic-field control of 14C production over the last 80 ky: implications for the radiocarbon time-scale. Geophysical Research Letters 18(10):1885–8. McCormac FG, Bayliss A, Brown DM, Reimer PJ,
Th-ompson MM. 2008. Extended radiocarbon calibration in the Anglo-Saxon period, AD 395–485 and AD 735– 805. Radiocarbon 50(1):11–7.
McManus JF, Francois R, Gherardi J-M, Keigwin LD, Brown-Leger S. 2004. Collapse and rapid resumption of Atlantic meridional circulation linked to deglacial climate changes. Nature 428(6985):834–7.
signature of cosmic-ray increase in AD 774–775 from tree rings in Japan. Nature 486(7402):240–2. Muscheler R, Beer J, Wagner G, Laj C, Kissel C,
Rais-beck GM, Yiou F, Kubik PW. 2004. Changes in the carbon cycle during the last deglaciation as indicated by the comparison of 10Be and 14C records. Earth and
Planetary Science Letters 219(3–4):325–40. Muscheler R, Beer J, Kubik PW, Synal H-A. 2005.
Geo-magnetic field intensity during the last 60,000 years based on 10Be and 36Cl from the Summit ice cores and 14C. Quaternary Science Reviews 24(16–17):1849– 60.
Muscheler R, Kromer B, Björck S, Svensson A, Friedrich M, Kaiser KF, Southon J. 2008. Tree rings and ice cores reveal 14C calibration uncertainties during the Younger Dryas. Nature Geoscience 1:263–7. Nakagawa T, Gotanda K, Haraguchi T, Danhara T,
Yonenobu H, Brauer A, Yokoyama Y, Tada R, Take-mura K, Staff RA, Payne R, Bronk Ramsey C, Bryant C, Brock F, Schlolaut G, Marshall M, Tarasov P, Lamb H, Suigetsu 2006 Project Members. 2012. SG06, a perfectly continuous and varved sediment core from Lake Suigetsu, Japan: stratigraphy and potential for improving the radiocarbon calibration model and un-derstanding of late Quaternary climate changes. Qua-ternary Science Reviews 36:164–76.
Niu M, Heaton TJ, Blackwell PG, Buck CE. 2013. The Bayesian approach to radiocarbon calibration curve estimation: the IntCal13, Marine13, and SHCal13 methodologies. Radiocarbon 55(4), this issue. Oeschger H, Siegenthaler U, Schotterer U, Gugelmann
A. 1975. A box diffusion model to study the carbon di-oxide exchange in nature. Tellus 27(2):168–92. Olsen J, Rasmussen TL, Reimer PJ. 2013. North Atlantic
marine radiocarbon reservoir ages through Heinrich event H4: a new method for marine age model con-struction. In: Austin WEN, Abbott P, Davies S, Pearce N, Wastegard S, editors. Marine Tephrochronology. Geological Society of London. Special Publication. In press.
Palmer J, Lorrey A, Turney CSM, Hogg A, Baillie M, Fifield K, Ogden J. 2006. Extension of New Zealand kauri (Agathis australis) tree-ring chronologies into Oxygen Isotope Stage (OIS) 3. Journal of Quaternary Science 21(7):779–87.
Reimer PJ, Baillie MGL, Bard E, Bayliss A, Beck JW, Blackwell PG, Bronk Ramsey C, Buck CE, Burr GS, Edwards RL, Friedrich M, Grootes PM, Guilderson TP, Hajdas I, Heaton TJ, Hogg AG, Hughen KA, Kai-ser KF, Kromer B, McCormac FG, Manning SW, Re-imer RW, Richards DA, Southon JR, Talamo S, Tur-ney CSM, van der Plicht J, Weyhenmeyer CE. 2009. IntCal09 and Marine09 radiocarbon age calibration curves, 0–50,000 years cal BP. Radiocarbon 51(4): 1111–50.
Reimer PJ, Bard E, Bayliss A, Beck JW, Blackwell PG, Bronk Ramsey C, Buck CE, Edwards RL, Friedrich
M, Grootes PM, Guilderson TP, Haflidason H, Hajdas I, Hatté C, Heaton TJ, Hogg AG, Hughen KA, Kaiser KF, Kromer B, Manning SW, Reimer RW, Richards DA, Scott EM, Southon JR, Turney CSM, van der Pli-cht J. 2013. Selection and treatment of data for radio-carbon calibration: an update to the International Cal-ibration (IntCal) criteria. Radiocarbon 55(4), this issue.
Roth R, Joos F. 2013. A reconstruction of radiocarbon production and total solar irradiance from the Ho-locene 14C and CO
2 records: implications of data and model uncertainties. Climate of the Past Discussions 9:1165–235.
Sarnthein M, Grootes PM, Kennett JP, Nadeau M-J. 2007. 14C reservoir ages show deglacial changes in ocean currents and carbon cycle. In: Schmittner A, Chiang JCH, Hemming SR, editors. Ocean Circula-tion: Mechanisms and Impacts - Past and Future Changes of Meridional Overturning. Geophysical Monograph 173. Washington, DC: American Geo-physical Union. p 175–96.
Sarnthein M, Schneider B, Grootes PM. 2013. Peak gla-cial 14C ventilation ages suggest major draw-down of carbon into the abyssal ocean. Climate of the Past Dis-cussions 9:925–65.
Schaub M, Büntgen U, Kaiser KF, Kromer B, Talamo S, Andersen KK, Rasmussen SO. 2008. Lateglacial en-vironmental variability from Swiss tree rings. Quater-nary Science Reviews 27(1–2):29–41.
Schlolaut G, Marshall MH, Brauer A, Nakagawa T, Lamb HF, Staff RA, Bronk Ramsey C, Bryant CL, Brock F, Kossler A, Tarasov PE, Yokoyama Y, Tada R, Haragu-chi T, Suigetsu 2006 Project Members. 2012. An au-tomated method for varve interpolation and its appli-cation to the Late Glacial chronology from Lake Sui-getsu, Japan. Quaternary Geochronology 13:52–69. Singarayer JS, Richards DA, Ridgwell A, Valdes PJ,
Austin WEN, Beck JW. 2008. An oceanic origin for the increase of atmospheric radiocarbon during the Younger Dryas. Geophysical Research Letters 35: L14707, doi:10.1029/2008GL034074.
Singer BS, Guillou H, Jicha BR, Laj C, Kissel C, Beard BL, Johnson CM. 2009. 40Ar/39Ar, K-Ar and 230 Th-238U dating of the Laschamp excursion: a radioiso-topic tie-point for ice core and climate chronologies. Earth and Planetary Science Letters 286(1–2):80–8. Southon J, Noronha AL, Cheng H, Edwards RL, Wang Y.
2012. A high-resolution record of atmospheric 14C based on Hulu Cave speleothem H82. Quaternary Sci-ence Reviews 33:32–41.
Staff RA, Bronk Ramsey C, Nakagawa T, Suigetsu 2006 Project Members. 2010. A re-analysis of the Lake Suigetsu terrestrial radiocarbon dataset. Nuclear Instruments and Methods in Physics Research B 268(7–8):960–5.
Staff RA, Schlolaut G, Bronk Ramsey C, Brock F, Bryant CL, Kitagawa H, van der Plicht J, Marshall MH,
Brauer A, Lamb HF, Payne RL, Tarasov PE, Haragu-chi T, Gotanda K, Yonenobu H, Yokoyama Y, Naka-gawa T, Suigetsu 2006 Project Members. 2013. Inte-gration of the old and new Lake Suigetsu (Japan) terrestrial radiocarbon calibration data sets. Radiocar-bon 55(4), this issue.
Stuiver M, Braziunas TF. 1993. Modeling atmospheric 14C influences and 14C ages of marine samples to 10,000 BC. Radiocarbon 35(1):137–89.
Stuiver M, Suess HE. 1966. On the relationship between radiocarbon dates and true sample ages. Radiocarbon 8:534–40.
Svensson A, Andersen KK, Bigler M, Clausen HB, Dahl-Jensen D, Davies SM, Johnsen SJ, Muscheler R, Par-renin F, Rasmussen SO, Röthlisberger R, Seierstad I, Steffensen JP, Vinther BM. 2008. A 60 000 year Greenland stratigraphic ice core chronology. Climate of the Past 4:47–57.
Taylor RE, Southon J. 2013. Reviewing the Mid-First Millennium BC 14C “warp” using 14C/bristlecone pine data. Nuclear Instruments and Methods in Physics Re-search B 294:440–3.
Usoskin IG, Kromer B, Ludlow F, Beer J, Friedrich M, Kovaltsov GA, Solanki SK, Wacker L. 2013. The AD775 cosmic event revisited: the Sun is to blame. Astronomy and Astrophysics 552: L3.
van der Plicht J, Jansma E, Kars H. 1995. The “Amster-dam Castle”: a case study of wiggle matching and the proper calibration curve. Radiocarbon 37(3):965–8. van der Plicht J, Beck JW, Bard E, Baillie MGL,
Black-well PG, Buck CE, Friedrich M, Guilderson TP, Hughen KA, Kromer B, McCormac FG, Bronk Ram-sey C, Reimer PJ, Reimer RW, Remmele S, Richards DA, Southon JR, Stuiver M, Weyhenmeyer CE. 2004. NotCal04—comparison/calibration 14C records 26– 50 cal kyr BP. Radiocarbon 46(3):1225–38. van der Plicht J, Imamura M, Sakamoto M. 2012. Dating
of Late Pleistocene tree-ring series from Japan. Radio-carbon 54(3–4):625–33.
Voelker AHL, Grootes PM, Nadeau M-J, Sarnthein M. 2000. Radiocarbon levels in the Iceland Sea from 25– 53 kyr and their link to the Earth’s magnetic field in-tensity. Radiocarbon 42(3):437–52.