Publisher’s version / Version de l'éditeur:
Vous avez des questions? Nous pouvons vous aider. Pour communiquer directement avec un auteur, consultez la
première page de la revue dans laquelle son article a été publié afin de trouver ses coordonnées. Si vous n’arrivez
Questions? Contact the NRC Publications Archive team at
[email protected]. If you wish to email the authors directly, please see the first page of the publication for their contact information.
https://publications-cnrc.canada.ca/fra/droits
L’accès à ce site Web et l’utilisation de son contenu sont assujettis aux conditions présentées dans le site LISEZ CES CONDITIONS ATTENTIVEMENT AVANT D’UTILISER CE SITE WEB.
International Journal of Molecular Sciences, 22, 4, pp. 1-11, 2021-02-04
READ THESE TERMS AND CONDITIONS CAREFULLY BEFORE USING THIS WEBSITE. https://nrc-publications.canada.ca/eng/copyright
NRC Publications Archive Record / Notice des Archives des publications du CNRC : https://nrc-publications.canada.ca/eng/view/object/?id=43c1e73c-95fa-4761-b4a5-de717ba9f497 https://publications-cnrc.canada.ca/fra/voir/objet/?id=43c1e73c-95fa-4761-b4a5-de717ba9f497
NRC Publications Archive
Archives des publications du CNRC
This publication could be one of several versions: author’s original, accepted manuscript or the publisher’s version. / La version de cette publication peut être l’une des suivantes : la version prépublication de l’auteur, la version acceptée du manuscrit ou la version de l’éditeur.
For the publisher’s version, please access the DOI link below./ Pour consulter la version de l’éditeur, utilisez le lien DOI ci-dessous.
https://doi.org/10.3390/ijms22041548
Access and use of this website and the material on it are subject to the Terms and Conditions set forth at
Size-specific copper nanoparticle cytotoxicity varies between human cell lines
Size specific copper nanoparticle cytotoxicity varies
between human cell lines
Ina Na, and David C. Kennedy*
Metrology, National Research Council Canada, 1200 Montreal Road, Ottawa K1A 0R6, Canada
Keywords: copper nanoparticle, cytotoxicity, uptake, stability, spectroscopy.
Abstract
Commercially available copper nanoparticles of three different sizes have been tested for cytotoxicity against three human cell lines using four different cytotoxicity assays. This array of data was designed to elucidate trends in particle stability, uptake and cytotoxicity. The copper nanoparticles are not stable in cell culture media and rapid changes over the time course of the assays play a critical role in the measured endpoints. Typically, the 40-60 nm particles tested were more cytotoxic than either smaller or larger particles. These particles were also taken up more readily by cells and exhibited different stability dynamics in cell culture media. This provides good correlation between total cellular uptake of copper and cytotoxicity that may be directly linked to particle stability, though it is unclear why the intermediate sized particles exhibited these unique properties when compared to both larger and smaller particles.
Introduction
Copper is an important trace element in humans, and is tightly regulated in the body. High levels of copper are maintained in the brain for neurotransmitter production and in the body, copper is involved in metabolic activity and immune response.1-2 Diseases are associated with both copper excess – Wilson’s disease,3 and deficiency – Menkes disease,4
and changes in copper homeostasis are also linked to several neurodegenerative disorders such as Alzheimer’s disease, Parkinson’s disease, prion disorders and Huntington’s disease.5-11 With nanoparticles being increasingly incorporated into commercial products, it is important to determine if either the materials or their metabolites in the human body can pose a threat to human health. Copper nanoparticles are used as both drugs to treat osteoporosis,12 and as antibacterial and antifungal agents.13-18 There is also significant interest in using nano-copper as an antiviral material that can be incorporated into personal protective gear and other healthcare products to help prevent against the spread of infectious diseases.19 Nano-copper is also used in large quantities in pesticides20-21 and as a nutritional supplement in both cattle and poultry feed.22-23 This intersection with the
food-chain poses a potential exposure hazard to humans and direct medical intervention using nano-copper can deliver copper nanoparticles directly into the blood, circumventing defence barriers through other traditional exposure routes such as ingestion and inhalation. While there are studies on copper nanoparticle exposure in animal models,24-25 relatively little is known about their direct effects on human cells, and whether or not specific particle sizes pose specific risks, as this size dependence is observed for other particles such as silver nanoparticles,26-27 another common antimicrobial metal nanoparticle. Further,
attempts have been made to create stable suspensions of copper nanoparticles in various aqueous media; however, monitoring the fate of the suspended particles when introduced to cell culture media over incubation periods for cell-based assays is still a challenge. In this work we examine the cytotoxic behaviour of three sizes of copper nanoparticles against three human cell lines using four different assays, to build up an array of biological data, correlated with physical characterization of the particles to examine whether there is a significant risk posed by such particles in the cell lines examined, and more broadly, whether these in vitro assays suggest further study in more complex model systems related to exposure through food-based or medical products is needed.
Methods and Materials
Materials
Copper nanoparticles were purchased from Skyspring Nanomaterials as dry black powders in three sizes – 25 nm, 40-60nm, and 60-80nm. The particles are spherical and without surface coating or stabilizing agents, greater than 99.8% copper. CuCl2 was purchased from sigma Aldrich.
Cell Culture
SH-SY5Y (brain), A549 (lung) and HepG2 (liver) cells (American Tissue Culture Center) were all grown in Dulbecco’s modified Eagle’s medium (DMEM) (Gibco) supplemented with 10% fetal bovine serum (FBS) (Gibco) and 1% penicillin-streptomycin (Pen/strep) (50 µg/ml, Gibco) under standard culture conditions (37 °C, 5% CO2). Cells were grown in T75 flasks (Falcon) and Trypsin-EDTA solution (Gibco) was used for passaging cells (3mL per T75 flask for HepG2 and A549 cells and 2 mL for SH-SY5Y). For passaging, SH-SY5Y cells were treated with
Trypsin-EDTA at room temperature for 5 min, while the other two cell lines were incubated for 10 minutes at 37 degrees.
Nanoparticle Suspension Preparation
Stock suspensions of each nanoparticle size were prepared in clear complete media at 200 μg/mL and bath sonicated for 10 minutes at 25oC to disperse the particles. The suspensions were promptly diluted in clear complete media to 150, 100, 50, 25, 10, 5, and 1 µg/mL for immediate use.
Dynamic Light Scattering
Samples were run on a Malvern Zetasizer Nano-ZS. Samples were run in plastic cuvettes (BRAND) with a 1 mL sample volume. Each sample was measured 3 times. Nanoparticles were suspended in water, media without FBS and complete media using bath and probe sonication methods for dispersing particles at a concentration of 200 μg/mL and were diluted with media as needed to improve the readings.
Transmission Electron Microscopy
Sample preparation: Samples were prepared in the same manner as for DLS at a concentration of 200 μg/mL. Carbon film supported TEM grids were glow discharged. About 8µl droplet of CuNP suspension was placed on TEM grid. After one minute, excess liquid on grid was blotted away with filter paper and grids were rinsed with deionized water two times to remove salt. TEM grids with CuNPs were then dried at ambient air before being analyzed in TEM.
Image acquisition: Bright field (BF) TEM images of CuNPs were carried out on a Hitachi S5500 TEM. Individual particles were not observed. Particle analysis of the resulting agglomerates was not possible given the resolution of the images.
Cells were seeded into wells in a 96-well plate (Falcon) (1.5 x 10⁵ cells/ml (A549 and HepG2) and 2 x 10⁵ cells/ml (SH-SY5Y), 100 µl per well) to cover a 9x6 grid, filling 54 wells. Remaining wells were filled with 200 µl of PBS. After 24 hours the media was removed and 200 µl of each dilution of particles in complete media spanning from 200 µg/mL to 1 µg/mL were added to the seeded wells. For each nanoparticle, eight dilutions were prepared and for each dilution six replicates were performed. In the remaining 6 wells, 100 µL of media was added as a particle-free control. Cells were then incubated with nanoparticles for 24 h. After 24 h, 50 µL of a PBS solution of MTT (2.5 mg/ml) was added to each well and then incubated for 3 h. After 3 h, media was aspirated from all wells, leaving purple formazan crystals in those wells with viable cells. To each well, 150 µl of DMSO was added. Plates were then agitated for 30 s to dissolve the crystals and analyzed using a plate reader (Fluorstar Omega, BMG Labtech.) to determine the absorbance of each well at 570 nm. This reading divided by the average from the reading of the six control wells was plotted to determine thehalf maximal inhibitory concentration (IC50) value of each compound
for each cell line. Six replicates were performed for each sample on each cell line for each experiment, and each experiment was repeated three times. The values and errors reported are calculated from 18 unique measurements after curves were fit with a 4-variable sigmoidal curve to calculate the IC50 values.
Neutral Red Assay
This procedure was modified from a published protocol.28 Cells were prepared in a manner
identical as for the MTT assay and treated for 24 h with nanoparticles in a 96-well plate. Neutral red media was prepared as reported. After 24 h, media was aspirated and 100 μL of neutral red media was added to each well. Plates were then incubated for 2 hours at which time the neutral red media was aspirated from the wells. Cells were then washed with 150 μL of PBS, and then
150 μL of destain solution (50% ethanol, 49% water, 1% acetic acid) was added to each well. Plates were then shaken for 10 min to extract the neutral red from the cells and then the absorbance of each well was measured at 540 nm.
Water Soluble Tetrazolium 8 (WST-8) Assay
Assays were performed using CCK-8 kit purchased from VitaScientific. Their procedure was adapted to our 24 h protocol used for the MTT assay. After 24 h treatment, 10 μL of WST-8 reagent was added to each well. Plates were then incubated for 4 h after which plates were measured at 450 nm.
2',7' –dichlorofluorescin diacetate (DCFDA) Assay
DCFDA assays were performed using abcam ab113851 kits. Cells were prepared in a manner identical as for the MTT assay in black walled 96-well plates. Immediately prior to use, DCFDA buffer and solution was prepared as per the assay kit protocol. After seeding the cells overnight, the wells were washed with 100 µL DCFDA buffer. The wells were then filled with 100 µL DCFDA solution and incubated in standard culture conditions for 45 minutes. After incubation, the DCFDA solution was removed and replaced with 100 µL 1X PBS. The fluorescence was read at Ex/Em 485/535 using a spectrophotometer. The buffer was then removed and replaced with 100 µL of each dilution (200, 150, 100, 50, 25, 10, 5, and 1 µg/mL) with the highest on the left and lowest on the right side of the plate. The leftmost and rightmost column were filled with 100 µL complete media. Fluorescence measurements were taken again at Ex/Em = 485/535 nm immediately after the dilutions were applied, after 1, 2 , 3 and 24 hours. Between each time the fluorescence was measured, the plates were incubated under standard culture conditions.
To determine the CuNP uptake into cells, 5 mL cell suspensions of 105 cells/mL cells were plated into 3 cm Petri dishes. After 24 h, 250 μL of nanoparticles (stock suspensions of 20 μg/mL) were added to the cells. These samples were incubated for 24 h, at which times the media was removed and the cells rinsed twice with PBS. Trypsin-EDTA (2 mL of 0.25 %) was then added to detach the cells from the plate surface, and an additional 3 mL of PBS added to resuspend the cells. These suspensions were transferred to 15 mL conical Falcon tubes and centrifuged for 5 min at 800 rpm. The supernatant was discarded and the cells resuspended and rinsed twice with PBS in this manner to remove particles from the cell surface. Cell pellets were then resuspended in 2 mL of PBS and counted using a LUNA automated cell counter (Logos Biosystems). Cell suspension ranged between 1 to 2 x 10⁶ cells per sample for HepG2 and A549 cells and between 0.5 and 1.5 x 10⁶ cells per sample for SH-SY5Y cells. After counting the cells in each sample, the cells were centrifuged again for 5 min at 2000 rpm and the supernatant discarded. The cell pellet was dried overnight. To each dried pellet, 100 µL of concentrated nitric acid was added and the sample left for 24 h to be digested. Samples were then diluted with H2O and submitted for ICP-MS (Element XR, Thermo Fisher Scientific, Bremen, Germany) analysis to determine the copper content. The results were then normalized to the number of cells in each sample. Each experiment was repeated 3 times and the values and errors reported are the average of these 3 measurements.
Results and Discussion
CuNP Characterization in Cell Culture Media
Optimization of the copper suspensions to be used for cell culture testing was performed on the copper 40-60 nm sample. We were unable to produce stable dispersions of the material in water with either bath or probe sonication. We then decided to disperse the particles directly in
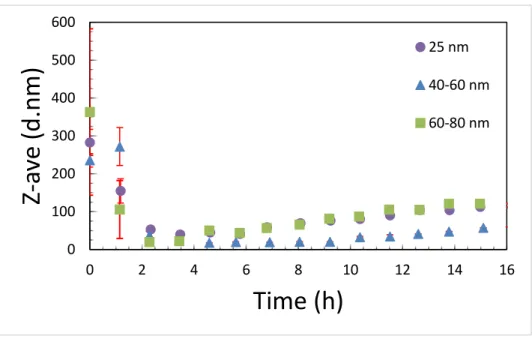
media. Sonication can damage proteins in serum, and so we decided to test if the presence of serum affected the dispersability of the particles in cell culture medium or whether the serum could be added after the particles were dispersed. Figure 1 shows a comparison between particles with and without serum in the media. There is a very clear improvement in the dispersability of the particles when serum is present. We then sought to determine if there was a difference between probe and bath sonication methods. In figure 2 it is shown that there was no significant difference between the two sonication methods. We also noted that the age of the particle dispersions was critically important. Fresh suspensions had to be prepared immediately prior to the start of each experiment (Figure 2). Particles agglomerates appear to rapidly breakdown over the first 3 hours in media suggesting that either the particles are dissolving, precipitating or a combination of the two (Figure 3). Then over the following 13 hours there is a slow increase in the observed hydrodynamic radius suggesting that either particles are reforming in media, or that precipitated particle agglomerates are breaking down and the individual particles are resuspending. It is also possible that the particles that are reforming may not be copper particles, but rather protein particles agglomerated together by copper ions or small copper complexes. This is observed in human biology, for example, with beta amyloid, where copper ions help drive the oligimerization of protein resulting amyloid plaques.11 There was also no observed precipitation of the particles
observable in the cuvette and sonication of the aged particle /media mixture did not result in a resuspension of any larger particles or agglomerates. While the 25 nm and 60-80 nm particles both end with average hydrodynamic diameters that are approximately 140 nm, the 40-60 nm particles end up measuring less than half that or approximately 60 nm in diameter.
The dissolution of particles from larger aggregates appears to be confirmed by TEM measurements as well. TEM images of the copper particles were measured upon suspension on
media with FBS and after 24 hours (Figure 4). While the images only show large agglomerates of particles, it appears that these agglomerates lose mass over time, leaving only a biomolecule shell after 24 hours, with the copper particles having dissolved from the agglomerates. TEM of both the 40-60 and 60-80 nm particles in media also only show large agglomerates where individual particles could not be resolved from the larger media-particle agglomerates (see supporting information).
Cytotoxicity of CuNPs
With copper nanoparticles dispersed in complete media, we then measured the cytotoxicity of the particle suspensions against 3 different cell lines using 4 different assays. As noted in the previous section, the particles likely dissolved over the time course of the experiment, so attempts were made to try and comprehend if the particles or the dissolved ions were responsible for the observed cytotoxicity. We also noted that at the highest concentrations of copper nanoparticles, large agglomerates could be seen settling on the bottom of the wells; however, after 24 hours, these agglomerates were no longer visible and had likely dissolved as was observed in the DLS samples (see supporting information).
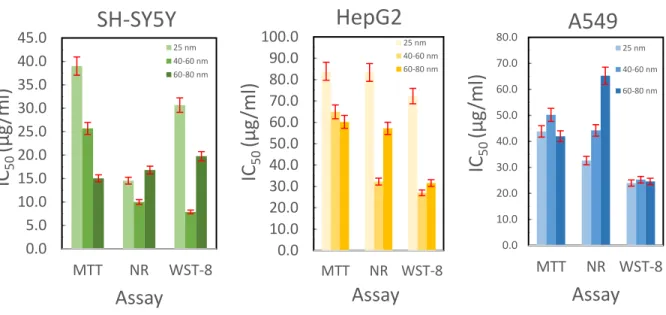
Figure 5 summarizes the results from the cytotoxicity assays. For A549 cells, there is no size dependence for the cytotoxicity using the MTT or WST-8 assays, though the magnitude of the measured result differs significantly between these two assays. The neutral red assay does show a size dependency with smaller particles being more cytotoxic. In HepG2 cells, these trends differ greatly. For the MTT assay there is a gradual trend showing that larger particles are more cytotoxic, while for the other two assays, the greatest cytotoxicity is observed for the 40-60 nm particles, with the 25 nm particles being significantly less cytotoxic. For the SH-SY5Y cells, the
dependent trend with smaller particles being less cytotoxic, while the other two assay exhibit the highest cytotoxicity for the 40-60 nm particles. From this data in is inconclusive if there is a size dependency for the particles on cytotoxicity. This is likely a result of the rapid dissolution kinetics that arise over the experimental time course and the different mechanisms the different cell lines have for processing copper ions and copper complexes that form in media.
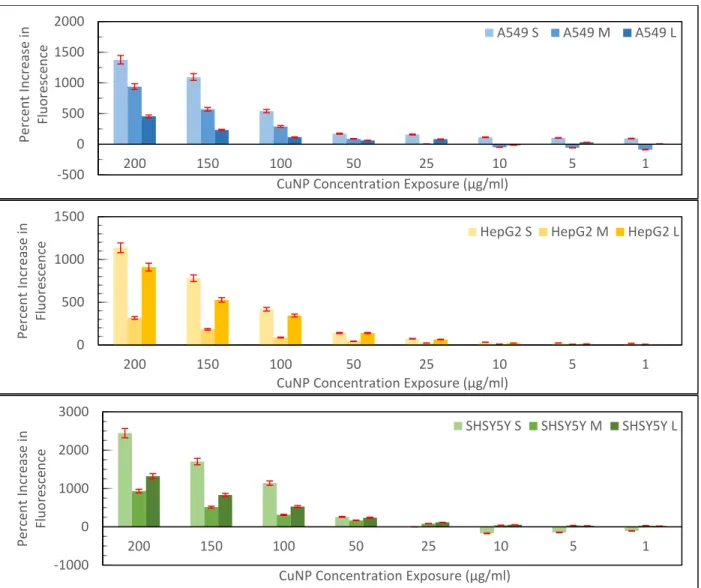
We next examined the production of reactive oxygen species (ROS) in media (Figure 6). Using the DCFDA assay, we measured the production of ROS at each concentration. Here we see some interesting correlations to the cytotoxicity data. In both HepG2 and SH-SY5Y cells, the lowest ROS production occurs for the 40-60 nm particles with ROS production increasing in a dose dependent manner. These particles are also the most cytotoxic in the WST-8 and neutral red assays, suggesting that the MTT assay may not be an effective assay for accurately measuring the cytotoxicity of CuNPs and that higher levels of ROS production for the smaller and larger nanoparticles correlates with lower cytotoxicity in these cell lines. For the A549 cells; however, there appears to be a correlation between greater ROS production and increased cytotoxicity as measured by the neutral red assay with smaller particles being more cytotoxic. For this cell line, neither the MTT nor WST-8 assays showed any size dependent toxicity. Both of these assays are mitochondrial activity assays and thus both may not be appropriate for measuring the cytotoxicity of CuNPs in this cell line as dissolved copper ions may disrupt the assay in a non-toxic manner, making the neutral red assay a superior assay for cytotoxicity measurements. To truly assess if there is a size dependent link, and how it correlates to ROS production, a greater number of cell lines still need to be tested to establish more consistent trends in the data.
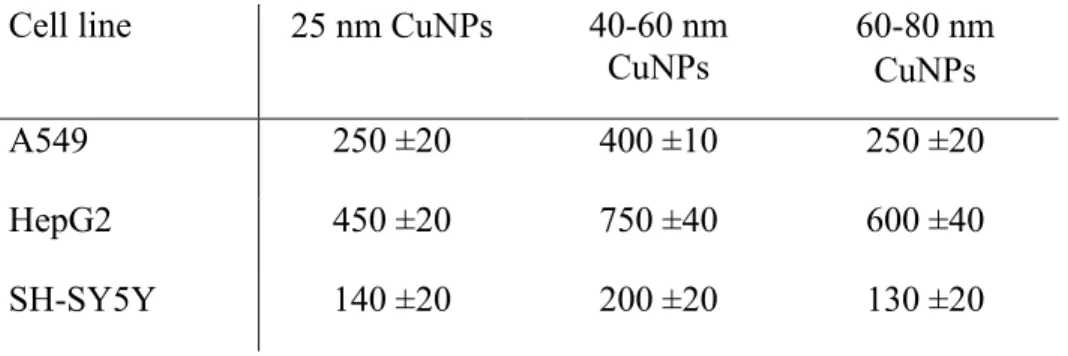
We next sought to determine if the changes in cytotoxicity data with media could be correlated to changes in particle uptake. There is a general trend in uptake between cell lines (Table 1) with HepG2 cells taking up twice as much copper as A549 cells, and about 3 times as much as SH-SY5Y cells. We have previously reported that SH-SY5Y cells take up less silver than other cell lines as well, so this appears to be a consistent observation for these cells with other nanoparticles as well.26 For all three cell lines, the highest uptake occurs for the 40-60 nm particles. In at least two of the cell lines, these particles were also the most cytotoxic and suggest that this intermediate sized particle is uniquely able to be taken up into the cells more readily than smaller or larger particles resulting in more acute cytotoxicity, at least in the HepG2 and SH-SY5Y cells. We also performed live cell imaging of CuNPs in A549 cells. Here the large particle agglomerates could be seen being taken up by cells rapidly in the first 24 hours.
Conclusions
Copper nanoparticles are useful chemical additives to many products owning in large part to their antimicrobial activity. Here we have shown that while all copper nanoparticles tested exhibit cytotoxicity against all three cell lines tested, particles in the 40-60 nm range appear to affect the cells more acutely and thus efforts to use smaller or larger particles may alleviate possible cytotoxic concerns. It appears that the particles rapidly dissolve in media and that over time, large agglomerates of protein with copper particles or ions are observed. Further, we determined that while several assays can be used to monitor the cytotoxicity of CuNPs, the neutral red assay appears to be superior to the mitochondrial activity assays – MTT and WST-8. While there is a concentration dependent increase in fluorescence in the DCFDA assay, the correlation with cytotoxicity between particles of different sizes is inconsistent between cell lines; however, the 40-60 nm particles do appear to cause less oxidative stress yet are also more cytotoxic in two of
the cell lines converse to the positive relationship in A549 cells where smaller 25 nm particles are both more cytotoxic and produce more oxidative stress. The 40-60nm particles are also more readily taken up by cells. More data is required to determine if ROS is a causative factor in the cytotoxicity of these particles.
Conflict of interest
There are no conflicts to declare.
Acknowledgements
J. Qian for performing TEM imaging.
Associated Content
Supporting Information. The following files are available free of charge.
TEM images of copper nanoparticles and bright field images of cells treated with particles. (PDF)
Corresponding Author
David C. Kennedy
Author Contributions
The manuscript was written through contributions of all authors. All authors have given approval to the final version of the manuscript.
Funding Sources
References
1. Djoko, K. Y.; Ong, C.-l. Y.; Walker, M. J.; McEwan, A. G., The Role of Copper and Zinc Toxicity in Innate Immune Defense against Bacterial Pathogens. J. Biol.Chem. 2015, 290, 18954-18961.
2. Opazo, C. M.; Greenough, M. A.; Bush, A. I., Copper: from Neurotransmission to Neuroproteostasis. Front. Aging Neurosci. 2014, 6, 143-143.
3. Rodriguez-Castro, K. I.; Hevia-Urrutia, F. J.; Sturniolo, G. C., Wilson's Disease: A Review of What We Have Learned. World J. Hepatol. 2015, 7 (29), 2859-2870.
4. Tümer, Z.; Møller, L. B., Menkes Disease. Eur. J. Hum. Genet. 2010, 18, 511-518. 5. Bonda, D. J.; Lee, H. G.; Blair, J. A.; Zhu, X.; Perry, G.; Smith, M. A., Role of Metal Dyshomeostasis in Alzheimer's Disease. Metallomics 2011, 3, 267-70.
6. Fox, J. H.; Kama, J. A.; Lieberman, G.; Chopra, R.; Dorsey, K.; Chopra, V.; Volitakis, I.; Cherny, R. A.; Bush, A. I.; Hersch, S., Mechanisms of Copper Ion Mediated Huntington's
Disease Progression. PloS one 2007, 2, e334.
7. Siggs, O. M.; Cruite, J. T.; Du, X.; Rutschmann, S.; Masliah, E.; Beutler, B.; Oldstone, M. B. A., Disruption of Copper Homeostasis Due to a Mutation of Atp7a Delays the Onset of Prion Disease. Proc. Natl. Acad. Sci. 2012, 109, 13733-13738.
8. Yen, C.-F.; Harischandra, D. S.; Kanthasamy, A.; Sivasankar, S., Copper-Induced Structural Conversion Templates Prion Protein Oligomerization and Neurotoxicity. Sci. Adv.
2016, 2, e1600014.
9. Gaggelli, E.; Kozlowski, H.; Valensin, D.; Valensin, G., Copper Homeostasis and Neurodegenerative Disorders (Alzheimer's, Prion, and Parkinson's Diseases and Amyotrophic Lateral Sclerosis). Chem. Rev. 2006, 106, 1995-2044.
10. Montes, S.; Rivera-Mancia, S.; Diaz-Ruiz, A.; Tristan-Lopez, L.; Rios, C., Copper and Copper Proteins in Parkinson's Disease. O xid. Med. Cell. Longev. 2014, 2014, 15.
11. Mathys, Z. K.; White, A. R., Copper and Alzheimer's Disease. Adv. Neurobiol. 2017, 18, 199-216.
12. Shukla, A.; Dasgupta, N.; Ranjan, S.; Singh, S.; Chidambram, R., Nanotechnology Towards Prevention of Anaemia and Osteoporosis: from Concept to Market. Biotechnol. Biotechnol. Equip. 2017, 31, 863-879.
13. DeAlba-Montero, I.; Guajardo-Pacheco, J.; Morales-Sánchez, E.; Araujo-Martínez, R.; Loredo-Becerra, G. M.; Martínez-Castañón, G.-A.; Ruiz, F.; Compeán Jasso, M. E.,
Antimicrobial Properties of Copper Nanoparticles and Amino Acid Chelated Copper
Nanoparticles Produced by Using a Soya Extract. Bioinorg. Chem. Appl. 2017, 2017, 1064918-1064918.
14. Pariona, N.; Mtz-Enriquez, A. I.; Sánchez-Rangel, D.; Carrión, G.; Paraguay-Delgado, F.; Rosas-Saito, G., Green-Synthesized Copper Nanoparticles as a Potential Antifungal against Plant Pathogens. RSC Adv. 2019, 9, 18835-18843.
15. Tatariants, M.; Yousef, S.; Sakalauskaitė, S.; Daugelavičius, R.; Denafas, G.; Bendikiene, R., Antimicrobial Copper Nanoparticles Synthesized from Waste Printed Circuit Boards Using Advanced Chemical Technology. J. Waste Manage. 2018, 78, 521-531.
16. Kruk, T.; Szczepanowicz, K.; Stefanska, J.; Socha, R. P.; Warszynski, P., Synthesis and Antimicrobial Activity of Monodisperse Copper Nanoparticles. Colloids Surf. B 2015, 128, 17-22.
17. Ramyadevi, J.; Jeyasubramanian, K.; Marikani, A.; Rajakumar, G.; Rahuman, A. A., Synthesis and Antimicrobial Activity of Copper Nanoparticles. Mat. Lett. 2012, 71, 114-116. 18. Ruparelia, J. P.; Chatterjee, A. K.; Duttagupta, S. P.; Mukherji, S., Strain Specificity in Antimicrobial Activity of Silver and Copper Nanoparticles. Acta biomaterialia 2008, 4, 707-16. 19. Ingle, A. P.; Duran, N.; Rai, M., Bioactivity, Mechanism of Action, and Cytotoxicity of Copper-Based Nanoparticles: a Review. Appl. Microbiol. Biotechnol. 2014, 98, 1001-9.
20. Adisa, I.; Pullagurala, V.; peralta-videa, J.; Dimkpa, C.; Gardea-Torresdey, J.; White, J., Recent Advances in Nano-Enabled Fertilizers and Pesticides: A Critical Review of Mechanisms of Action. Environ. Sci.: Nano 2019, 6, 2002-2030.
21. Parada, J.; Rubilar, O.; Diez, M. C.; Cea, M.; Sant’Ana da Silva, A.;
Rodríguez-Rodríguez, C. E.; Tortella, G. R., Combined Pollution of Copper Nanoparticles and Atrazine in Soil: Effects on Dissipation of the Pesticide and on Microbiological Community Profiles. J Hazard. Mater. 2019, 361, 228-236.
22. Scott, A.; Prasad, K.; Chwalibog, A.; Sawosz, E., Copper Nanoparticles as an Alternative Feed Additives in Poultry Diet: A Review. Nanotechnol. Rev. 2017.
23. Scott, A.; Vadalasetty, K. P.; Łukasiewicz, M.; Jaworski, S.; Wierzbicki, M.; Chwalibog, A.; Sawosz, E., Effect of Different Levels of Copper Nanoparticles and Copper Sulphate on Performance, Metabolism and Blood Biochemical Profiles in Broiler Chicken. J. Anim. Physiol. Anim. Nutr. 2018, 102, e364-e373.
24. Song, L.; Vijver, M. G.; Peijnenburg, W. J.; Galloway, T. S.; Tyler, C. R., A
Comparative Analysis on the In Vivo Toxicity of Copper Nanoparticles in Three Species of Freshwater Fish. Chemosphere 2015, 139, 181-9.
25. Lee, I. C.; Ko, J. W.; Park, S. H.; Shin, N. R.; Shin, I. S.; Moon, C.; Kim, J. H.; Kim, H. C.; Kim, J. C., Comparative Toxicity and Biodistribution Assessments in Rats Following Subchronic Oral Exposure to Copper Nanoparticles and Microparticles. Part. Fibre Toxicol.
2016, 13, 56.
26. Kennedy, D. C.; Gies, V.; Jezierski, A.; Yang, L., Changes in the physical properties of silver nanoparticles in cell culture media mediate cellular toxicity and uptake. J. Nanopart. Res.
2019, 21, 132.
27. Kennedy, D. C.; Gies, V.; Jezierski, A.; Yang, L., Effects of human serum on the stability and cytotoxicity of silver nanoparticles. SN Appl.Sci. 2019, 1, 1510.
28. Repetto, G.; del Peso, A.; Zurita, J. L., Neutral red uptake assay for the estimation of cell viability/cytotoxicity. Nat. protoc. 2008, 3, 1125-31.
Abbreviations
CuNP copper nanoparticle; DCFDA 2',7' –dichlorofluorescin diacetate; MTT
(3-(4,5-dimethylthiazol-2-yl)-2,5-diphenyltetrazolium bromide; Water Soluble Tetrazolium WST; IC50
the half maximal inhibitory concentration; ROS reactive oxygen species; FBS fetal bovine serum; TEM transmission electron microscopy.
0
0 500 1000 1500 2000 2500 3000 3500-CuNP
+CuNP
Z-av
e (
d.
nm)
-FBS
+FBS
Figure 1. The Z-average of a 10 minute probe sonicated 20µg/ml suspension of 40-60nm CuNPs
in media with and without FBS. The conditions were replicated in media without CuNPs as a control.
0 25 50 75 100 125 150 175 200 225 250 275 300 325 350 375 400 425 450
Z-av
e
(d.
nm
)
0hr
22hr
Figure 2. Comparison of the Z-average between complete media, a CuCl2 solution in
media 20 µg Cu/ml, a bath sonicated 20 µg/ml 40-60nm CuNP suspension, and a probe sonicated 20 µg/ml 40-60nm CuNP suspension immediately after and 24 hours after sonication. 10 minutes of sonication was used each time.
0 100 200 300 400 500 600 0 2 4 6 8 10 12 14 16
Z-av
e
(d.nm)
Time (h)
25 nm 40-60 nm 60-80 nmFigure 3. The Z-average diameter of 10 minute bath sonicated 20 µg/ml CuNP suspensions in media over a 16 hour
period with measurements made approximately every hour. After 16 hours, no changes were observed out to 48 hours.
Figure 4. TEM images of 25 nm particles suspended in cell culture media imaged immediately after particle
Figure 5. Cytotoxicity data for copper nanoparticles in compared using three assays in three cell lines.
Error bars are calculated as standard error form three repetitions each containing six replicates for each measurement. 0.0 5.0 10.0 15.0 20.0 25.0 30.0 35.0 40.0 45.0 MTT NR WST-8
IC
50(µg
/m
l)
Assay
SH-SY5Y
25 nm 40-60 nm 60-80 nm 0.0 10.0 20.0 30.0 40.0 50.0 60.0 70.0 80.0 90.0 100.0 MTT NR WST-8IC
50(µg
/m
l)
Assay
HepG2
25 nm 40-60 nm 60-80 nm 0.0 10.0 20.0 30.0 40.0 50.0 60.0 70.0 80.0 MTT NR WST-8IC
50(µg
/m
l)
Assay
A549
25 nm 40-60 nm 60-80 nmFigure 6. DCFDA results measured for all three nanoparticle sizes in three different cell lines across eight
concentrations. Percent increase calculated by calculating percent increase of fluorescence relative to 0 ug/ml on plate at 0hr (right after applying dilution) and after 1hr of incubation and then subtracting percent increase at 1hr and 0hr.
-500 0 500 1000 1500 2000 200 150 100 50 25 10 5 1 Perc en t In cre ase in Fluo re sce n ce
CuNP Concentration Exposure (µg/ml)
A549 S A549 M A549 L
0 500 1000 1500 200 150 100 50 25 10 5 1 Perc en t In cre ase in Fluo re sce n ce
CuNP Concentration Exposure (µg/ml)
HepG2 S HepG2 M HepG2 L
-1000 0 1000 2000 3000 200 150 100 50 25 10 5 1 Perc en t In cre ase in Fluo re sce n ce
CuNP Concentration Exposure (µg/ml)
Cell line 25 nm CuNPs 40-60 nm CuNPs 60-80 nm CuNPs A549 250 ±20 400 ±10 250 ±20 HepG2 450 ±20 750 ±40 600 ±40 SH-SY5Y 140 ±20 200 ±20 130 ±20
Table 1. Copper uptake analysis was performed on cell pellets treated with CuNPs for 24 h in cell culture
media. Value reported are in ng copper/106 cells with calculated standard errors from three repeated