Publisher’s version / Version de l'éditeur:
Lab on a Chip, 17, 19, pp. 3318-3330, 2017-08-24
READ THESE TERMS AND CONDITIONS CAREFULLY BEFORE USING THIS WEBSITE. https://nrc-publications.canada.ca/eng/copyright
Vous avez des questions? Nous pouvons vous aider. Pour communiquer directement avec un auteur, consultez la première page de la revue dans laquelle son article a été publié afin de trouver ses coordonnées. Si vous n’arrivez pas à les repérer, communiquez avec nous à [email protected].
Questions? Contact the NRC Publications Archive team at
[email protected]. If you wish to email the authors directly, please see the first page of the publication for their contact information.
Archives des publications du CNRC
This publication could be one of several versions: author’s original, accepted manuscript or the publisher’s version. / La version de cette publication peut être l’une des suivantes : la version prépublication de l’auteur, la version acceptée du manuscrit ou la version de l’éditeur.
For the publisher’s version, please access the DOI link below./ Pour consulter la version de l’éditeur, utilisez le lien DOI ci-dessous.
https://doi.org/10.1039/C7LC00785J
Access and use of this website and the material on it are subject to the Terms and Conditions set forth at
Anisotropic permeability in deterministic lateral displacement arrays
Vernekar, Rohan; Krüger, Timm; Loutherback, Kevin; Morton, Keith; W.
Inglis, David
https://publications-cnrc.canada.ca/fra/droits
L’accès à ce site Web et l’utilisation de son contenu sont assujettis aux conditions présentées dans le site LISEZ CES CONDITIONS ATTENTIVEMENT AVANT D’UTILISER CE SITE WEB.
NRC Publications Record / Notice d'Archives des publications de CNRC:
https://nrc-publications.canada.ca/eng/view/object/?id=91843703-4f68-47c7-ba1f-5ae471a5307a
https://publications-cnrc.canada.ca/fra/voir/objet/?id=91843703-4f68-47c7-ba1f-5ae471a5307a
PAPER
Cite this: Lab Chip, 2017, 17, 3318
Received 26th July 2017, Accepted 22nd August 2017 DOI: 10.1039/c7lc00785j rsc.li/loc
Anisotropic permeability in deterministic lateral
displacement arrays†
Rohan Vernekar,
*
aTimm Krüger,
aKevin Loutherback,‡
bKeith Morton
cand David W. Inglis
dWe uncover anisotropic permeability in microfluidic deterministic lateral displacement (DLD) arrays. A DLD array can achieve high-resolution bimodal size-based separation of microparticles, including bioparticles, such as cells. For an application with a given separation size, correct device operation requires that the flow remains at a fixed angle to the obstacle array. We demonstrate via experiments and lattice-Boltzmann sim-ulations that subtle array design features cause anisotropic permeability. Anisotropic permeability indicates the microfluidic array's intrinsic tendency to induce an undesired lateral pressure gradient. This can cause an inclined flow and therefore local changes in the critical separation size. Thus, particle trajectories can become unpredictable and the device useless for the desired separation task. Anisotropy becomes severe for arrays with unequal axial and lateral gaps between obstacle posts and highly asymmetric post shapes. Furthermore, of the two equivalent array layouts employed with the DLD, the rotated-square layout does not display intrinsic anisotropy. We therefore recommend this layout over the easier-to-implement paral-lelogram layout. We provide additional guidelines for avoiding adverse effects of anisotropy on the DLD.
1 Introduction
Deterministic lateral displacement (DLD) is a hydrodynamic size-based particle separation technique. DLD is capable of high-resolution separation of particles up to five times smaller than the array gap (G in Fig. 1A). The DLD method1 can be used with various types of particles and has shown promise in separation and purification of bioparticles. This technique employs an inclined obstacle array in a micro-fluidic channel. The array inclination determines the particle separation size (critical radius, rc) in the DLD device. The con-ceptual framework for understanding and designing DLD ar-rays is based on the assumption that the locally averaged fluid flow direction remains at a fixed angle to the obstacle ar-ray incline throughout the device.
The fixed inclination creates a regular and uniform pat-tern of fluid flow lanes separated by stagnation streamlines in the microchannel. The width of the flow lane adjacent to every obstacle determines the critical particle radius,2rc. For dilute suspensions,3 particles larger than rc follow the array
inclination, and particles smaller than rcare advected along the fluid streamlines. In the high Péclet number limit (advec-tion dominating over diffusion), particle paths are determin-istic. The path for particles with a radius <rc is called the “zigzag” trajectory as the smaller particles move laterally back and forth while following the fluid streamlines. For particles of radius >rc, the path is named the “bump” trajectory; these particles are bumped into adjacent streamlines by an obsta-cle post at every row and follow the array inclination.
The DLD technique has the advantage of being label-free, relying solely on hydrodynamic and volume exclusion forces to achieve separation. This technique has been demonstrated for various applications such as microbead separation,1,2,4 fractionation of human blood components,5–9 separation of parasites or circulating tumour cells from human blood10–12 and deformability-based mapping of human blood.13–15 Addi-tionally, various array post shapes such as square, circle,
aSchool of Engineering, University of Edinburgh, King's Buildings, Edinburgh, UK.
E-mail: [email protected]; Tel: +44 (0)131 6505685
bLawrence Berkeley National Lab, Berkeley, CA, USA
cLife Sciences Division, National Research Council of Canada, 75 de Mortagne
Boulevard, Boucherville, QC J4B 6Y4, Canada
dDepartment of Engineering, Macquarie University, Sydney, Australia
†Electronic supplementary information (ESI) available. See DOI: 10.1039/ c7lc00785j
‡Current address: Berkeley Lights, Inc., Emeryville, CA, USA.
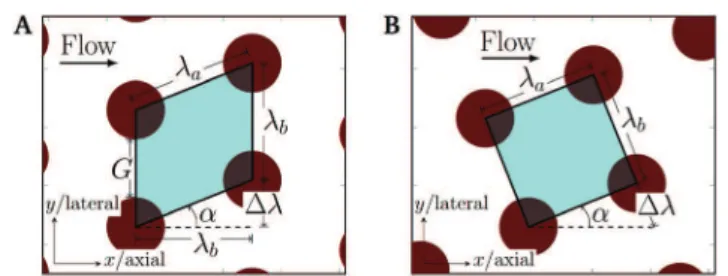
Fig. 1 (A) Row-shifted parallelogram layout and (B) rotated-square layout employed in DLD arrays. Note the lateral (up–down) and axial (flow-wise) directions.
Open Access Article. Published on 24 August 2017. Downloaded on 05/12/2017 16:02:36.
This article is licensed under a
Creative Commons Attribution 3.0 Unported Licence.
View Article Online
triangle (right/equilateral), I-shape, L-shape etc. have been employed to obtain improved DLD separation.16–19
Across all published works, array posts of any shape are arranged in one of these two layouts: row-shifted parallelo-gram (Fig. 1A) or rotated-square layout (Fig. 1B). In the paral-lelogram layout, adjacent rows of posts are shifted by a fixed amount Δλ, which results in a parallelogram unit cell, and the array has an inclination of tan−1 (Δλ/λ
b) with respect to the horizontal flow. In the rotated-square layout, a Cartesian periodic array (unit square cell length λa = λb) is rotated by the required angle α = tan−1(Δλ/λ
b). Therefore, the ratio Δλ/λb determines the array inclination and is termed row shift frac-tion ε. When ε is given as 1 over an integer (ε = 1/N), bimodal particle separation is expected.21 N gives the periodicity of the array.
Both parallelogram and rotated-square layouts are equally popular for separation applications; several authors5–8,16,17,20–24 have used parallelogram arrays, and others1,13,18,19,25,26 have employed the rotated-square layout. Parallelogram arrays are attractive and easier to design be-cause they have a planar boundary (interface) that is perpen-dicular to the axial flow direction. This is also an advantage when placing arrays with different separation angles in series (cascaded arrays). However, the consequences of the differ-ences between the two layouts have not been understood, and these are used interchangeably.
We show that the parallelogram layout, unlike the rotated-square layout, suffers from certain drawbacks (section 2). These disadvantages include array regions where particle sep-aration does not occur at all or has a different critical size or even a negative separation angle.21,27,28 This would lead to particles not separating into distinct bands according to the size range and not exiting at the intended outlet ports.
Through extensive lattice-Boltzmann simulations,29 we show that the issues with the parallelogram layout arise from array-induced anisotropy (sections 3 and 4). Anisotropy is the tendency of an array to induce a lateral pressure drop to the main flow direction in a device. This anisotropic lateral pres-sure induces a secondary background re-circulatory flow in the presence of certain design features, which we call “en-ablers”. The secondary flow causes local deviations in the pri-mary flow field such that the flow no longer remains parallel to the side walls everywhere in the device. Thus, away from the device side walls, the primary flow tilts and this causes spatially varying critical separation size, which impairs deter-ministic separation.
We discover that an interface gap (before/after array sec-tions) and large jumps in the array inclinations with cas-caded arrays act as enablers (section 4.4). Such features are common in DLD devices and should be avoided. We also find that anisotropy becomes acute when unequal axial and lateral array gaps are employed30and when highly asymmetric post shapes are used (section 5). However, we find that the rotated-square layout with circular posts possesses no aniso-tropy. Array anisotropy can cause significant alterations in expected particle separation trajectories and needs to be
accounted for by the design of microfluidic devices that use obstacle arrays31–33(section 6).
2 Consequences of array anisotropy
In this section, we present experimental evidence of flow tilt and its consequences on particle trajectories in the parallelo-gram array layout. We also observe that in an equivalent rotated-square layout, the flow does not tilt and remains along the horizontal.
2.1 Parallelogram layout
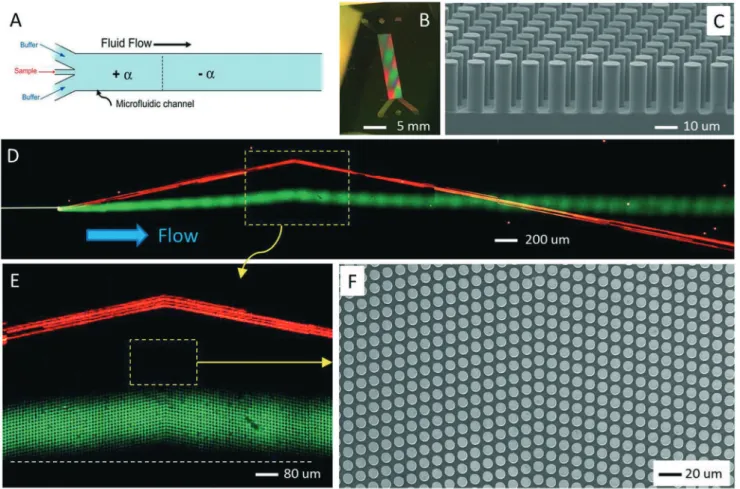
In an experiment intended for particle separation and parti-cle crossing, we observed a significant tilt of the fluid flow away from the horizontal at the interface between two DLD array inclinations. As detailed in Fig. 2, a jet of red fluores-cent, 2.7 μm beads mixed with green fluorescein dye was injected into the DLD array between two, co-flowing streams of clear buffer. The 2.7 μm beads immediately follow the standard bump mode, but the fluorescent dye deviates from the horizontal in the region around the interface between positive and negative array inclinations. The positions of these two array sections along the length of the device are shown schematically in Fig. 2A. The DLD design used here is based on a parallelogram-type array layout (Fig. 2F) with 11 μm horizontal and vertical post–pitch. The array inclinations are set to α = ±11.3° (ε = 1/5). The cylindrical posts are 7.3 μm in diameter giving a lateral gap between posts of 3.7 μm. The DLD devices were fabricated on polished silicon sub-strates (Fig. 2B) using standard photolithography techniques and deep reactive ion etching to create vertical sided posts to a depth of 18 μm. Sequential parallelogram array sections are placed directly one after another without any interface struc-ture between opposite inclinations.
Fig. 2D is a series of time exposure images captured with a colour CCD camera and then stitched together to recon-struct the overall motion of the beads and dye from the injec-tion point through to the second array secinjec-tion. The 2.7 μm beads (red) clearly track in the bump mode, following the ar-ray inclination. However, the path of the fluorescent dye (green) deviates noticeably from the horizontal. From the zoomed-in image in Fig. 2E, we can see that the fluorescent green dye shows a distinct tilt, preferentially following the prevailing array inclination. This tilt is especially noticeable as the dye advects across the interface between the two sec-tions. This junction between the two arrays is shown in detail in the top view SEM image in Fig. 2F. This experiment cap-tures an anisotropic flow tilt in the parallelogram-type DLD device layout. Here, the trajectory of particles in the bump mode remains unaffected because the particle size of 2.7 μm is larger than the critical particle size for this device of dc= 2.4 μm. But the anisotropic flow tilt can perturb trajectories of smaller particles travelling in the zigzag mode as shown in Fig. 3.
In a second experiment, the same DLD device design was used, but with an input jet of beads with different diameters.
Open Access Article. Published on 24 August 2017. Downloaded on 05/12/2017 16:02:36.
This article is licensed under a
Fig. 3A captures the separation of 0.5 μm and 2.7 μm beads along the length of the device (Video S1†). In this case, 0.5 μm green beads which are nevertheless well below the critical particle size for bumping (dc = 2.4 μm) are also perturbed from the horizontal as they approach and leave the junction between the two array inclinations. Fig. 3B provides a zoomed-in view of the interface region (Video S2†). To further study the impact on bead trajectories, 1.9 μm green fluores-cent beads were added to the input bead mixture. An intensi-fied, monochrome CCD camera was used to capture the dy-namic motion of beads with all three diameters as they track across the interface. Fig. 3C is a frame sum from that video which clearly shows a transition from zigzag to bump-type motion for 1.9 μm beads near the interface (Video S3†). The inset (Fig. 3D) is again a colour CCD exposure overlay follow-ing the paths taken by the particles with three sizes, well be-yond the interface, at the cross-over point. Here, the distinct bump mode trajectories of the red 2.7 μm beads are seen alongside the brighter 1.9 μm green beads which have clearly reverted back to zigzag motion (a similar motion for the 0.5 μm bead stream is also just visible).
It is normally expected that all beads below the critical particle size for bumping should follow the zigzag path around array posts and transit the overall device horizontally. However, as we can see in Fig. 3, that while the beads initially track horizontally, the particles begin to mimic a bump tra-jectory as they approach the interface between the two sec-tions, tracing the local array inclination (additional experi-mental evidence for anisotropic particle bumping is shown in Fig. S1†). Particles start to bump upwards at the end of the left array section, then immediately downwards at the begin-ning of the second array section. The particles then return to a horizontal trajectory as they continue into the middle of the second array. We suspect that these unusual and clearly undesired particle paths are the consequence of the lateral anisotropic flow acting on particle trajectories and that this behaviour stems from the inherent anisotropic permeability of the parallelogram layout. The average flow direction no longer remains horizontal and tilts towards the array inclina-tion. As we shall see later with the help of simulations (sec-tions 4.2 and 4.3), this flow tilt and the resulting reduction in the critical particle size become more pronounced near the
Fig. 2 Device for demonstrating anisotropic flow tilt in the parallelogram layout. (A) Schematic of a DLD device layout having two sections with both positive and negative array inclinations. (B) Photo of the DLD device, as-etched into a silicon substrate. (C) Cross-sectional SEM image of the DLD array constructed from cylindrical posts on a 11 μm pitch parallelogram layout with an inclination of α = ±11.3° and a 3.7 μm lateral gap be-tween posts. (D) Time exposure overlay showing the flow and separation of a mixed jet of fluorescent dye (green) and microbeads (2.7 μm, red) through the DLD array with the direction of the average flow indicated by the blue arrow. (E) Zoomed-in image showing flow deviation of the dye, near the interface between positive and negative array inclinations. The dashed (white) line indicates the horizontal direction. (F) Top-view SEM im-age showing the interface junction between the oppositely inclined array sections.
Open Access Article. Published on 24 August 2017. Downloaded on 05/12/2017 16:02:36.
This article is licensed under a
Fig. 3 Device demonstrating the consequences of array anisotropy on bead trajectories. (A) Time exposure overlay (colour camera) showing a mixed jet of 0.5 μm (green) and 2.7 μm (red) microbeads injected into the same DLD device design as shown in Fig. 2 (α = ±11.3°, lateral gap = 3.7 μm). (B) Zoomed-in image (colour camera, time exposure) showing the bump mode trajectory of the 2.7 μm beads and the path deviation for zigzag mode 0.5 μm beads near the interface between positive and negative arrays. The dashed (white) line indicates the horizontal direction. (C) Video frame sum (monochrome camera) of bead trajectories through the interface for a mixed bead jet that now includes 1.9 μm green fluorescent beads along with the 0.5 μm and 2.7 μm beads. Here 1.9 μm beads are expected to move in the “zigzag” mode through both sections (dc= 2.4 μm), but undergo anisotropic “bump” mode movement in
the vicinity of the interface. Note that an intensified monochrome CCD camera was used to capture the dynamics of individual beads (SOM video 2). The in-set (D, colour) details the crossover region beyond the interface in the negative inclination section. It shows that the 1.9 μm beads (brighter green) return to their expected zigzag mode downstream of the interface. (E) Time exposure (colour) detailing the addition of 2.3 μm beads (also green), which are close to the critical particle size for bumping. Notably, the 2.3 μm beads appear to be locked in the anisotropic “bump” mode well beyond the interface.
Open Access Article. Published on 24 August 2017. Downloaded on 05/12/2017 16:02:36.
This article is licensed under a
interface between array sections. Such unintended particle behaviour in the zigzag mode is detrimental to separation, especially for high-resolution applications.1,27,33,34
2.2 Rotated-square layout
In DLD devices with the rotated-square array layout, we do not observe significant flow deviation from the horizontal near the interface between two oppositely inclined array sec-tions. The rotated-square DLD device shown in Fig. 4 has a positively inclined first section followed by a negatively in-clined second section, following the form in Fig. 3. In this ex-periment, the array inclination is set to α = ±5.71° or ε = 1/10. The arrays are constructed on a denser 8 μm centre-to-centre pitch with a lateral gap of just 2.4 μm between 5.6 μm cylin-drical posts (dc= 1 μm). In addition, sets of rounded rectan-gle structures were used here to match the adjacent sections of the rotated-square arrays (unlike parallelogram arrays which match intrinsically). Fig. 4A shows an integrated image of 0.5 μm and 1.9 μm green fluorescent beads moving across the mid-chip interface (Video S4†). At this point, the beads have already undergone lateral separation, following injection as a bead mixture into the DLD array as a narrow hydrody-namic jet. The 1.9 μm diameter beads are larger than the crit-ical particle size and follow the canoncrit-ical bump mode as expected, while the smaller, 0.5 μm beads follow zigzagging streamlines and act as fluid flow tracers.
Fig. 4B highlights individual particle paths of bump mode beads as they transit the interface. Note the switch between a bumping path along the upper side of the posts in the posi-tively inclined array and that to the underside of the posts in
the negatively inclined array. Fig. 4C similarly shows the aver-aged paths of 0.5 μm tracer beads as they cross the interface; the rotated-square geometry is clearly highlighted as the beads in the zigzag mode span all available streamline slots. The overall bead path for zigzag mode particles, which flows along the applied pressure gradient, does not deviate from the horizontal significantly (dashed line in Fig. 4A). This sug-gests the absence of anisotropy in the rotated-square layout and tolerance to the unintended particle trajectories observed for subcritical particle sizes in the parallelogram layout.
3 Nature of array-induced anisotropy
Anisotropic permeability35is the tendency of an array to in-duce a pressure gradient along the lateral axis (vertical in Fig. 1). When using an incompressible fluid, this pressure gradient is only problematic when it induces flow tilt along the lateral direction.27,28 Fig. 2 and 3 demonstrate examples of such anisotropy effects, where the flow tilts along the array inclination. The varying flow tilt reduces the effective ε locally and therefore also reduces the critical radius rc. This change can cause unexpected particle bumping for particles expected to be in the zigzag mode, in the sections of the array. To avoid undesired spatially dependent rcand unintended parti-cle trajectories, it is crucial to understand and control sources of anisotropy.
In 2007, James C. Sturm hypothesised that the parallelo-gram layout may display greater anisotropy than the rotated-square layout.36This hypothesis was drawn from the under-standing of an optical phenomenon known as birefrin-gence.37Optical birefringence, as observed in materials such
Fig. 4 Bead paths in rotated-square DLD arrays. (A) Time exposure (colour) of 1.9 μm (green) and 0.5 μm (green) fluorescent bead separation in a DLD array with the rotated-square layout. Similar to the parallelogram device in Fig. 3, this DLD has two adjacent array sections with positive and negative inclinations (α = ±5.71° or ε = 1/10). Both sections have dc= 2.4 μm (8 μm pitch, 2.4 μm lateral gaps). Insets (B and C, colour) detail bead
trajectories across the interface region for both the 1.9 μm bump mode beads as they cross the interface and the overall path of the 0.5 μm zig-zagging beads. For the tracer beads in the zigzag mode, no significant deviation from the horizontal (dashed white line) is observed. (D) A tilted SEM image of the interface structure used here to match the two adjacent rotated-square arrays.
Open Access Article. Published on 24 August 2017. Downloaded on 05/12/2017 16:02:36.
This article is licensed under a
as calcite, is caused by anisotropic optical transmission. In calcite, it is due to its non-cubic (parallelogram) unit cell. In contrast, optical materials with cubic unit cells show no an-isotropic transmission and no birefringence. The analogy be-tween optics and fluidics serves as a springboard for further investigation into array anisotropy in both of the array lay-outs that are usually treated as equivalent.
4 Mapping anisotropic permeability
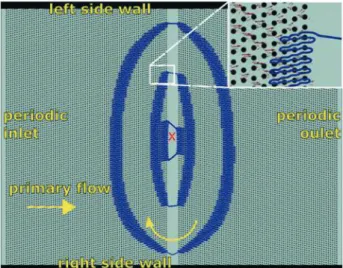
We put the hypothesis that the parallelogram layout pos-sesses greater anisotropic permeability than the rotated-square layout to the test by using high-resolution lattice-Boltzmann simulations in the Stokes flow limit. Simulations are run in two dimensions and carried out over a single post of the array domain (400 × 400 lattice cells) under periodic boundary conditions (section 7.1). This approach simulates flow over a central post of an infinite obstacle array. We also carry out large-domain full-array simulations, with as many as 152 × 120 posts in the device in order to investigate the flow tilt due to array anisotropy.
4.1 Anisotropic lateral pressure drop
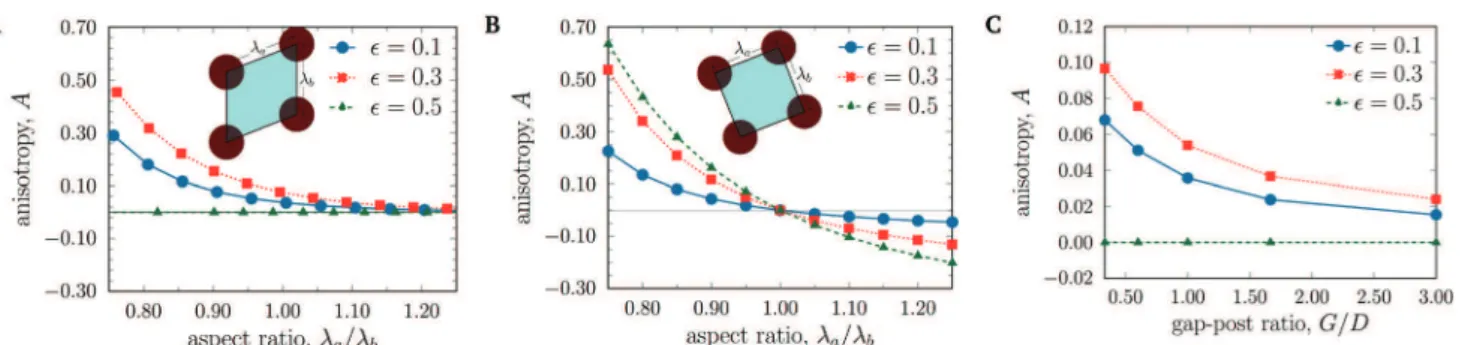
For the purpose of generality, we begin with a symmetric cir-cular post shape with a gap-to-post diameter ratio (G/D) of unity. The simulated device gap and post diameter are 10 μm each (post–pitch distance, λ = 20 μm). Simulations are carried out over the entire range of the row shift fraction (ε = 0.0 to 1.0, at 0.1 increments) for both the parallelogram and rotated-square layouts.
Using periodic boundary conditions to simulate a unit cell (i.e. a single post) of an array possessing anisotropic perme-ability would result in non-zero average lateral fluid velocity. In real microfluidic devices, this lateral flow is restricted by microchannel side walls. Therefore, we quantify array aniso-tropy by measuring the lateral pressure drop that is required to maintain the zero average lateral fluid flow. We define anisotropy as the dimensionless ratio of the induced lateral pressure gradient to the imposed pressure gradient along the flow direction (Fig. 5A). Fig. 5B shows anisotropy values mapped for various inclinations (ε) for both the parallelo-gram and rotated-square layouts. The sign of the anisotropy
value indicates the direction of the lateral pressure drop; a positive sign means that the lateral pressure drop is in the same direction as the row shift.
For the parallelogram array, the anisotropy shows sinusoi-dal dependence on ε. Moreover, the absolute anisotropy values are equal for ε and 1 − ε. This follows from the fact that a parallelogram array with 0.5 < ε < 1.0 is equivalent to one with 1 − ε, but with a negative row shift. We observe a maximum anisotropy of ≈5.6% occurring at ε = 0.25 for the parallelogram array.
The rotated-square layout, however, exhibits vanishing anisotropy for all tested values of ε. This corroborates the hy-pothesis of the rotated-square layout having an advantage over the parallelogram layout in avoiding anisotropic effects.
4.2 Anisotropic flow tilt
Array anisotropy can only affect particle trajectories when it causes a tilt in the flow direction. For the parallelogram lay-out with symmetric circular posts, the direction of anisotropy is the same as the row shift. Therefore, the anisotropic flow tilt occurs towards the array incline and causes a decrease in the effective array inclination.
To demonstrate the reduction of the effective inclination, we simulated the mid-section of two DLD devices (Fig. 6), one with the parallelogram layout (Fig. 6B) and the other with the rotated-square layout (Fig. 6C). Each device has 152 circular posts along the flow and 120 posts along the trans-verse direction. The post diameter is 10 μm, and the gap be-tween posts is 10 μm. The simulated domain is 3.2 mm × 2.4 mm (3200 × 2400 lattice cells) with periodic inlet and outlet flow conditions (Fig. 6A). The flow is driven by a pressure gra-dient along the axial direction. Each device has two array sec-tions with opposite inclinasec-tions. The left section has a posi-tive array inclination of ε = 0.2 and the right section has an inclination of ε = −0.2. Both sections are separated by a gap of ≈4 posts (80 μm).
Flow streamlines (blue lines) are shown (Fig. 6B and C) for both devices. In the parallelogram device (Fig. 6B), the streamline nearest to the right side wall remains horizontal throughout. As they move away from the right side wall to-ward the centreline of the device, the streamlines start tilting along the prevalent array inclination. Already ten posts away from the right side wall, this effect becomes important and the tilt continues to increase as they move further away from the side wall. In the central region of the device (typically the particle separation zone), the flow is no longer parallel to the side walls of the device. We also observe a similar behaviour at the left side wall (data not shown).
Around the centreline, the effective array inclination is re-duced from 1/5 to ≈1/7. This change in ε occurs gradually with position and is therefore rarely equal to one over an integer. It is known that such non-integer periodicity values for bump arrays can cause multi-directional sorting modes as well as negative directional locking.21,25 All of these effects are highly undesirable for deterministic bimodal particle
Fig. 5 The left panel illustrates the definition of array anisotropy in our simulations. Δp is the pressure drop over one unit distance for the array. The right panel shows the anisotropy variation in parallelogram and rotated-square layouts (circular posts) for changing array inclina-tion, ε.
Open Access Article. Published on 24 August 2017. Downloaded on 05/12/2017 16:02:36.
This article is licensed under a
sorting. Furthermore, secondary factors, such as the distance from the side walls, now influence the critical radius.
In the rotated-square device (Fig. 6C), the streamlines (blue lines) are horizontal. The streamlines remain on their predicted course (horizontal “zigzag” around the posts), par-allel to the side walls of the device. This can be attributed to the absence of anisotropy. Unlike the parallelogram layout, using the rotated-square array leads to a well-defined and constant critical radius throughout the device. Therefore, the rotated-square layout should be preferred for particle separa-tion applicasepara-tions.
4.3 Background secondary recirculation
We have seen that the inherent anisotropic permeability of the parallelogram layout can tilt the streamlines away from the side walls, along the prevalent array inclination. However, this need not always be the case. Under certain conditions, the array anisotropy leads to a lateral pressure gradient that is balanced by normal stresses at the side walls. In this case, the streamlines are not tilted and particle trajectories are not affected. As we shall see later, certain common DLD design
features, however, allow the lateral pressure gradient to in-duce secondary flows that tilt the streamlines.
By investigating the flow field in the parallelogram device (Fig. 6B), we find that the anisotropic lateral pressure drop begins to be released near the array section interface manifesting as secondary recirculation in the device. We plot this complex “ladder-like” background flow recirculation pattern in Fig. 7. This secondary flow field is obtained by subtracting the axial ve-locity component at the centre of the device ((at 1.6 mm, 1.2 mm) marked as X) from the overall primary velocity field. The circulation is clockwise in this case, and meanders around the posts in the array. The recirculatory flow causes the streamline tilt which in turn alters the critical radius lo-cally. We find that the recirculatory flow is absent when the rotated-square layout is used. As demonstrated next, secondary recirculatory flow manifests when certain device design features or “enablers” are present in devices with intrinsic anisotropy.
4.4 Anisotropic flow tilt “enablers”
Certain design features that allow the anisotropic pressure gradient to drive the recirculatory flow are quite common in
Fig. 6 The simulation setup for both parallelogram and rotated-square DLD arrays is shown in (A). The device has two counter-inclined array sec-tions with ε = 0.2 and periodic inlet and outlet boundaries. Fluid streamlines are plotted (blue) in (B) the parallelogram and (C) rotated-square lay-out devices. Reference horizontal lines (red) indicate the direction parallel to the applied pressure drop (parallel to side walls). (B) Away from the right side wall, the streamlines tilt significantly in the parallelogram layout device. (C) The streamlines remain parallel to the applied pressure drop and follow the “zigzag” path in the rotated-square layout device. The small deviations from the horizontal line in the latter case are due to the streamlines navigating around posts. The arrows in the zoomed-in insets indicate the local velocity field. The device centreline is shown as the dashed white line.
Open Access Article. Published on 24 August 2017. Downloaded on 05/12/2017 16:02:36.
This article is licensed under a
DLD devices. In general, placing device sections with a large difference in their anisotropy values next to one another al-lows the background flow to develop, such as when arrays with opposite anisotropy values are placed next to each other (as shown in Fig. 2, 3 and 6). The anisotropic flow tilt is also “enabled” when sections with a significant difference in anisotropy values or a low-impedance isotropic zone, such as an interface gap between array sections, are employed in the DLD design.
To demonstrate the effect of an interface gap between de-vice sections, we carried out two simulations with the aniso-tropic parallelogram array with ε = 0.25. One device features an interface gap between sections (Fig. 8A), while the other
does not (Fig. 8B). In the device in Fig. 8A, the interface sec-tion gap acts as an enabler by allowing the fluid flux to com-pensate for its upward anisotropic tilt in the arrays. This al-lows the flow to tilt along the prevalent array anisotropy. In the absence of the gap, the flow remains horizontal every-where (Fig. 8B). Additional simulations show that providing connector elements in the interface gap (such as those in Fig. 4D) also suppresses lateral flow tilt. No flow tilt is ob-served when the gap between these connector elements is kept equal to the array gap G. Here, the connector elements mimic the no gap situation by preventing fluid flux deviation from the horizontal. However, when the spacing between these connector elements is increased (>4λ), the flow tilt is seen to gradually manifest again.
Even without an interface gap, the anisotropic flow tilt manifests when two array sections with significant differ-ences in the anisotropy magnitude or direction are used next to one another (cascaded array). We carried out a simulation of a cascaded parallelogram layout device with the left array section at ε = 0.05 and the right array section at ε = 0.25, with no interface gap in between (Fig. 8C). The array section with higher anisotropy dominates and causes complementary flow tilt in its adjacent array sections. Fig. 8C shows that, away from the side walls, the flow tilts slightly upwards in the right array section (ε = 0.25) and, in order to compensate for this tilt, slightly downwards in the left array (ε = 0.05). Here, the effective array inclinations (in the central simulation zone) become ε = 0.231 and ε = 0.068 in the right and left sections, respectively. Therefore, we find that the cascaded parallelo-gram arrays may generally have a locally varying critical ra-dius rc.
In our simulations, we observe that the anisotropic flow tilt occurs at the entrance and exit regions of similarly-inclined array sections, when an interface gap (<6λ) is pres-ent. The length of the array region affected by anisotropic
Fig. 7 Secondary recirculation flow pattern streamlines (blue) in the parallelogram device with ε = 0.2 (Fig. 6A) obtained by subtracting the x-component of the primary velocity measured at the device centre (marked: X) from the overall velocity field. The arrows in the zoomed-in zoomed-inset zoomed-indicate the local secondary recirculation velocity field.
Fig. 8 Fluid streamlines (blue) in a device (A) with an interface gap between array sections and (B) without an interface gap. The devices in (A) and (B) have parallelogram layout with circular posts and ε = 0.25 in both sections. There is a significant flow tilt in (A) and no tilt in (B). (C) Streamlines in a cascaded DLD with ε = 0.05 (left section) and ε = 0.25 (right section). Horizontal lines (red) indicate the axial direction with the device centreline indicated (dashed white line). All panels are zoomed-in views of larger DLD devices, taken near the right side wall. Arrows in the insets indicate the local velocity field.
Open Access Article. Published on 24 August 2017. Downloaded on 05/12/2017 16:02:36.
This article is licensed under a
flow tilt scales with the strength of anisotropy and the width of the array. We find that the length of the anisotropy-affected zone protruding into the array does not exceed the array width. Therefore, a zone free from the anisotropic lat-eral tilt can be obtained at the array centre by fabricating ar-rays with more than twice the number of posts in the flow-wise direction compared to those along the lateral direction. We suggest such “long and narrow” array sections in order to have a sufficient number of pillars in the centre, unaffected by the anisotropic flow tilt and therefore having invariant rc, for the particles to separate.
An interface gap is often seen at the beginning and end of arrays in most DLD devices. Such gaps should be avoided. The cascade arrangement of arrays is commonly employed for separation of more than two particle species in a single device. In such applications, the rotated-square layout should be used in cascade arrangement, rather than the parallelo-gram layout. It is often the practice to suppress all lateral flow in simulations for the design of DLD devices.
In reality however, we see that the side walls do not confine the lateral flow everywhere in the presence of these “enablers”. Therefore, as a general rule, “enabler” features that allow the flow to locally recompense for the lateral flow tilt should be avoided and the rotated-square layout should be favoured.
5 Causes of excessive anisotropy
Non-circular post shapes, non-unity array aspect ratios and post-to-gap ratios have been used widely in the DLD in recent years. Here, we focus our attention on the inherent anisotropy of such non-standard arrays which would give rise to lateral flow tilt in the presence of the “enablers” discussed in the previ-ous section. In this section, we carry out single post simulations to map array anisotropy (as lateral pressure drop) as well as large domain simulations to visualise the anisotropic flow tilt.
5.1 Unequal axial-to-lateral post distance
DLD devices with unequal axial and lateral gaps between posts have been shown to give enhanced separation in spe-cific applications.5,30 Using such non-unity aspect ratios for the array unit cells clearly has value, but we show here that there is a cost in terms of higher anisotropy. As previously
discussed, we carried out single post simulations to study the effect of the post–pitch aspect ratio on array anisotropy. The aspect ratio is quantified as AR = λa/λb(Fig. 1A and B). Here, we vary the axial gap λaand the lateral gap and pillar diame-ter are both kept equal to G = D = λb/2. All other simulation parameters are the same as before.
Fig. 9A shows the variation of anisotropy at array inclina-tions of ε = 0.1, 0.3, and 0.5 for the parallelogram array. Incli-nations of ε > 0.5 are equivalent to a negatively inclined array with inclination 1 − ε and are not plotted. For ε = 0.5, the anisotropy must vanish for all aspect ratios due to symmetry reasons.
Interestingly, in the parallelogram array, the anisotropy steadily decreases and converges to zero with increasing AR or λa. This is an important result for reducing the anisotropic permeability in parallelogram arrays, especially since the crit-ical radius rcis independent of the aspect ratio, at constant ε and G (our simulations predict rcto be 1.8 μm for ε = 0.1 and 3.6 μm for ε = 0.3, independent of the aspect ratio). However, AR > 1 has a clear disadvantage; large aspect ratios mean longer devices for the same lateral displacement. This raises issues of greater device footprints and higher fluidic resis-tance. Therefore such arrays are normally not used in practice.
Fig. 9B shows the anisotropy values for inclinations ε = 0.1, 0.3, and 0.5 for the rotated-square array. We observe that the sign of the anisotropy changes when the aspect ratio crosses the value 1. For AR < 1, the anisotropy is positive and for AR > 1, it is negative. AR = 1 leads to zero anisotropy for all investigated values of ε. Therefore unless other require-ments call for non-unity aspect ratios in rotated-square ar-rays, AR = 1 should be chosen. If the aspect ratio is not unity, the anisotropy can be reduced by decreasing ε.
5.2 Unequal array gap-to-post size ratio
Unequal array gap to post-sizes (G/D ≠ 1) are very common in DLD arrays. Fig. 9C shows the variation of anisotropy with the change in this ratio for the parallelogram array. Here, as the size of the post relative to the array gap increases, so does the anisotropy. We can see that the highest anisotropy value is significantly lower than that induced because of the
Fig. 9 Variation of anisotropy with the aspect ratio of the array unit cell in (A) the parallelogram and (B) the rotated-square layouts. The corre-sponding unit cell layouts are indicated in the insets. (C) Variation of anisotropy with the change in the gap to post-diameter ratio of the array for the parallelogram layout.
Open Access Article. Published on 24 August 2017. Downloaded on 05/12/2017 16:02:36.
This article is licensed under a
changes in the array aspect ratio. These results indicate that using larger gap sizes relative to the post-size would reduce anisotropy in the parallelogram array. Qualitative experimen-tal evidence for reduction in the anisotropic flow tilt with in-creased array gap-to-post size ratio is shown in Fig. S2.† We find that in the rotated-square layout, the gap-to-post size ra-tio does not have any effect and anisotropy remains zero.
5.3 Post shape-induced anisotropy
We find that asymmetric post shapes can cause a severe in-crease in anisotropy. Fig. 10 displays images from an experi-ment with right-triangular posts arranged in the rotated-square layout with negative array inclination (ε = −0.1). Fig. 10A shows the interface gap between the two array sec-tions. The cylindrical pillars placed in the gap are roof sup-ports. All array parameters are equal in both the left and right sections (6 μm post size, 4 μm gap, row shift fraction ε = −1/10). However, the right-triangular posts are rotated by 90° counter-clockwise in the right section relative to those in the left section.
Fig. 10B shows trajectories of fluorescent beads with 3.1 μm diameter. The beads are larger than the design critical ra-dius (rc= 1.1 μm on the vertex side and rc= 1.5 μm on the flat side of the triangle). Therefore, the beads are expected to follow the bump trajectory moving downwards along the ar-ray inclination. Instead, we can see that the beads move along an abnormal “zigzag” trajectory in the left array sec-tion. However, in the right array section, the same beads start following the “bump” trajectory. In the right section, close to the interface gap, the beads bump on the flat side of the right triangular posts, rather than on the vertex side as was intended. This unexpected behaviour is due to the aniso-tropic flow induced in the device caused by the strongly an-isotropic triangular post shape. The flow pattern in both sec-tions tilts along the hypotenuse of the triangle (rather than the array incline), thereby increasing the effective negative in-clination in the left section and decreasing it in the right sec-tion. In fact, particles bumping on the flat side of the trian-gles in the right section indicate that the flow tilts beyond the array incline α = tan−1(ε) = −5.7°, effectively creating a positively inclined array region close to the central interface gap.
To visualise the streamline tilt, a fluorescent dye was in-troduced into the bottom section of the DLD device (Fig. 10C). The local deviation of the flow is marked out by the interface between the dye and non-dye regions. This clearly reveals that the flow inclination is no longer horizon-tal and aligns with the hypotenuse of the triangular posts in the array segments. We see that, away from the side walls, the flow deviates by as much as ≈250 μm from the horizon-tal. Such a large deviation arising from the anisotropic pillar shape therefore induces completely opposite particle behav-iour to that intended.
To corroborate this claim, we simulated a device mimick-ing the experiment with 160 × 120 triangular posts along the
Fig. 10 Experimental device using right-triangular posts with the rotated-square layout. (A) Scanning electron micrograph of the junc-tion between two array secjunc-tions. The array inclinajunc-tions are identical on either side (ε = −0.1), but the triangular posts are rotated by 90° coun-ter-clockwise. (B) Epifluorescence micrograph showing trajectories (white lines) of fluorescent beads with a super-critical diameter of 3.1 μm. In the left section, the beads are in the zigzag mode, while in the right section, they travel in the bump mode. (C) Path of fluorescent dye injected along the right side wall of the device as it crosses the interface junction. The array inclination, centre line and maximum de-viation of the dye are marked. (D) Flow streamlines (blue) from a simu-lation of the triangular DLD geometry. Significant tilt in the streamlines from the horizontal (red lines) is observed away from the device side walls. The dashed yellow line indicates the negative array inclination. Arrows in the inset indicate the local velocity field.
Open Access Article. Published on 24 August 2017. Downloaded on 05/12/2017 16:02:36.
This article is licensed under a
flow and transverse directions, respectively. The inclination is ε= −0.1 and the device parameters match those in the experi-ment (6 μm post size, 4 μm gap). The boundary conditions for the simulated device (3200 × 2400 lattice cells) are the same as those in Fig. 6A. The simulation domain has two ar-ray sections, with the triangular posts in the right section ro-tated by 90° relative to those in the left section. The central interface gap is ≈50 μm and simulated without the cylindri-cal roof supports.
Fig. 10D shows a subset of the simulation domain at the right side wall with the flow streamlines (blue). The horizon-tal (red) lines indicate the direction of the applied pressure gradient. Around the tenth post from the right side wall, we can see that the flow tilts significantly along the triangle post hypotenuse. The tilt increases to a maximum as we move to-wards the centre of the device. We approximate the flow tilt in the central zone, near the central interface gap, by averag-ing over six equi-spaced streamlines. For the left array section (the triangles pointing up), the flow tilts by ≈ +11.3°. This would correspond to an effective array inclination of ε ≈ −0.31 and an empirically estimated2 critical diameter of ≈3.19 μm. In the right array section (triangular posts pointing down), we measure the tilt to be ≈ −11.9° and there-fore an effective array inclination of ε ≈ +0.11 and an esti-mated critical diameter of ≈1.94 μm. These results support the experimental observations of having beads, 3.1 μm in di-ameter, in the “zigzag” mode in the left section and in the “bump” mode in the right section.
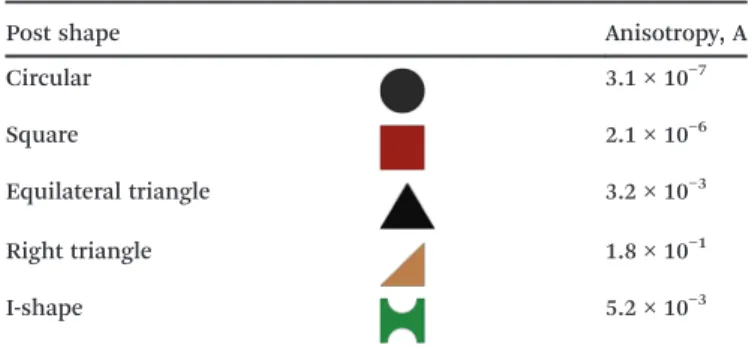
Anisotropy of non-circular posts. To understand the role of the post shape better, we simulated a single post with peri-odic boundary conditions (400 × 400 lattice cells) and mea-sured the anisotropy for different post shapes commonly employed in DLD devices. We tested the square,16equilateral triangle,12,19 right triangle18 and I-shape16,17 posts in a rotated-square layout for an inclination of ε = 0.1. All the posts are defined such that they can be inscribed in a circle of 10 μm in diameter. Each post is rotated to align with the array inclination at ε = 0.1. The results are collected in Table 1, along with those for the circular post (10 μm diame-ter). We see that highly asymmetric post shapes, such as the right triangle, display anisotropy an order of magnitude
higher than the maximum due to the parallelogram layout with circular posts. However, the anisotropy of other post shapes is close to zero and lower than that of the parallelo-gram layout with cylindrical posts. Therefore, the anisotropy caused by the device layout can be more important than the post-induced anisotropy, and the rotated-square layout is generally preferable.
A highly anisotropic asymmetric post shape such as the right triangle can prove useful. In case an anisotropic array needs to be employed, such a post shape can be used in or-der to cancel out array anisotropy. The anisotropy of post shapes can be varied by rotating them with respect to the flow direction. We plot the anisotropy variation for the post shapes listed in Table 1, for different degrees of rotation with respect to the flow direction in Fig. S3.† The simulations are carried out for each post shape at a given angle with respect to the flow in a rotated-square layout with an inclination of ε = 0.1. These post shapes have the same size as those discussed earlier. Thus, anisotropic post shape rotation could be used in order to obtain zero net anisotropy for any DLD array.
6 Suppressing the anisotropic lateral
flow
We have demonstrated the existence of anisotropic flow tilt in the parallelogram array as well as when non-cylindrical asymmetric post shapes are used in the DLD. We see that the flow tilt can cause a mixed mode for the particle due to lo-cally varying critical diameter in the array. Avoiding the prob-lems associated with the anisotropic flow tilt is important for predictable separation of particles in the DLD. We give the following design points to the DLD user community to sup-press the lateral flow tilt seen with the DLD. These are in-formed by both the simulations and experiments presented in this work.
• The rotated-square layout with cylindrical posts should be preferred over the parallelogram layout.
• “Enablers” such as interface gaps and counter-inclined adjacent sections should be avoided with anisotropic arrays.
• Increase the flow-wise to lateral array gap ratio to de-crease anisotropy in the parallelogram layout.
• Anisotropic post shape rotation can be used to counter array anisotropy when using non-cylindrical posts.
•Use “long and narrow” arrays with a greater value of the post ratio in the flow-wise to lateral direction (≫2) in order to provide an adequate region possessing a constant critical radius rc.
7 Materials and method
7.1 Simulation details
The simulations were carried out using our validated lattice-Boltzmann code.29 The no-slip wall boundary condition is implemented using the standard half-way bounce-back model. The relaxation time is set to unity with the standard
Table 1 Anisotropy for different post shapes in a rotated-square layout with an inclination of ε = 0.1. The finite anisotropy for the circular post (OIJ10−7)) is caused by numerical approximations. Note that anisotropy for
the parallelogram layout array with circular posts at ε = 0.1 is 3.6 × 10⁻²
Post shape Anisotropy, A
Circular 3.1 × 10⁻⁷
Square 2.1 × 10⁻⁶
Equilateral triangle 3.2 × 10⁻³
Right triangle 1.8 × 10⁻¹
I-shape 5.2 × 10⁻³
Open Access Article. Published on 24 August 2017. Downloaded on 05/12/2017 16:02:36.
This article is licensed under a
BGK collision operator. All the simulations are in the Stokes flow regime with a Reynolds number (computed based on the maximum velocity and array gap, G) of Re < 0.8 for the single post simulations and Re < 1 × 10⁻⁴for the large do-main simulations.
7.2 Experimental procedure
The microfluidic devices used in this work were fabricated by standard photolithographic techniques and deep reactive ion etching as described in ref. 22. Approximately 1 mm diameter through-holes were sand-blasted using a dental sandblaster. The devices were sealed using a large PDMS coated glass cov-erslip and wet by immersion in water containing 2 g L−1 Pluronic F108 (BASF), as detailed in ref. 38. Fluorescent poly-styrene beads were diluted in ultrapure water containing 2 g L−1 F108 and thoroughly sonicated to break up aggregates prior to being introduced into the devices.
8 Conclusion
We investigated anisotropic permeability in deterministic lat-eral displacement (DLD) arrays via experiments and lattice-Boltzmann simulations. Anisotropic devices induce a pressure gradient perpendicular to the axial flow direction. DLD aniso-tropy can manifest as undesired localized secondary flows (e.g. recirculation patterns). Secondary flows are undesired as they cause the imposed flow to tilt away from its intended axial di-rection, which in turn leads to locally varying critical separation size and unintended particle trajectories.
We found that the parallelogram layout displays inherent anisotropy that increases with increasing array inclination with respect to the axial flow (0 < ε ≤ 0.25). In contrast, the rotated-square layout with circular posts shows no anisotropy and therefore no flow tilt. Hence, in the rotated-square array, the flow remains parallel to the side walls throughout, and the critical radius is predictable. We thus recommend the rotated-square layout, rather than the parallelogram layout.
Also, unequal axial and lateral post gaps and non-circular post shapes can lead to excessive array anisotropy, even for the rotated-square layout. While square, equilateral triangle and I-shaped posts lead to relatively low anisotropy, right tri-angle posts cause large anisotropy that can lead to significant streamline tilt. Increasing the array post-gap ratio also leads to increased anisotropy in the parallelogram array.
If anisotropic arrays are used, one should avoid “enabler” design features that allow the anisotropy to trigger off-axis lateral flows. One typical enabler feature is the interface gap between array segments in cascaded DLD devices or at the beginning or end of arrays.
Anisotropic permeability plays an important role in deter-mining the success or failure of a DLD device and needs to be accounted for when designing such separation arrays. Ad-ditionally, this study of anisotropic permeability is relevant to a large class of flows in microfluidics and porous media, where the fluid has to flow past an ordered periodic set of ob-stacles, akin to those in the DLD.
Conflicts of interest
There are no conflicts to declare.
Acknowledgements
R. Vernekar thanks Dr. P. Valluri for access to the ECDF com-putational facilities at Edinburgh. T. Krüger thanks the Uni-versity of Edinburgh for the award of a Chancellor's Fellow-ship and part-funding for this work. D. Inglis acknowledges support from ARC DP170103704 and thanks James C. Sturm for suggesting the optical birefringence analogy, the inspira-tion for this work, in 2007. The authors thank one of the re-viewers for a detailed and constructive review.
References
1 L. R. Huang, E. C. Cox, R. H. Austin and J. C. Sturm, Science, 2004, 304, 987–990.
2 D. W. Inglis, J. A. Davis, R. H. Austin and J. C. Sturm, Lab
Chip, 2006, 6, 655–658.
3 R. Vernekar and T. Krüger, Med. Eng. Phys., 2015, 37, 845–854. 4 T. Kulrattanarak, R. G. M. v. d. Sman, C. G. P. H. Schroën
and R. M. Boom, Microfluid. Nanofluid., 2010, 10, 843–853. 5 J. A. Davis, D. W. Inglis, K. J. Morton, D. A. Lawrence, L. R.
Huang, S. Y. Chou, J. C. Sturm and R. H. Austin, Proc. Natl.
Acad. Sci. U. S. A., 2006, 103, 14779–14784.
6 D. W. Inglis, M. Lord and R. E. Nordon, J. Micromech.
Microeng., 2011, 21, 054024.
7 D. W. Inglis, K. J. Morton, J. A. Davis, T. J. Zieziulewicz, D. A. Lawrence, R. H. Austin and J. C. Sturm, Lab Chip, 2008, 8, 925–931.
8 S. Zheng, R. Yung, Y.-C. Tai and H. Kasdan, 18th IEEE
International Conference on Micro Electro Mechanical Systems, 2005. MEMS 2005, 2005, pp. 851–854.
9 N. Li, D. Kamei and C.-M. Ho, 2nd IEEE International
Conference on Nano/Micro Engineered and Molecular Systems, 2007. NEMS ‘07, 2007, pp. 932–936.
10 S. H. Holm, J. P. Beech, M. P. Barrett and J. O. Tegenfeldt,
Lab Chip, 2011, 11, 1326–1332.
11 K. Loutherback, J. D'Silva, L. Liu, A. Wu, R. H. Austin and J. C. Sturm, AIP Adv., 2012, 2, 042107.
12 Z. Liu, F. Huang, J. Du, W. Shu, H. Feng, X. Xu and Y. Chen,
Biomicrofluidics, 2013, 7, 011801.
13 J. P. Beech, S. H. Holm, K. Adolfsson and J. O. Tegenfeldt,
Lab Chip, 2012, 12, 1048–1051.
14 D. Holmes, G. Whyte, J. Bailey, N. Vergara-Irigaray, A. Ekpenyong, J. Guck and T. Duke, Interface Focus, 2014, 4, 20140011.
15 E. Henry, S. H. Holm, Z. Zhang, J. P. Beech, J. O. Tegenfeldt, D. A. Fedosov and G. Gompper, Sci. Rep., 2016, 6, 34375. 16 K. K. Zeming, S. Ranjan and Y. Zhang, Nat. Commun.,
2013, 4, 1625.
17 S. Ranjan, K. K. Zeming, R. Jureen, D. Fisher and Y. Zhang,
Lab Chip, 2014, 14, 4250–4262.
18 K. Loutherback, J. Puchalla, R. H. Austin and J. C. Sturm,
Phys. Rev. Lett., 2009, 102, 045301.
Open Access Article. Published on 24 August 2017. Downloaded on 05/12/2017 16:02:36.
This article is licensed under a
19 K. Loutherback, K. S. Chou, J. Newman, J. Puchalla, R. H. Austin and J. C. Sturm, Microfluid. Nanofluid., 2010, 9, 1143–1149. 20 R. Huang, T. A. Barber, M. A. Schmidt, R. G. Tompkins, M.
Toner, D. W. Bianchi, R. Kapur and W. L. Flejter, Prenatal
Diagn., 2008, 28, 892–899.
21 B. R. Long, M. Heller, J. P. Beech, H. Linke, H. Bruus and J. O. Tegenfeldt, Phys. Rev. E: Stat., Nonlinear, Soft Matter
Phys., 2008, 78, 046304.
22 K. J. Morton, K. Loutherback, D. W. Inglis, O. K. Tsui, J. C. Sturm, S. Y. Chou and R. H. Austin, Proc. Natl. Acad. Sci.
U. S. A., 2008, 105, 7434–7438.
23 R. Quek, D. V. Le and K.-H. Chiam, Phys. Rev. E: Stat.,
Nonlinear, Soft Matter Phys., 2011, 83, 056301.
24 H. N. Joensson, M. Uhlén and H. A. Svahn, Lab Chip, 2011, 11, 1305–1310.
25 M. Balvin, E. Sohn, T. Iracki, G. Drazer and J. Frechette,
Phys. Rev. Lett., 2009, 103, 078301.
26 D. W. Inglis, N. Herman and G. Vesey, Biomicrofluidics, 2010, 4, 024109.
27 S.-C. Kim, B. H. Wunsch, H. Hu, J. T. Smith, R. H. Austin and G. Stolovitzky, Proc. Natl. Acad. Sci. U. S. A., 2017, 114, E5034–E5041.
28 T. Kulrattanarak, R. G. M. van der Sman, Y. S. Lubbersen, C. G. P. H. SchroÃń, H. T. M. Pham, P. M. Sarro and R. M. Boom, J. Colloid Interface Sci., 2011, 354, 7–14.
29 T. Krüger, D. Holmes and P. V. Coveney, Biomicrofluidics, 2014, 8, 054114.
30 K. K. Zeming, T. Salafi, C.-H. Chen and Y. Zhang, Sci. Rep., 2016, 6, 22934.
31 B. Kim, Y. J. Choi, H. Seo, E.-C. Shin and S. Choi, Small, 2016, 12, 5159–5168.
32 M. Yamada, W. Seko, T. Yanai, K. Ninomiya and M. Seki,
Lab Chip, 2017, 17, 304–314.
33 J. McGrath, M. Jimenez and H. Bridle, Lab Chip, 2014, 14, 4139–4158.
34 B. H. Wunsch, J. T. Smith, S. M. Gifford, C. Wang, M. Brink, R. L. Bruce, R. H. Austin, G. Stolovitzky and Y. Astier, Nat.
Nanotechnol., 2016, 11, 936–940.
35 P. A. Rice, D. J. Fontugne, R. G. Latini and A. J. Barduhn,
Ind. Eng. Chem., 1970, 62, 23–31.
36 J. Sturm, Private correspondence to Dr. D. Inglis, 2007. 37 E. Hecht, Optics, Addison-Wesley, 2002.
38 R. S. Pawell, D. W. Inglis, T. J. Barber and R. A. Taylor,
Biomicrofluidics, 2013, 7, 056501.
Open Access Article. Published on 24 August 2017. Downloaded on 05/12/2017 16:02:36.
This article is licensed under a