Publisher’s version / Version de l'éditeur:
Vous avez des questions? Nous pouvons vous aider. Pour communiquer directement avec un auteur, consultez la première page de la revue dans laquelle son article a été publié afin de trouver ses coordonnées. Si vous n’arrivez pas à les repérer, communiquez avec nous à [email protected].
Questions? Contact the NRC Publications Archive team at
[email protected]. If you wish to email the authors directly, please see the first page of the publication for their contact information.
https://publications-cnrc.canada.ca/fra/droits
L’accès à ce site Web et l’utilisation de son contenu sont assujettis aux conditions présentées dans le site LISEZ CES CONDITIONS ATTENTIVEMENT AVANT D’UTILISER CE SITE WEB.
60th Canadian Geotechnical Conference, OttawaGeo 2007 [Proceedings], pp.
1-8, 2007-10-21
READ THESE TERMS AND CONDITIONS CAREFULLY BEFORE USING THIS WEBSITE. https://nrc-publications.canada.ca/eng/copyright
NRC Publications Archive Record / Notice des Archives des publications du CNRC :
https://nrc-publications.canada.ca/eng/view/object/?id=fbedfaeb-5ba8-4a09-8357-be8230d12306
https://publications-cnrc.canada.ca/fra/voir/objet/?id=fbedfaeb-5ba8-4a09-8357-be8230d12306
NRC Publications Archive
Archives des publications du CNRC
This publication could be one of several versions: author’s original, accepted manuscript or the publisher’s version. / La version de cette publication peut être l’une des suivantes : la version prépublication de l’auteur, la version acceptée du manuscrit ou la version de l’éditeur.
Access and use of this website and the material on it are subject to the Terms and Conditions set forth at
Analysis of soil suction changes in expansive Regina clay
Vu, H. Q.; Hu, Y.; Fredlund, D. G.
http://irc.nrc-cnrc.gc.ca
Ana lysis of soil suc t ion c ha nge s in ex pa nsive Re gina cla y
N R C C - 5 0 0 4 9
V u , H . Q . ; H u , Y . ; F r e d l u n d , D . G .
O c t o b e r 2 0 0 7
A version of this document is published in / Une version de ce document se trouve dans:
60th Canadian Geotechnical Conference - OttawaGeo 2007, Ottawa, ON.
October 21-24, 2007, pp. 1-8
The material in this document is covered by the provisions of the Copyright Act, by Canadian laws, policies, regulations and international agreements. Such provisions serve to identify the information source and, in specific instances, to prohibit reproduction of materials without written permission. For more information visit http://laws.justice.gc.ca/en/showtdm/cs/C-42
Les renseignements dans ce document sont protégés par la Loi sur le droit d'auteur, par les lois, les politiques et les règlements du Canada et des accords internationaux. Ces dispositions permettent d'identifier la source de l'information et, dans certains cas, d'interdire la copie de documents sans permission écrite. Pour obtenir de plus amples renseignements : http://lois.justice.gc.ca/fr/showtdm/cs/C-42
ANALYSIS OF SOIL SUCTION CHANGES IN
EXPANSIVE REGINA CLAY
Hung Q. Vu
1, Yafei Hu
2and Delwyn G. Fredlund
1 1Golder Associates Ltd., Saskatoon, SK
2
Centre for Sustainable Infrastructure Research, Institute for Research in
Construction, National Research Council, Regina, SK
ABSTRACT
The prediction of seasonal soil suction changes is critical to the analysis of volume change in unsaturated, expansive soils. A one-dimensional moisture flow model was developed to study the boundary flux and suction conditions in a soil profile at a test site in Regina, Saskatchewan. The test site was part of an extensive study related to ground movements and associated distresses caused to underground water mains. A parametric study was performed to evaluate the effects of net radiation, wind speed, precipitation, soil properties and initial suction conditions on the actual evaporation, net infiltration, water content, soil suction and depth of suction change in the soil profile for a period from 1 November 2005 to 31 October 2006.
RÉSUMÉ
La prédiction de changements saisonniers de succion de sol est critique à l'analyse de changement de volume dans aux sols non saturés et expansifs. Un modèle de flux d'humidité dans une dimension a été développé pour étudier le flux de frontière et les conditions de succion dans un profil de sol à un site de test dans Regina, Saskatchewan. Le site de test faisait partie d'une étude vaste apparentée aux mouvements de sol et les détresses associées a causé aux tuyaux souterrains. Une étude paramétrique a été exécutée pour étudier les effets de rayonnement net, la vitesse de vent, la précipitation, les propriétés de sol et les conditions de succion initiales sur la quantité de véritable évaporation, l'infiltration nette, et la variation de succion de sol et la profondeur de changement de succion dans le profil de sol pour une période du 1 novembre, 2005 au 31 octobre, 2006.
1 INTRODUCTION
The City of Regina was developed on a post-glacial lake deposit called Regina Clay. The deposit is highly plastic, unsaturated, expansive clay that exhibits large volume changes as the soil water content changes. As a result of the volume changes, light infrastructures buried in the expansive soils are often subjected to severe distress during their service. Recently, the breakage rate of asbestos cement water mains in their water distribution system has increased in older areas of the City (Hu and Hubble, 2007). A study is currently being conducted by the NRC Center for Sustainable Infrastructure Research in Regina to investigate the causes of failures of the water mains. Climate induced soil volume change was determined to be one of the critical factors behind the failures.
To better understand the behaviour of the water mains during their service, a section of water main was instrumented and installed in an older area of Regina. A series of sensors were also buried in the backfill and in the native soil around the trench to monitor the working environment of the water main (Hu and Lotfian, 2006). Due to the critical role played by matric suctions on the soil volume change in expansive clay soils, the soil suction conditions around the test site were analyzed to study their responses to external environments.
In this paper, a one-dimensional moisture flow model was developed to study the suction and water content change of the soils around the test site. The boundary flux conditions were estimated considering the detailed climatic condition collected at a weather station in the city and vegetation around the test site. Soil properties and initial suction conditions for the modeling were obtained from laboratory tests. A range of net infiltration at ground surface, suction and water content changes of the clay soils were analyzed for the climatic conditions over a period of one year from 1 November 2005 to 31 October 2006.
2 SITE OVERVIEW
The study site is located in the Emerald Park subdivision, a well developed residential area in south central Regina. The park area and front yards of the houses are grass covered. Various mature deciduous and coniferous trees with up to 560 mm trunk diameters and 12 m heights (Figure 1) have grown in the park as well as in front of the houses. Water mains of 0.15 m diameter were installed at approximately 2.8 m depth under the pavement. Houses and big trees may have significant impact on the radiation, wind speed and air temperature at the test location.
0 10 20 m Scale CONF. D 430 H 16 DECID. D 530 H 12 DECID. D 560 H 16 DECID.D 560 H 15 DECID. D 530 H 10 BUSH D 640 H 4 BUSH D 640 H 4 BUSH D 480 H 3 BUSH D 640 H 5 BUSH D 700 H 4 DECID. D 220 H 6 DECID. D 250 H 7 DECID D 260 H 7 DECID. D 370 H 11 DECID. D 310 H 9 DECID. D 380 H 8 DECID. D 550 H 14 DECID. D 410 H 11 CONIF. D 380 H 12 DECID. D 520 H 12 DECID. D 350 H 12 DECID. D 400 H 11 DECID. D 520 H 12 DECID. D 300 H 12 DECID. D 310 H 10 DECID. D 341 H 10 DECID. D 200 H 8 DECID. D 340 H 7 DECID. D 200 H 8 CONIF. D 260 H 10 CONIF. D 280 H 8 CONIF. D 230 H 8 BUSH D 570 H 5 BUSH D 900 H 5 BUSH D 900 H 5 BH2 BH1 Water main
Trench EMERALD PARK ROAD
x 577.29 x 577.64 x 577.75 x 577.18 x 577.32 x 577.33 x 577.39 x 577.67
HOUSE HOUSE HOUSE
HOUSE Mainhole Lamp post DECID. D510 H 12.3 Type Diameter (mm) Height (m) BH1 Bore hole Spot elevation Tree drip line x 577.39
LEGEND
North
Figure 1. Location of boreholes, water main, trench, trees
3 FIELD INVESTIGATION AND LABORATORY
TESTING
Stratigraphy and water content conditions at the site were determined from two boreholes drilled to 15 m depths in October 2005. Borehole 1 was located immediately north of the water main on the pavement. Borehole 2 is located in the park approximately 8 m from the south shoulder of the Emerald Park Road. Soil laboratory tests include index tests, soil-water characteristic curves, saturated hydraulic conductivity tests, constant volume consolidation tests and measurement of soil suction using the filter paper method.
Figure 2 shows the soil profile, index properties, measured suction and dry density at the test site. The soil profile consisted of highly plastic clay to a depth of about 9.5 m, and underlying glacial till. For Regina clay, the liquid limit varied from 70 to 94, with a plastic index of 40 to 65. Natural water contents varied from 22 to 33 for clay and 12 to 20 for till, slightly below plastic limit for the clay and at about plastic limit for the till. Attempts were made to measure both total and matric suction on undisturbed soil samples using the filter paper technique. However, the filter paper method may not be able to measure matric suction greater than 1000 kPa because at this high range of suction, most of moisture movement occurs through
vapour transfer rather than capillary transfer. Whatman No. 42 filter paper was used together with a calibration curve suggested by Leong et al. (2002). Measured
suctions were about 3000 kPa for the upper 4 m of clay, about 700 kPa for the lower 5.5 m of clay and about 2000 kPa for the underlying till. Dry density ranged from 1400 to 1680 kg/m3. Three saturated hydraulic conductivity tests on clay samples retrieved at depths of 2.7, 3.7 and 4.6 m indicate a saturated hydraulic conductivity of 2.0x10⁻⁹, 2.8x10⁻⁹ and 2.0x10⁻⁹ m/s, respectively. Constant volume odeometer tests on samples from 3 and 4.5 m depths showed an initial void ratio of 0.93 and 0.97, swelling index of 0.125 and 0.116, and a corrected swelling pressure of 550 and 500 kPa, respectively.
Figure 3 shows the relationship between water content and suction obtained from both the pressure plate test and filter paper methods. Two boundary soil-water characteristic curves (SWCC), (i.e., the drying and wetting curves), can cover the range of data points as shown in Figure 3. The middle curve was fitted with the Fredlund and Xing (1994) equation.
The hydraulic conductivity functions were estimated from the SWCC and saturated hydraulic conductivity, using the Leong and Rahardjo (1997) equation. Three hydraulic
100 1000 10000 Suction (kPa) BH1 Matric BH1 Total BH2 Matric BH2 Total
Figure 2. Soil profile and index properties
Figure 3. Soil-water characteristic curves
Figure 4. hydraulic conductivity functions
conductivity functions corresponding to the three SWCC shown in Figure 3 are presented in Figure 4. The middle curve was used for the analysis in this study.
4 GOVERNING PDE FOR MOISTURE
(LIQUID/VAPOUR) FLOW
Wilson (1990) presented the governing partial differential equations of heat and mass transfer and their solutions. The governing partial differential equation for a one-dimensional, vertical liquid and vapour flow can be written as follows (Wilson, 1990):
(
)
t h γ m S k 1 y h k k y w 2 w y v y ∂ ∂ = + ⎥ ⎥ ⎦ ⎤ ⎢ ⎢ ⎣ ⎡ + ⎟⎟ ⎠ ⎞ ⎜⎜ ⎝ ⎛ − ∂ ∂ + ∂ ∂ [1]where h is total head, ky is the hydraulic conductivity in the
vertical direction, kv is the vapour conductivity in the vertical direction (m/s), Sis the root uptake sink term, γw is
the unit weight of water (kN/m3), and is the slope of the SWCC (kPa-1).
2 w
m
The vapour conductivity can be expressed as:
(
)
w * v v v a v a v ρ D 273.15 T R p gW u p u k + + = [2]where uais total pressure in the bulk air phase (kPa), ua +
uatm; ua is pore-air pressure (kPa); uatm is atmospheric
pressure, 101.325 kPa; R is universal gas constant, 8.314 J/(mol.K); Wv is molecular weight of water vapour
(kg/kmol); T is temperature (oC); pv is partial pressure of
water vapour (kPa); and Dv* is the diffusion coefficient of vapour through the soil.
The diffusion coefficient of water vapour through a soil can be estimated as follows:
RT W D
Dv* =αβ v v [3]
Where α is tortuosity factor of the soil, α = β2/3
(Lai et al. 1976); β is cross sectional area of soil available for vapour flow per total area, β = (1-S)n; S is degree of saturation; n is porosity; Dv is molecular diffusivity of water vapour in air. Kimball et al. (1976) presented the following equation
for Dv:
Dv = 0.229x10⁻⁴[1+(T+273.15)/273.15]1.75 (m2/s)
5 EVAPORATION AND EVAPOTRANSPIRATION Evapotranspiration consists of the combined processes of evaporation and transpiration. The analyses in this study has been performed using Penman equation (Penman, 1948) for potential evaporation and an equation suggested by Wilson et al. (1997) for actual evaporation.
The potential evaporation at the soil-atmosphere boundary can be calculated as follows (Penman, 1948):
η Γ η E ΓQ PE N a + + = [4]
where PE is potential evaporation per unit time (m/day); Γ is the slope of the saturation vapour pressure curve with respect to temperature (mmHg/oF); QN is heat budget
(m/day), η is psychometric constant (0.27 mmHg/o
F); and 5 a 6 4 a 5 3 a 4 2 a 3 a 2 1 2a T 3a T 4a T 5a T 6a T a + + + + + = Γ [5]
where is the atmospheric air temperature, a1 =
0.6283580754, a2 = 0.0411427320, a3 = 0.0017217473,
a4 = 0.0000174108, a5 = 0.0000003985, and a6 =
0.0000000022.
a
T
The Ea parameter (m/day) can be calculated as follows
(Gitirana, 2005) ) RH 1 ( p ) u ( f Ea = airvsat − a
where is saturation vapour pressure of the air above the surface (mmHg); f(u) = 0.35[1+0.146(3.6Ww)]; Ww is
wind speed (m/day); and RHa is the relative humidity of
air. air vsat
p
The heat budget can be calculated as follows (Gray 1973):
L R
QN= e [6]
where Re is net radiation; and L is latent heat of
evaporation, L = 591-0.51Ta.
Actual evaporation (AE) at the ground surface can be calculated as follows (Wilson, 1997):
⎟ ⎟ ⎠ ⎞ ⎜ ⎜ ⎝ ⎛ − − = air v vsat air v v p p p p PE AE [7]
Vegetation plays a significant and dynamic role in the evapotranspiration process (Saxton 1982). The potential transpiration is a function of the leaf area index (LAI), which is the ratio of the surface area of the leaves and the surface area of the soil covered. The LAI is used to reduce the amount of net radiation intercepting the soil surface which in turn reduces the computed potential evaporation (Unsaturated Soils Group, 1996). The potential transpiration is calculated as follows (Ritchie, 1972): 0 PT= if LAI<0.1 ) LAI 70 . 0 21 . 0 ( PE PT= − + 0.5 if 0.1≤LAI<2.7 PE PT= if 2.7≤LAI
where PT is potential transpiration rate (m/day).
The predefined LAI curves for excellent, good, and poor vegetation condition are suggested in SoilCover (Unsaturated Soils Group 1996). Growth season for vegetation was assumed for the period from April to October for this study.
It was assumed that mass flux due to transpiration can be distributed in a triangular shape in the soil (Tratch 1995). The potential root uptake (PRU) at a given point in the soil is calculated as follows: ⎟⎟ ⎠ ⎞ ⎜⎜ ⎝ ⎛ − = T n T R R 1 R PT 2 PRU [8]
where RT is total thickness of the root zone (m); and Rn is
depth of a given point (m).
The actual transpiration sink is calculated from the potential transpiration by a reducing term that is based on the moisture availability:
PRUxPLF
S
=
where S is actual transpiration sink term in Eq. (1) (m3/day); and PLF is a plant limiting factor.
The PLF is a reduction term that describes a decrease in transpiration with an increase in matric suction. A limiting point of 500 kPa and a wilting point of 2500 kPa were
assumed for this study. The PLF is unity for suction less than 500 kPa. Between 500 kPa and 2500 kPa the plant limiting factor is reduced linearly as a function of the log of matric suction. The actual transpiration reaches zero at suction equal to 2500 kPa.
6 COMPUTER PROGRAM
Several commercial software packages are available to model the moisture flow in soils, including SoilCover (Unsaturated Soils Group, 1996), HYDRUS-2D (Simunek
et al., 1999), Vadose/W (Geo-Slope International Ltd.,
2005), SVFlux (SoilVision Systems Ltd., 2007) and FlexPDE (PDE Solutions Inc., 2004). SVFlux and FlexPDE were used for the analyses in this study.
7 CLIMATIC DATA
The study period for this modelling task is from 1 November 2005 to 31 October 2006. Climate data obtained at the weather station located at the Regina International Airport, approximately 5 km from the site was used. Climatic data obtained for this period include daily precipitation, air temperature, wind speed, and relative humidity. Solar radiation was not collected at this weather station. The data from 1 November 1999 to 31 October 2000 for Swift Current, SK, the closest and most recent solar radiation data available, were used.
0 10 20 30 40 50 C um ul a ti ve pr ec ip it ation (m ) D a ily pr ec ipit ati on (m m /day ) 0 100 200 300 400 500 Daily Cumulative 1/11/05 1/1/06 1/3/06 1/5/06 1/7/06 1/11/06 Time (day/month/year)
Figure 5. Daily and cumulative precipitation
0 5 10 15 20 25 2 Ne t ra di at ion ( M J/ m /d ay ) 1/11/05 1/1/06 1/3/06 1/5/06 1/7/06 1/11/06 Time (day/month/year)
Figure 6. Daily net radiation
The recorded daily precipitation is presented in Figure 5. Annual precipitation of 366 mm for the study period was recorded. A maximum daily precipitation of 39 mm was measured on 17 April 2006. The park area is approximately 7860 m2. The park is watered twice a week for 60 to 75 minutes each time with 11.4 m3/hour for 16 weeks from 23 June to 12 October. The park watering was distributed to two days a week and considered as an additional precipitation amount.
The net infiltration (or moisture flux) at the ground surface was determined from the amount of precipitation, park watering and estimated actual evaporation. Actual evaporation was estimated based on the potential evaporation and a limiting function (Wilson et al., 1997).
Daily net radiation was estimated from solar radiation, using an albedo value of 0.1 for the period from 1 November to 31 March and 0.3 for the period from 1 April to 31 October. The estimated daily net radiation is presented in Figure 6.
Figure 7 shows the recorded daily air temperature. The temperature was essentially below zero for the months from November to March, with an average temperature of about -10 oC. Average temperature for the months from April to October was about 10oC. Recorded daily average air temperature varied from -28 oC in March 2006 to 26 oC in July 2006. Recorded daily wind speed and relative humidity are presented in Figures 8 and 9, respectively.
-30 -20 -10 0 10 20 30 O T empe rat ure ( C) 1/11/05 1/1/06 1/3/06 1/5/06 1/7/06 1/11/06 Time (day/month/year)
Figure 7. Daily air temperature
0 200 400 600 800 1000 1200 1/11/05 1/1/06 1/3/06 1/5/06 1/7/06 1/11/06 Time (day/month/year) W ind speed ( k m/d a y)
40 60 80 100 R elat iv e hu m idit y ( % ) 1/11/05 1/1/06 1/3/06 1/5/06 1/7/06 1/11/06 Time (day/month/year)
Figure 9. Daily relative humidity
Because the site is located in a residential/park area with mature trees (Figure 1), the daily wind speed and net radiation recorded at the weather station may not directly reflect the site conditions. A factor of 0.5 was applied to these data for the analysis in this study to represent the wind speed and net radiation. Air temperature in the park may be somewhat lower than the recorded temperature on a hot day; however, this was not considered in this study.
Vegetation conditions at the site were described using the leaf area index (LAI) function. A root zone from ground surface to 0.15 m depth was assumed to represent the grass portion of the vegetation in the park. Water uptake by mature trees was not included in the current model.
8 NUMERICAL MODELLING RESULTS AND
DISCUSSION
A one-dimensional moisture flow model was used. The soil profile at a location in the park relatively far away from mature trees was chosen for the model to exclude the water uptake by the mature trees. The model considered 9.5 m of clay overlying 5.5 m of till. It was assumed that the upper 4 m of clay was fissured; a higher value of saturated hydraulic conductivity was used for the fissured portion of clay.
Climatic conditions were applied on the top boundary, no flux conditions were applied at the lower boundary. It was assumed that no infiltration took place during the winter time from November to March, when temperatures were below zero. Precipitation for this period was accumulated mathematically and applied on 1 April 2006.
Soil properties used for the analysis are shown in Figure 3 for the SWCC and Figure 4 for the hydraulic conductivity function. Initial suction conditions were estimated from the suction profile shown in Figure 2. A constant suction of 1600 kPa was used for the upper 4 m of clay, 600 kPa for the lower 5.5 m of clay and 2000 kPa for the till.
A parametric study was performed to determine the significance of each of the input parameters to the predicted results. Parameters considered included the
climatic data, vegetation conditions, soil properties, initial soil conditions, thickness of the fissured clay layer and the amount of park watering. The climatic data included daily precipitation, net radiation and wind speed. Soil property data included the SWCC and hydraulic conductivity functions for the fissured clay, intact clay and the till. A reasonable range of the values for each parameter was selected and shown in Table 1. During the sensitivity analyses, the parameter under consideration was varied while all other parameters were kept unchanged and equal to the “base case” value.
Figure 10 shows the predicted results of the cumulative boundary fluxes for the “base case” analysis. Positive flux indicates moisture enters into the soil while negative flux indicates moisture leaves the soil. For a total precipitation of 424 mm, including 366 mm of precipitation and 58 mm of park watering, the predicted total net cumulative flux is -139 mm. The total cumulative potential evaporation, actual evaporation and potential transpiration are -594 mm, -566 mm, and 400 mm, respectively. -600 -400 -200 0 200 400 600 1/11/05 1/1/06 1/3/06 1/5/06 1/7/06 1/9/06 1/11/06 Time (day/month/year) C u m ul a ti v e f lu x es (m m ) PE PT AE Precipitation Net flux
Figure 10. Calculated cumulative boundary fluxes. PE, potential evaporation; AE, actual evaporation; PT, potential transpiration.
Figures 11 and 12 present the suction and water content change versus time at various depths, respectively. Figure 13 shows suction profiles at various times for the “base case” analysis. Soil suction reached equilibrium condition in December 2005 and remained relatively unchanged until April 2006. Variation in suction was more pronounced near ground surface. A zone of suction change was predicted to a depth of 13 m in the till layer; however, only minor suction change was predicted in the till. Under the applied climatic condition, predicted suction in the clay varied from 600 to 2150 kPa. September appeared to be the month with highest soil suction in the soil. Figure 14 shows volumetric water content profiles at various times. Predicted volumetric water content in clay varies from 40 to 46 percent.
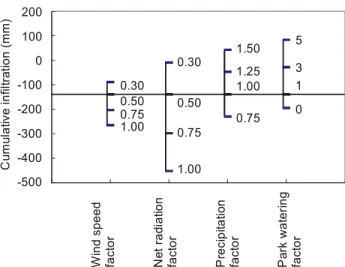
Table 1 and Figure 15 present the results of the parametric study. These results suggest that soil properties, including the SWCC and hydraulic conductivity, have only minor effects on the predicted results. Initial suction condition also appears to have
Table 1. Results of the parametric study
Parameter Base case
value
Value range Cumulative infiltration range (mm)
Variation (%)
Wind speed scale factor 0.5 0.3 to 1.0 -89 to 265 -36 to 91
Net radiation scale factor 0.5 0.3 to 1.0 -9 to -452 -94 to 225
Precipitation scale factor 1 0.75 to 1.5 -230 to 43 65 to -131
Leaf area index Good No to excellent -143 to -138 3 to -1
Park watering factor 1 0 to 5 -195 to 84 40 to -160
Thickness of fissured layer 4 0 to 5 -135 to -139 -4 to 0
Permeability of fissured clay (m/s) 2.27E-08 1.14E-8 to 2.27E-7 -136 to -142 -2 to 2 Permeability of clay (m/s) 2.27E-09 2.27E-9 to 2.27E-8 -138 to -137 < 1 Permeability of till (m/s) 1.00E-10 1.00E-11 to 1.00E-9 -137 to -136 <2
SWCC for clay Middle curve Drying to wetting -138 to -140 <1
Initial suction of upper 4 m of clay (kPa) 1600 1000 to 2000 -141 to -135 1 to -3 Initial suction of lower 5 m of clay (kPa) 600 400 to 800 -139 to -138 0 to -1
Initial suction of till (kPa) 2000 1000 to 2500 -141 to -138 1 to -1
15 10 5 0 500 1000 1500 2000 2500 Suction (kPa) De pth ( m
) Apr 7 Mar 31 Aug 31
Oct 31, 06 Jul 10
Initial Oct 31, 05
insignificant effect on the predicted infiltration rate. The parameters that have the most significant effect on the predicted cumulative infiltration are the net radiation, precipitation and park watering.
0 500 1000 1500 2000 2500 S uc ti o n ( k P a) 1/11/05 1/1/06 1/3/06 1/5/06 1/7/06 1/9/06 1/11/06 Time (day/month/year) Ground surface 4 m 6 m 9 m 11 m depth Depth
Figure 13. Suction profiles at various times
Mar 31 Apr 7 Aug 31 Oct 31, 06 Jul 10 Initial, Oct 31, 05 15 10 5 0 0.2 0.3 0.4 0
Volumetric water content (%)
De pt h ( m ) .5
Figure 11. Suction change versus time at various depths
38 40 42 44 46 48 Vo lu m e tr ic w at er con ten t (% ) Ground surface 9 m 6 m 4 m Depth 1/11/05 1/1/06 1/3/06 1/5/06 1/7/06 1/9/06 1/11/06 Time (day/month/year)
Figure 14. Volumetric water content profiles at various times
9 SUMMARY
Figure 12. Volumetric water content change versus time at
-500 -400 -300 -200 -100 0 100 200 0.30 0 0.75 0.30 0.50 1 1.00 0.50 0.75 3 1.25 0.75 1.00 5 1.50 1.00 C u m u lat iv e inf ilt ra ti on (mm) W ind spe e d fact o r Ne t r a d ia ti o n fact o r P re c ip ita ti o n fact o r P a rk w a te ri n g fact o r
Figure 15. Effect of variable parameters on calculated cumulative infiltration for period from 1 November 2005 to 31 October 2006
found to depend strongly on weather variables such as solar radiation, precipitation and wind speed. The amount of park watering was also found to be of significant importance to the estimated infiltration. Soil properties such as the SWCC and hydraulic conductivity functions appear to have only minor influence on the modelling results under the specific site condition considered. With an annual precipitation of about 400 mm, the annual net infiltration varied from -452 to 84 mm for the site under study. Suction changes can take place throughout the clay soil profile and into till to a maximum depth of approximately 13 m. The month of September was found to have the highest soil suctions in the soil near the ground surface and the greatest range of soil suction values throughout the profile.
10 ACKNOWLEDGMENT
We extend our appreciation to Troy LaFreniere, John Sarasen, Greg McGorrian, and Brian Wirth and his field team of the Engineering and Works Department at the City of Regina, Kaveh Lotfian, Paul Kulpate and Yixiang Wang of NRC-CSIR, for their assistance during the installation program and Ken Tam of Clifton Associates, Ltd. for their assistance during the soil test program.
REFERENCES
Fredlund, D.G. and Xing A. 1994. Equations for the soil-water characteristic curve. Canadian Geotechnical Journal, 31(3): 521-532.
Geo-Slope International Ltd. 2007. VADOSE/W user’s guide. Geo-Slope International Ltd., Calgary, AB.
Gitirana, G.F.N. Jr. 2005. Weather-related geo-hazard assessment model for railway embankment stability.
Ph.D. thesis, University of Saskatchewan, Saskatoon, SK.
Gray, D.M. 1973. Handbook on the principles of hydrology. A Water Information Center Publication,
Inc., Port Washington, N.Y.
Hu, Y. and Hubble, D.W. 2005. Factors contributing to failure of asbestos cement water mains. Canadian Journal of Civil Engineering, 34: 608-621.
Hu, Y. and Lotfian, K. 2006. Field installation of an instrumented section of water main pipe on Emerald Park Road, Oct 24 to 31, 2005: Progress report #SIR1001.1. Progress report to the City of Regina,
NRC, Regina, SK, Canada, 25p.
Kimball, B.A., Jackson, R.D., Reginato, R.J., Nakayama, F.S., and Idso, S.B. 1976. Comparison of field-measures and calculated soil-heat fluxes. Soil Science Society of America Proceedings, 40(1): 18-25.
Lai, S., Tiedje, J.M., and Erickson, A.E. 1976. In situ measurement of gas diffusion coefficient in soils. Soil Science Society of America Proceedings, 40(1):3-6.
Leong, E.C., He L. and Rahardjo H. 2002. Factors affecting the filter paper method for total and matric suction measurements. Geotechnical Testing Journal,
ASTM International, 25(3): 322-333.
Ritchie, J.T. 1972. Model for predicting evaporation from a row crop with incomplete cover. Water Resources Reseach, 8(5): 1204-1213.
Saxton, K.E. 1982. Mathematical modeling of evaporation on agricultural watersheds. Modeling Components of Hydrologic Cycle. V.P. Singh, (ed.), May 18-21, pp.
183-203.
Simunek, J., Seina, M., and van Genuchten, M.Th. 1999.
The HYDRUS-2D software package for simulating two-dimensional movement of water, heat, and multiple solutes in variably saturated media. Version
2.0. IGWMC-TPS-53, International Ground Water Modeling Center, Colorado School of Mines, Golden, Colorado. 251 pp.
SoilVision Systems Ltd. 2007. SVFlux User’s Manual.
SoilVision Systems Ltd., Saskatoon, SK.
Tratch, D.J. 1995. A geotechnical engineering approach to plant transpiration and root water uptake. M.Sc. thesis,
University of Saskatchewan, Saskatoon, SK.
Unsaturated Soils Group. 1996. Soilcover User’s Manual
Version 3.0. Unsaturated Soils Group, Department of Civil Engineering, University of Saskatchewan, Saskatoon, SK.
PDE Solutions Inc. 2004. FlexPDE 4.1 Reference Manual.
PDE Solutions Inc., Antioch, CA.
Penman, H.L. 1948. Natural evaporation from open water, bare soil and grass. Proceedings Royal Society of London, Series A. 193: 120-145.
Wilson, G.W. 1990. Soil evaporative fluxes for geotechnical engineering problems. Doctoral thesis,
Department of Civil Engineering, University of Saskatchewan, Saskatoon, SK.
Wilson, G.W., Fredlund, D.G., and Barbour, S.L. 1997. The effect of soil suction on evaporative fluxes from soil surfaces. Canadian Geotechnical Journal,