14
thESA Congress
5-9
thSeptember 2016, Edinburgh, Scotland
______ ________________________________
3.43
USE OF NIR HYPERSPECTRAL IMAGING TO DETECT AND QUANTIFY
NODULES ON ROOT SYSTEM OF ASSOCIATED CROPS
Damien EYLENBOSCH 1 – Jérôme PIERREUX 1 – Juan Antonio FERNÁNDEZ PIERNA 2– Vincent BAETEN 2
– Bernard BODSON 1
1 Crop Science Unit, Gembloux Agro-Bio Tech, University of Liège, Passage des déportés 2, 5030 Gembloux, Belgium, Email:
2 Valorisation of Agricultural Products Department, Walloon Agricultural Research Centre (CRA-W), Gembloux, Belgium
Introduction
One of the challenges of agronomy in the 21stcentury is to increase the productivity per land surface unit while reducing the use of chemical inputs. One way to reach this goal is to cultivate different plant species together. Winter wheat and peas cultivated in association showed promising results in temperate areas. This association allows reaching a good land equivalent ratio, reducing the use of nitrogen fertilizers and obtaining high quality harvests (Pierreux et al., 2014, 2016). To understand these results, probably explained by the transfer of nitrogen from nodules of legumes to wheat, studies at root level with quantification of nodules are required. Quantification of nodules based on visual counting is time consuming. Furthermore, roots of peas and winter wheat cannot be easily separated by visual observation or by image analysis. In this study, near infrared hyperspectral imaging (NIR-HSI) is tested as a rapid method to quantify the amount of nodules and roots of each plant species in soil samples collected during growing period under associated crops of winter wheat and peas.
Materials and Methods
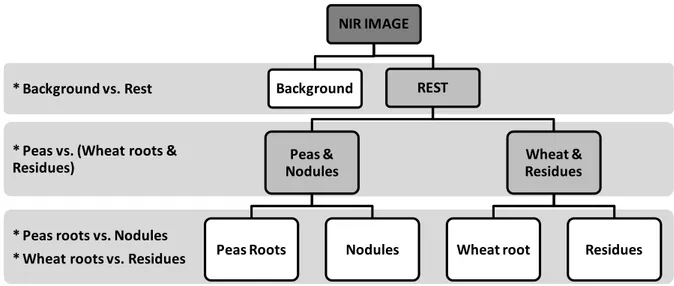
In order to study the ability of NIR-HSI combined with chemometric tools to discriminate and quantify nodules and roots of wheat and peas, soil samples were collected from associated crops cultivated with different amounts of nitrogen fertilization. Soil samples were washed to eliminate soil and the extracted elements were dried. They were then scanned with a NIR hyperspectral camera positioned below a conveyor belt (Eylenbosch et al., 2014). This camera measures, for each pixel, a NIR spectrum of 209 wavelengths (Fernández et al., 2012). These NIR spectra were classified into five classes by use of a discriminant classification tree including four chemometric models: the conveyor belt on which samples are laid (background), nodules, roots of peas and wheat and residues of the previous crop (Figure 1). Based on the number of pixels predicted for each spectral class, the amount of nodules and roots of each plant species can be estimated.
* Peas vs. (Wheat roots & Residues)
* Background vs. Rest
* Peas roots vs. Nodules * Wheat roots vs. Residues
NIR IMAGE
REST
Peas & Nodules
Peas Roots Nodules
Wheat & Residues
Wheat root Residues
Background
Figure 1: Discriminant classification tree based on 4 SVM models and allowing the classification into five spectral classes of the NIR
spectra extracted from a NIR hyperspectral image.
Results and Discussion
Models are still in development but first results obtained show a very good discrimination between nodules and roots of both plant species. By validating models on other spectra than those used for the calibration, they all classified more than 93% of NIR spectra of nodules correctly. Applied on NIR images containing only nodules,
14
thESA Congress
5-9
thSeptember 2016, Edinburgh, Scotland
3.44
models predicted on average the spectral nature of 95% of the pixels correctly and there were hardly any pixels predicted as roots of peas or wheat (less than 2%). NIR spectra of wheat root were also well predicted by models. In internal validation, at least 92% of them were correctly classified. Results obtained on NIR images of wheat roots were lower than results of internal validation because some pixels were predicted as residues of previous crop or peas roots; on average 84% of the pixels of wheat roots were well predicted. For NIR spectra of peas roots, improvement of models is still needed because of the confusion between NIR spectra of wheat roots and residues of the previous crop.
Conclusions
These preliminary results show once again the wide range of uses for NIR hyperspectral imaging combined with chemometric tools. The discrimination and the quantification of nodules under associated crops will be very useful not only to study the importance of nodules in fixation of nitrogen by legumes cultivated in association but also the effect of fertilization on these crops.
References
D Eylenbosch et al.: 2014. Detection of wheat root and straw in soil by use of NIR hyperspectral imaging spectroscopy and Partial Least
Square discriminant analysis In Proceedings of the ESA 13th Congress, pp. 237–238. Eds P. Pepó and J Csajbók.
J A Fernández Pierna et al.: 2012. NIR Hyperspectral imaging spectroscopy and chemometrics for the detection on undesirable substances in food and feed. Chemometrics and Intelligent Laboratory Systems, 117:233–239.
J Pierreux et al.: 2014. Perspectives offertes par la culture en association de froment et de pois protéagineux d’hiver In Livre Blanc Céréales
février 2014, (10), pp. 5–11. Eds B. Bodson and J.P. Destain.
J Pierreux et al.: 2016. L’intérêt de la culture en association de froment et de pois protéagineux d’hiver dans un objectif d’autonomie protéique In Livre Blanc Céréales février 2016, (10), pp. 2–9. Eds B. Bodson and J.P. Destain.
![Rôle du facteur de transcription Hnf4[alpha] dans le maintien de l'épithélium intestinal](data:image/gif;base64,R0lGODlhAQABAIAAAP///wAAACH5BAEAAAAALAAAAAABAAEAAAICRAEAOw==)