HAL Id: inserm-01933023
https://www.hal.inserm.fr/inserm-01933023
Submitted on 29 Nov 2018
HAL is a multi-disciplinary open access
archive for the deposit and dissemination of
sci-entific research documents, whether they are
pub-lished or not. The documents may come from
teaching and research institutions in France or
abroad, or from public or private research centers.
L’archive ouverte pluridisciplinaire HAL, est
destinée au dépôt et à la diffusion de documents
scientifiques de niveau recherche, publiés ou non,
émanant des établissements d’enseignement et de
recherche français ou étrangers, des laboratoires
publics ou privés.
Detecting and Interpreting Heterogeneity and
Publication Bias in Image-Based Meta-Analyses
Thomas Maullin-Sapey, Camille Maumet, Thomas E. Nichols
To cite this version:
Thomas Maullin-Sapey, Camille Maumet, Thomas E. Nichols. Detecting and Interpreting
Hetero-geneity and Publication Bias in Image-Based Meta-Analyses. OHBM 2018 - 24th Annual Meeting of
the Organization for Human Brain Mapping, Jun 2018, Singapore, Singapore. �inserm-01933023�
Detecting and Interpreting Heterogeneity and Publication Bias in
Image-Based Meta-Analyses
Thomas Maullin-Sapey
1, Camille Maumet
2, Thomas E. Nichols
11 Oxford Big Data Institute, Li Ka Shing Centre for Health Information and Discovery,
Nuffield Department of Population Health, University of Oxford, Oxford, UK.
2 University of Rennes, Inria, CNRS, Inserm, IRISA, Rennes, France.
Introduction
With the increase of data sharing, meta-analyses are becoming increasingly important in the
neuroimaging community. They provide a quantitative summary of published results and heightened confidence due to higher statistical power. The gold standard approach to combine results from neuroimaging studies is an Image-Based Meta-Analysis (IBMA) [1] in which group-level maps from different studies are combined.
Recently, we have introduced the IBMA toolbox, an extension for SPM that provides methods for
combining image maps from multiple studies [2]. However, the current toolbox lacks diagnostic tools used to assess critical assumptions of meta-analysis, in particular whether there is inter-study variation
requiring random-effects IBMA, and whether publication bias is present. Here, we present two new tools added to the IBMA toolbox to detect heterogeneity and to assess evidence of publication bias.
Methods
The heterogeneity detection is performed with Cochran’s Q statistic [3]. Cochran’s Q tests a null hypothesis of zero inter-study variance, and is large when study deviations are larger than expected by intra-study noise alone. If the user wishes to investigate the cause of heterogeneity at a specific voxel, they can generate a forest plot which displays a confidence interval for each study.
Publication bias detection is performed with a range of test statistics, including regression based methods such as Egger’s regression and Macaskill’s regression [4], ranking based methods such as Trim and Fill [5] and correlation based methods such as Begg’s Correlation [6]. All tests are based on detecting non-random arrangement of effect estimates relative to expected behavior based on sample size or intra-study variance. For example, if small studies all fall above a meta-analysis population mean, it suggests there may be missing small studies below the mean. If evidence of publication bias is found at some voxels, it can be explored with Galbraith plots and Funnel plots at individual voxels.
The IBMA toolbox allows input of NIDM packs [7] or NIfTI images, facilitating the use of results from different software packages. It is open software and makes use of non-regression testing on GitHub [8]. We used a set of 21 fMRI studies investigating the response to painful stimuli from one lab. To evaluate our tools a biased dataset was created: In a small, 3 × 3 × 3 voxel region the 9 studies with the largest mean activation were selected, discarding 12 studies, thus simulating publication bias in that region. Maps of diagnostic test statistics were created to attempt to detect the simulated bias, and funnel plots were used to verify visually the bias.
The IMBA toolbox’s Q-Statistic found evidence for heterogeneity at nearly every voxel in the brain (Fig 1). While all results were from one lab and used the same software, the stimuli and designs are
heterogeneous over studies.
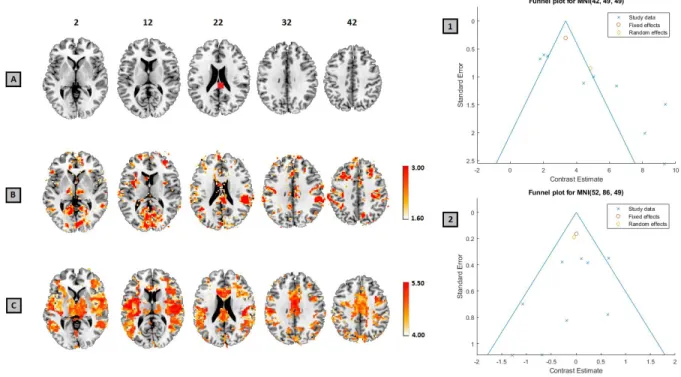
The IBMA toolbox’s publication bias test statistics successfully identified the region in which bias was induced (Fig 2). It can be seen that publication bias was detected both in the region bias was induced at (highlighted in red in Fig 2A) and in many other regions of the brain. This is to be expected as selecting studies in a manner such that publication bias is induced in a specific region is likely to result in studies with larger variance being included in the selection. This in turn will results in more publication bias being induced across the brain purely by chance.
Figure 1: The thresholded Z map, from a meta-analysis of the 21 pain studies, reported in [2] (A) and the Q-statistic P-Value map thresholded at a corresponding FDR value of 0.05 (B). Forest plots for two voxels, both with extreme observed heterogeneity, one with no significant observed signal (an observed meta-analysis Z-stat of 0.5732) (1) and one with significant observed signal (an observed meta-analysis Z-stat of 3.5217) (2). P-values are displayed with a -log10 scale with large values indicating strong evidence of heterogeneity. The most significant heterogeneity is found in the pain networks, such as the
insular cortex and thalamus. However, heterogeneity is also found in areas with no Z-significance, such as cerebellar, visual and motor areas, suggesting one or more individual studies may have activated these areas.
Figure 2: Site where bias was induced, shown in red (A), the unweighted Egger’s Regression -log 10 p-value map thresholded using an FDR-corrected p<0.05 (B) and the Trim and Fill L estimator of number of studies missing due to publication bias, thresholded using the common rule of thumb of 4 studies (C). Funnel Plots for the region bias in which was induced (1) and, for comparison, a region at which no bias was detected (2). The site where publication was induced is visible in Egger’s results and the Trim and Fill L estimator, as are several other areas.
Conclusions
The IBMA toolbox is an open-source and freely available extension of SPM. This toolbox is as a first step towards making efficient, statistically valid synthesis of neuroimaging literature easily accessible to the research community.
As data sharing within the neuroimaging community increases and more statistic maps become readily available, we believe, processes such as the diagnostic tests provided by the IBMA toolbox will become a common component of any published IBMA.
Acknowledgments
This work was supported by the Wellcome Trust. We gratefully acknowledge the use of the pain dataset from the Tracey pain group, FMRIB, Oxford. The majority of this work was conducted while TMS, TEN and CM were at the University of Warwick.
References
1 - Salimi-khorshidi, Gholamreza, Stephen M. Smith, John R. Keltner, Tor D. Wager, and Thomas E. Nichols. 2009. “Meta-Analysis of Neuroimaging Data: A Comparison of Image-Based and
Coordinate-Based Pooling of Studies.” NeuroImage 45 (3). Elsevier B.V.:810–23.
2 - Maumet C and Nichols TE (2014). IBMA: An SPM toolbox for NeuroImaging Image-Based Meta-Analysis. Front. Neuroinform. Conference Abstract: Neuroinformatics 2014. doi:
10.3389/conf.fninf.2014.18.00025
3 - Hardy, R. J., & Thompson, S. G. (1998). Detecting and describing heterogeneity in meta-analysis. Statistics in Medicine, 17(8), pp.841-856. doi:
10.1002/(SICI)1097-0258(19980430)17:8<841::AID-SIM781>3.0.CO;2-D
4 - Macaskill P., Walter S.D. and Irwig L. (2001). A comparison of methods to detect publication bias in meta-analysis. Statistics in Medicine, 20, pp.641–654. doi: 10.1002/sim.1162
5 - Duval S. & Tweedie R. (2000). Trim and fill: A simple funnel-plot-based method of testing and adjusting for publication bias in meta-analysis. Biometrics, 56(2), pp. 455-63.
doi:10.1111/j.0006-341X.2000.00455.x
6 - Begg C.B. and Mazumdar M., (1994). Operating Characteristics of a Rank Correlation Test for Publication Bias. International Biometric Society, 50(4), pp.1088-1101. doi: 10.2307/2533446
7 - Maumet C., et al. (2016). Sharing brain mapping statistical results with the neuroimaging data model. Scientific Data. doi:10.1038/sdata.2016.102
8 - IBMA - The IBMA Toolbox [Internet]. [cited 18 Dec 2017]. Available:
![Figure 1: The thresholded Z map, from a meta-analysis of the 21 pain studies, reported in [2] (A) and the Q-statistic P-Value map thresholded at a corresponding FDR value of 0.05 (B)](https://thumb-eu.123doks.com/thumbv2/123doknet/14341092.499270/3.918.117.791.342.928/figure-thresholded-analysis-studies-reported-statistic-thresholded-corresponding.webp)