HAL Id: hal-01261976
https://hal.inria.fr/hal-01261976
Submitted on 26 Jan 2016
HAL is a multi-disciplinary open access
archive for the deposit and dissemination of
sci-entific research documents, whether they are
pub-lished or not. The documents may come from
teaching and research institutions in France or
abroad, or from public or private research centers.
L’archive ouverte pluridisciplinaire HAL, est
destinée au dépôt et à la diffusion de documents
scientifiques de niveau recherche, publiés ou non,
émanant des établissements d’enseignement et de
recherche français ou étrangers, des laboratoires
publics ou privés.
Multivariate Hurst Exponent Estimation in FMRI.
Application to Brain Decoding of Perceptual Learning
Hubert Pellé, Philippe Ciuciu, Mehdi Rahim, Elvis Dohmatob, Patrice Abry,
Virginie van Wassenhove
To cite this version:
Hubert Pellé, Philippe Ciuciu, Mehdi Rahim, Elvis Dohmatob, Patrice Abry, et al.. Multivariate Hurst
Exponent Estimation in FMRI. Application to Brain Decoding of Perceptual Learning. 13th IEEE
International Symposium on Biomedical Imaging, Apr 2016, Prague, Czech Republic. �hal-01261976�
MULTIVARIATE HURST EXPONENT ESTIMATION IN FMRI. APPLICATION TO BRAIN
DECODING OF PERCEPTUAL LEARNING.
H. Pell´e
1,2, Ph. Ciuciu
1,2, M. Rahim
1,2, E. Dohmatob
1,2, P. Abry
3and V. van Wassenhove
1,41
CEA DSV/I
2BM, NeuroSpin Center, Universit´e Paris-Saclay, F-91191 Gif-sur-Yvette, France.
2INRIA, Parietal team, Universit´e Paris-Saclay, France.
3
CNRS (UMR 5672), Physics Lab., Ecole Normale Sup´erieure de Lyon F-69364 Lyon, France.
4INSERM U992, Cognitive neuroimaging Unit, F-91191 Gif-sur-Yvette, France.
ABSTRACT
So far considered as noise in neuroscience, irregular arrhyth-mic field potential activity accounts for the majority of the signal power recorded in EEG or MEG [1, 2]. This brain ac-tivity follows a power law spectrum P (f ) ∼ 1/fβin the limit of low frequencies, which is a hallmark of scale invariance. Recently, several studies [1, 3–6] have shown that the slope β (or equivalently Hurst exponent H) tends to be modulated by task performance or cognitive state (eg, sleep vs awake). These observations were confirmed in fMRI [7–9] although the short length of fMRI time series makes these findings less reliable. In this paper, to compensate for the slower sampling rate in fMRI, we extend univariate wavelet-based Hurst expo-nent estimator to a multivariate setting using spatial regular-ization. Next, we demonstrate the relevance of the proposed tools on resting-state fMRI data recorded in three groups of individuals once they were specifically trained to a visual dis-crimination task during a MEG experiment [10]. In a su-pervised classification framework, our multivariate approach permits to better predict the type of training the participants received as compared to their univariate counterpart.
Index Terms— fMRI, scale-free brain activity, Total vari-ation regularizvari-ation, multisensory learning.
1. INTRODUCTION
Scale-free brain activity is the prominent part of brain signals recorded in eletro and magneto-encephalography (EEG/MEG), which can be easily captured by measuring the linear slope β of the log-log plot of the power spectrum P (f ) ∼ 1/fβ. In
contrast to some oscillatory regimes which are only observed in response to external stimulations (eg γ oscillations beyond 30 Hz), scale-free activity is a persistent brain dynamics in the limit of low frequencies (0.1 Hz up to 3 Hz), observed both at rest and during task performance as well as in various cog-nitive states (eg, sleep) [1, 3, 5, 6, 11]. It has been shown that scale-free brain activity is functionally associated with neural excitability [2], hence supporting the observation that the β parameter decreases (or the slope becomes flatter) when an
individual is engaged in a task as compared to rest. The func-tional relevance of scale-free brain dynamics has also been illustrated in fMRI even though this imaging technique is less rich temporally. Several fMRI studies [7–9, 12] have actu-ally shown modulations in scale-free brain activity between rest and task and between healthy subjects and Alzheimer’s diseased patients [13].
To date, the most commonly used approaches for estimat-ing the slope β or equivalently the Hurst exponent H are threefold: (i) linear regression performed in the frequency domain on the log-scale Welch periodogram; (ii) Detrended Fluctuation Analysis that performs linear regression in the temporal domain [7] and (iii) linear regression from the log-scale diagram in the wavelet domain [14]. The statistical performances of these estimators have been thoroughly com-pared in [15] where it has been shown that wavelet-based analysis is more efficient (no bias, smaller variance). Also, these approaches are univariate: they perform scale-free anal-ysis voxelwise (fMRI) or sensorwise (M/EEG) whereas the neuroimaging data are multivariate. Here, our goal is to de-velop a multivariate wavelet-based Hurst exponent estimator that accounts for spatial correlation. Our approach is specif-ically dedicated to fMRI where the signals are short in time and where spatial correlation does exist. As illustrated on syn-thetic signals in Fig. 1, Hurst exponent estimates become less accurate when the signals are shorter. Hence, by taking lo-cal information into account, we hope counterbalancing the shortness of fMRI time series and recovering more accurate Hurst exponents. Our approach will be compared to the uni-variate wavelet-based estimator in a supervised classification setting. Of note, the proposed methodology cannot enter in a classical GLM analysis since, in contrast to functional con-nectivity, no seed-based time series can serve as specific re-gressor for whole brain analysis.
The paper is organized as follows. In Sec. 2, we summa-rize our learning MEG experiment [10] where three groups of individuals (V/AV/AVn) were engaged in different types of training to a complex visual task. These participants were then scanned in resting-state fMRI to test whether intrinsic
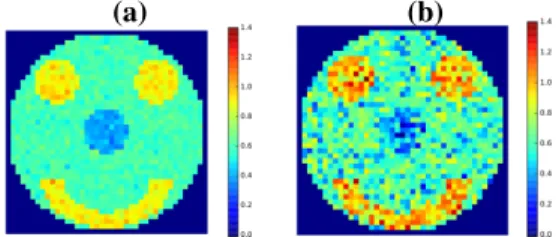
(a) (b)
Fig. 1. Univariate estimation of Hurst exponents from spa-tially correlated synthetic signals as illustrated by the smiley. (a) The signal length is 4096 samples in each pixel. (b) The same signals are considered but truncated to the first 514 time points. Shorter signals yield less accurate estimates.
brain dynamics captures differences between training types. In Sec. 3, the multivariate wavelet-based Hurst exponent es-timator is presented. In Sec. 4, we assess the performance of our approach on rs-fMRI data by computing the prediction accuracy of supervised classifiers that perform binary classi-fication (eg, V-AV) from Hurst exponents as input features.
2. MULTI-SENSORY LEARNING PARADIGM In a recent study [10, 16], we tested whether scale-free brain dynamics measuring in MEG was modulated by perceptual learning. For doing so, 36 participants were submitted to a difficult visual discrimination task which consisted of identi-fying between two random dot kinematograms (one red, one green) which one was moving coherently for about 1 s. The coherence level corresponded to the rate of dots moving in the same direction: it was varied from 15 % to 95 % to make the task more or less difficult. The experiment lasted about 1h30 along which rest and task blocks alternated. A pre-training block was used to calibrate each individual’s performance, namely to assess his perceptual threshold corresponding to the coherence level associated with 75 % of correct responses. An individual training period (4 task and rest blocks) was then performed at coherence levels around each individual’s per-ceptual threshold (±10 %, ±20 %).
The 36 individuals were split in three groups of equal size. Each group was submitted to a specific training type: either purely visual (V), or auditory-visual (AV) where congruent acoustic textures were delivered over headphones to make the learning process easier, or finally visual with acoustic white noise (AVn) to serve as control with respect to AV. Finally, a post-training block identical to the pre-training one was used to measure the improvement in behavioral performance in each individual. In [16], we have shown that the Hurst expo-nents were decreased after training and that the this decrease was negatively correlated with improvements in behavorial performance in the left inferior temporal cortex, visual mo-tion area (MT) and right inferior parietal cortex. Rs-fMRI data were then acquired on the same individuals.
3. SCALE-FREE PARAMETER ESTIMATION 3.1. Scale-free modeling
Expanding on the classical modeling of scale-free dynamics by a power-law decrease of the sole power spectrum, quanti-fying self-similarity amounts to modeling signals with scale-free dynamics as fractional Gaussian noises (fGn), that is sta-tionary Gaussian stochastic processes consisting of the frac-tional integration (of parameter H − 1/2) of a white (i.e., delta-correlated) Gaussian process. The sole parameter H governs the entire covariance structure and thus, with Gaus-sianity, completely defines fGn. More precisely, self-similar parameter H quantifies the algebraic decrease of the correla-tion funccorrela-tion: H = 1/2 indicates the absence of correlacorrela-tion, H < 1/2 betrays negative correlation and H > 1/2 marks long range positive correlation. Parameters H and β can be related as β = 2H − 1. While the classical definition of fGn implies 0 < H < 1, it can be theoretically extended to ≥ 1 [17], while preserving the original intuition beyond fGn: the larger H, the longer term the covariance and the more structured the fGn.
3.2. Scale-free analysis
Exponent β was classically estimated by linear regressions in a log of the power spectrum versus log of frequency plots. Al-ternatively, time domain approaches such as detrended fluc-tuation analysis [18] rely on linear regressions. It is now well-accepted that multiscale representations such as wavelet transforms are well-suited for the analysis of scale-free dy-namics [14, 19].
Let ψ0(t) denote a reference pattern referred to as the
mother wavelet, the discrete wavelet coefficients dX(j, k) are
defined on a dyadic grid (scale a = 2j and time t = k2j) as: dX(j, k) = R X(t)2−jψ0(2−jt − k)dt. In practice, we
used Daubechies wavelets for ψ0with a number of vanishing
moment Nψ = 2. It can be shown that for self-similar
pro-cesses: Sd X(j, q) ≡ 1 nj Pnj k=1|dX(j, k)| q ' K q2jqH, where
nj is the number of dX(j, k) available at scale j. This thus
permits a robust and efficient estimation of H, often using q = 2 in analogy to Fourier spectrum [14], by performing weighted linear regression in a log scale diagram (log2SXd vs
log22j= j). This amounts to finding the minimizer of
f (H) = j2 X j=j1 njk log2S d X(j, 2) − (2jH + c)k 2 2. (1)
where c is an intercept. Scales are linked to frequencies by f = 2−j Fc
δ where f is the frequency, j is the scale, δ is the
sampling period, Fc is the center frequency of the wavelet in
Hz (equal to 34 for Daubechies wavelets). The scaling range (j1, j2) comprises the set of scales over which scale
3.3. Multivariate Hurst exponent estimation
Let us denote I the number of voxels in the brain mask Ω computed from fMRI data preprocessings (I ∼ 5 104).
Start-ing from Eq. (1), the data consistency cost function thus reads:
F (H) =X i∈Ω j2 X j=j1 njk log2S d Xi(j, 2) − (2jHi+ ci)k 2 2 (2)
To incorporate spatial correlation information in Hurst expo-nent estimation and thus retrieve closer parameter values in neighboring voxels, we consider the regularized criterion
Jλ(H) = F (H) + λG(H) (3)
where F is given in Eq. (2) and G is a spatial regularization term. λ is the regularization parameter making the trade-off between data consistency and confidence in prior knowledge. Hereafter, we consider an isotropic total variation penalty term: G(H) =P
i∈Ω k∇Hik2so as to preserve discontinuities
be-tween smooth regions of Hurst exponents. This choice makes Jλconvex but non-smooth. The minimization of Eq. (3) thus
relies on a proximal gradient descent algorithm [20]. The cal-ibration of λ was done on a discrete grid of parameter val-ues as explained in the next section. Our implementation was done in Python and is available in Github1. It relies on the nilearnfor convex optimization [20].
4. RESULTS IN FMRI DATA ANALYSIS
We performed univariate and multivariate wavelet-based Hurst exponents estimation on 36 individuals. The scaling range (j1, j2) was set to (3, 7) which correspond to a frequencies
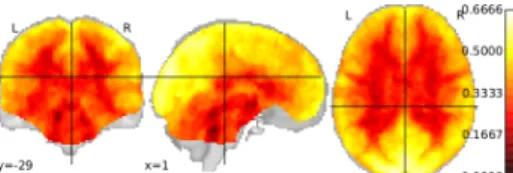
ranging from 0.005 Hz up to 0.1 Hz, the typical interval where scale-free dynamics have been reported in [7–9]. The group-level median map of Hurst exponents (univariate estimator) is shown in Fig. 2 and reflects the gray-white matter contrast: Hurst exponents are above 0.5 mostly in the cortical regions. Conversely, the Hurst exponents associated with voxels lo-cated in the white matter the are significantly lower than 0.5. Given the existing spatial correlation on this map, we hypoth-esize that our multivariate wavelet-based estimator might de-liver enhanced maps of Hurst exponents.
To compare multivariate and univariate Hurst exponent estimators, we pursued two objectives: (i) try to distinguish V, AV and AVn groups on the basis of of their rs-fMRI scale-free properties (H maps) and see how the performances of the su-pervised classifier are impacted by the estimator choice (see subsection 4.1); (ii) assess how the estimator choice affects the statistical significance when computing group-level dif-ferences using two-sample t-tests (see subsection 4.2).
1https://github.com/JFBazille/ICode.
Fig. 2.Median value of Hurst exponents estimated on real rs-fMRI data from the 36 individuals using the univariate wavelet-based esti-mator.
4.1. Supervised classification
The supervised classifier we used relies on logistic regression as loss function to predict binary outcomes and makes group comparisons such as (AV -V) or any other pair. We thus split the group pair of 24 individuals (taken out of 36) in train-ing and test sets. The traintrain-ing set was composed of subjects randomly chosen in both groups with the same occurrence proportions. The input features entered in the classifier were the individual brain maps of Hurst exponents computed either using the univariate or multivariate wavelet-based estimator. Regarding the univariate approach, we performed the analy-sis either on spatially unsmoothed fMRI images or on their spatially smoothed version with a Gaussian filter (FWHM = 6 mm). Next, we tested the accuracy of the classifier on unseen subjects to predict the training type they underwent. The evaluation of the classifiers was done by cross-validation, which consists of a stratified-shuffle split loop with 100 itera-tions and a test fold size of 30% of the whole dataset. Our im-plementation was based on the scikit-learn package [21].
So far, parameter λ has been set by hand to the value (λ = 3) providing the best average classification accuracy across all group comparisons. This might induce slight overfitting. However, cross validation cannot be helpful in the present context since λ is not involved in the classification algorithm but instead in the multivariate estimation (3).
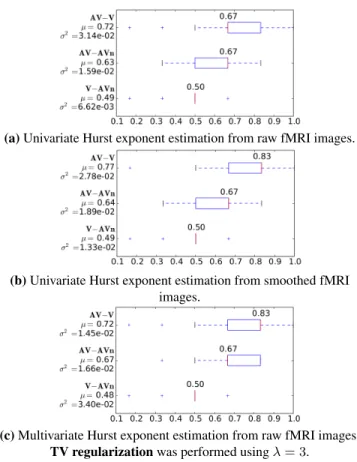
Fig. 3 shows the prediction accuracies2 for the 3
investi-gated comparisons. We observed similar trends: the AV train-ing type is easier to discriminate from others and the discrimi-nation between V and AVn groups remains at the chance level. In contrast, we achieved up to 83 % of right classification for discriminating V from AV. This result was obtained using ei-ther multivariate inference or univariate inference on filtered data. We then tested the statistical significance of such pre-diction accuracy differences between methods using paired t-tests. The p-values are reported in Tab. 1. Regarding the AV-V comparison, we only found a significant difference be-tween univariate approaches which is due to the smoothing effect. In contrast, for the AV-AVn comparison, we demon-strated that our multivariate estimation scheme provided sig-nificantly better predictions.
(a) Univariate Hurst exponent estimation from raw fMRI images.
(b) Univariate Hurst exponent estimation from smoothed fMRI images.
(c) Multivariate Hurst exponent estimation from raw fMRI images. TV regularization was performed using λ = 3.
Fig. 3. Performance of the classifiers taking wavelet-based Hurst exponent estimates as input features to discriminate groups (AV-V, AV-AVn and V-AVn comparisons).
Table 1. Statistical comparisons between estimation methods re-garding their prediction accuracy when performing classifications. Significant p-values for paired Student-t tests appear in bold font.
p-val. AV -V AV - AVn V -AVn
Multiv. vs Univ. raw 0.37 10−4 0.7
Multiv. vs Univ. smoothed 0.1 0.006 0.32
Univ. raw vs Univ. smoothed 0.006 0.22 0.53
4.2. Statistical comparisons: two-sample Student t-tests We noticed that the best prediction was achieved for the (AV - V) comparison. Hence, individuals in the AV group are sus-pected to reflect very specific Hurst exponent behavior. To further investigate this issue, we computed the group-level differences (V-AV) and (AVn-AV) of averaged Hurst expo-nents and reported these parameter differences over the sta-tistically significant voxels in Fig. 4. Clearly, the Hurst ex-ponents in AV group are significantly lower than those in V and AVn groups, especially in the visual and parietal cortices. This indicates that neural excitability (decrease in H) was en-hanced by multisensory training. This result is consistent with our previous observation [16] that after training the decrease in H computed from source reconstructed MEG time series was more significant in parieto-occipital cortices.
V-AV
AVn-AV
Fig. 4.Map of the mean group-level differences of univariate Hurst exponent estimates computed from smoothed fMRI images. Only significant voxels are reported (as in Fig. 5(b)).
Last, Fig. 5 shows different maps of (− log10pval) from
two sample Student t-tests associated with the AV-V compar-ison. The multivariate Hurst exponent estimator computed with TV regularization (λ = 3) provided slightly more sig-nificant peaks as compared to the univariate ones. Next, ir-respective of the the estimation procedure, most of the sig-nificant voxels are located in the occipito-parietal and motor areas, the latter being not specifically expected to bring dis-criminative information between the V and AV groups.
(a) Univariate Hurst exponent estimation (smoothed fMRI images).
(b) Multivariate Hurst exponent estimation (λ = 3).
Fig. 5. Maps of − log10pvalfrom two-sample Student t-tests per-forming the comparison of Hurst exponent estimates between AV and V groups.
5. CONCLUSION
In this paper, we proposed a multivariate wavelet-based Hurst exponent estimator specifically dedicated to fMRI data to com-pensate for the shortness of these time series. We demonstrate its relevance on resting-state fMRI data acquired after a learn-ing experiment. We showed that this estimator outperformed its univariate competitors in a supervised classification task for predicting the training type the individuals underwent, es-pecially for the (AV-AVn) comparison.
6. REFERENCES
[1] Dimitri Van de Ville, Juliane Britz, and Christoph M Michel, “EEG microstate sequences in healthy humans at rest reveal scale-free dynamics,” Proc. Natl. Acad. Sci. USA, vol. 107, no. 42, pp. 18179–84, 2010. [2] B. J. He, “Scale-free brain activity: past, present, and
future,” Trends Cog. Sci., vol. 18, no. 9, pp. 480–487, 2014.
[3] B. J. He, J. M. Zempel, A. Z. Snyder, and M. E. Raichle, “The temporal structures and functional significance of scale-free brain activity,” Neuron, vol. 66, no. 3, pp. 353–369, 2010.
[4] N. Zilber, P. Ciuciu, P. Abry, and V. van Wassenhove, “Modulation of scale-free properties of brain activity in MEG,” in Proc. of the 9th IEEE International Sympo-sium on Biomedical Imaging, Barcelona, Spain, 2012, pp. 1531–1534.
[5] N. Zilber, P. Ciuciu, P. Abry, and V. van Wassenhove, “Learning-induced modulation of scale-free properties of brain activity measured with MEG,” in Proc. of the 10th IEEE International Symposium on Biomedical Imaging, San Francisco, USA, 2013, pp. 998–1001. [6] Kais Gadhoumi, Jean Gotman, and Jean Marc Lina,
“Scale invariance properties of intracerebral eeg im-prove seizure prediction in mesial temporal lobe epilepsy,” PloS one, vol. 10, no. 4, 2015.
[7] B. J. He, “Scale-free properties of the functional mag-netic resonance imaging signal during rest and task,” J. Neurosci., vol. 31, no. 39, pp. 13786–13795, Sep. 2011. [8] P. Ciuciu, G. Varoquaux, P. Abry, S. Sadaghiani, and A. Kleinschmidt, “Scale-free and multifractal time dy-namics of fMRI signals during rest and task,” Front Physiol, vol. 3, June 2012.
[9] P. Ciuciu, P. Abry, and B. J. He, “Interplay between functional connectivity and scale-free dynamics in in-trinsic fMRI networks,” Neuroimage, vol. 95, pp. 248– 263, 2014.
[10] N. Zilber, P. Ciuciu, A. Gramfort, and V. van Wassen-hove, “Supramodal processing optimizes visual percep-tual learning and plasticity,” Neuroimage, vol. 93 Pt 1, pp. 32–46, 2014.
[11] N. Dehghani, C. Bedard, S. S. Cash, E. Halgren, and A. Destexhe, “Comparative power spectral analy-sis of simultaneous elecroencephalographic and magne-toencephalographic recordings in humans suggests non-resistive extracellular media,” J Comput Neurosci, vol. 29, no. 3, pp. 405–421, 2010.
[12] P. Ciuciu, P. Abry, C. Rabrait, and H. Wendt, “Log wavelet leaders cumulant based multifractal analysis of EVI fMRI time series: evidence of scaling in ongoing and evoked brain activity,” IEEE Journal of Selected Topics in Signal Processing, vol. 2, no. 6, pp. 929–943, 2008.
[13] V. Maxim, L. Sendur, J. Fadili, J. Suckling, R. Gould, R. Howard, and E. Bullmore, “Fractional Gaussian noise, functional MRI and Alzheimer’s disease,” Neu-roimage, vol. 25, no. 1, pp. 141–158, 2005.
[14] D. Veitch and P. Abry, “A wavelet based joint estima-tor of the parameters of long-range dependence,” IEEE Trans. Inf. Theory, vol. 45, no. 3, pp. 878–897, 1999. [15] M. E. Torres and P. Abry, “Comparison of different
methods for computing scaling parameter in the pres-ence of trends,” in CD Memorias XIV Congreso Ar-gentino de Bioingeniera y III Jornadas de Ingeniera Clnica (SABI 2003), C´ordoba, Argentina, 2003, Univer-sitas.
[16] P. Ciuciu, N. Zilber, P. Abry, and V. van Wassenhove, “Convergence of neural activity to local multifractal at-tractors predicts learning,” in revision to J. of Neuro-science, Oct. 2015.
[17] G. Samorodnitsky and M. Taqqu, Stable non-Gaussian random processes, Chapman and Hall, New York, USA, 1994.
[18] K. Linkenkaer-Hansen, V.V. Nikouline, J.M. Palva, and R.J. Ilmoniemi, “Long-range temporal correlations and scaling behavior in human brain oscillations,” J. Neu-rosci., vol. 21, no. 4, pp. 1370–1377, 2001.
[19] Gerhard Werner, “Fractals in the nervous system: con-ceptual implications for theoretical neuroscience,” Front Physiol, vol. 1, 2010.
[20] Elvis D. Dohmatob, Alexandre Gramfort, Bertrand Thirion, and Gael Varoquaux, “Benchmarking solvers for tv-`1 least-squares and logistic regression in brain
imaging,” in Proceedings of the 2014 International Workshop on Pattern Recognition in Neuroimaging (PRNI), Tbingen, Germany, June 2014, pp. 1–4. [21] F. Pedregosa, G. Varoquaux, A. Gramfort, V. Michel,
B. Thirion, O. Grisel, M. Blondel, P. Prettenhofer, R. Weiss, V. Dubourg, J. Vanderplas, A. Passos, D. Cournapeau, M. Brucher, M. Perrot, and E. Duches-nay, “Scikit-learn: Machine learning in Python,” Jour-nal of Machine Learning Research, vol. 12, pp. 2825– 2830, 2011.