HAL Id: hal-00553406
https://hal.archives-ouvertes.fr/hal-00553406
Submitted on 10 Mar 2011
HAL is a multi-disciplinary open access
archive for the deposit and dissemination of sci-entific research documents, whether they are pub-lished or not. The documents may come from teaching and research institutions in France or abroad, or from public or private research centers.
L’archive ouverte pluridisciplinaire HAL, est destinée au dépôt et à la diffusion de documents scientifiques de niveau recherche, publiés ou non, émanant des établissements d’enseignement et de recherche français ou étrangers, des laboratoires publics ou privés.
Hierarchical order in the cortex.
Julien Vezoli, Marie-Alice Gariel, Nikola Markov, John C. Anderson, Rodney
Douglas, Kevan A.C. Martin, Kenneth Knoblauch, Henry Kennedy
To cite this version:
Julien Vezoli, Marie-Alice Gariel, Nikola Markov, John C. Anderson, Rodney Douglas, et al.. Hier-archical order in the cortex.. Cinquième conférence plénière française de Neurosciences Computation-nelles, ”Neurocomp’10”, Aug 2010, Lyon, France. �hal-00553406�
Hierarchical order in the cortex.
J. Vezoli1,2+, M-A. Gariel1,2,3+, N.T. Markov1,2, J.C. Anderson4, R. Douglas4, K.A.C. Martin4, K. Knoblauch1,2* and H.
Kennedy1,2*.
1 INSERM U846, Stem Cell and Brain Research Institute, Bron, France. 2 Université de Lyon, UCBL, Lyon, France.
3 Netherlands Institute for Neuroscience, RNAAS, Amsterdam, Netherlands. 4 Institute of Neuroinformatics, University ETH, Zurich, Switzerland.
+ equal contribution; * corresponding authors, [email protected]; [email protected]
ABSTRACT
Strong regularities of early visual areas interconnections led to the suggestion that rostral directed connections are feedforward (FF) pathways channelling information from lower to higher order areas, while caudal directed connections constitute feedback (FB) pathways [1]. Analysis of these pathways in primate enabled the identification of a hierarchical organization [2], providing a major conceptual framework for understanding structure-function relationships of the cortex. Because previous description of cortical topology have been restricted to binary connectivity leading to strong indeterminacy [3], we re-examined network description of cortex structure by making retrograde tracer injections in areas spanning all cortical lobes. We used quantitative tools to estimate hierarchical distance and relative weights of connections [4-5] and used computational modeling analysis to analyse the underlying hierarchical structure of cortical networks. Comparing weighted and unweighted analyses, we demonstrated a significant hierarchical tendency in the pattern of laminar relations between cortical areas. Further, we evidenced a highly parallel system with high degree of reciprocity and found that rare pairs of areas are reciprocally connected by FF connections, constituting unexpected descending paths [6] in an otherwise surprisingly hierarchical system of cortical areas.
KEY WORDS
Hierarchical architecture, neural networks, parallel processing, strong loops, long-distance connections
1. Introduction
In 1991 Felleman and Van Essen were the first to order cortical areas according to previously described criteria for inter-areal projection classification [1]. Two broad types of anatomo-functional relationships can be distinguished in the cortex: (i) feedforward projections were historically defined as projections from primary sensory areas to subsequent areas processing progressively higher-level properties of the input (bottom-up). Anatomically, they stem mostly from the supragranular compartment (layers II-III) and target the granular layer (layer IV) of the target area after crossing the white matter. (ii) Feedback projections which stem mostly from the infragranular compartment (layers V-VI) of the source area and project outside of layer IV in the target area. Their function is still not clear, but they have been ascribed a modulatory top-down influence.
This led to a simple hierarchical rule, stated as follows: if an area A projects in a FF fashion onto an area B, then area A is lower than area B in a hierarchical series going from primary sensory areas to higher levels, i.e. FF projections are ascending. Similarly, FB projections are descending, i.e. if area C feeds back to area B, then C is above B in the hierarchy. The anatomical model of visual cortices built using this rule was widely adopted because it accounted for almost all of the then known binary relations (i.e. either FF or FB) between pairs of visual areas: approximately 300 documented relations involving 30 areas, out of 900 possible pairwise relations in this set, collated from more than 200 different papers. If the system did not present a strong hierarchical trend in its anatomical organization, many of them would be contradicting each other within even in the most optimally hierarchical ordering. Since then, this hierarchical framework has shaped our understanding of cortical organization and function, which is constrained by anatomical structure.
An evolutionary optimization analysis showed that the hierarchical model implemented by F&VE cannot nail down the hierarchy of the primate cortical system. Even though the system is surprisingly hierarchical, it is also indeterminate: there are at least 150.000 different orderings of the 30 areas with the same minimal number of violations of the building rule [3]. Indeed, while hierarchy provides a major conceptual framework for understanding structure-function relationships of the cortex [2, 7-10], the actual hierarchy of cortical connectivity is still ambiguous, because the set of known binary relationships is not enough to fully constrain the system into a directed acyclic graph with a fixed number of discrete levels. Nevertheless, interareal rostral-directed projections are assumed to link areas in feedforward ascending series having a driving role, and caudal-directed projections to link areas in feedback descending series having a modulatory influence. This has led to the suggestion that all FF paths (series projections are uniquely reciprocated by FB projections [6]; this hypothesis, known as the “no strong loops hypothesis”, has not been rejected yet neither has it been verified experimentally. Meanwhile, other authors have made the emphasis on distributed function in several parallel but hierarchically organized systems [11-12].
We accordingly re-examined the network descriptions of cortex structure by making retrograde tracer injections in several cortical areas spanning the occipital, parietal, temporal and frontal lobes, and used well defined quantitative tools to estimate hierarchical distance and relative weights of connections [4-5]. We
estimated hierarchical distances between area-pairs using generalized linear model (GLM) on binary and distance-weighted data (using the numbers of neurons in each compartment). Similar results were obtained for the weighted and unweighted analyses. Evidence for an underlying hierarchy was demonstrated by a significant linear relation between the observed and GLM predicted proportions of supragranular layer neurons (SLN) with a slope approaching unity when the weakest projections were eliminated.
While adding support toward a hierarchical structure of the cortex by demonstrating a significant hierarchical tendency in the pattern of laminar relations between cortical areas, we identified particular relationships (closed loops of FF projections) that have been previously discounted because of their anti-hierarchical nature and possible physiological implications [6]. Here we provide some evidence that these unexpected paths in the cortical hierarchy may share a crucial role in the transfer of information carried out in supragranular layers [13].
Brain-wide analysis of cortical networks evidence underlying hierarchical structure
We injected 26 cortical areas across the occipital, parietal, temporal and frontal lobes. Retrograde tracers have been used because of their high sensitivity, and the fact that parent cell origin of a cortico-cortical connection alone is a good indicator of FF or FB category when coupled with quantitative computation of labelled neurons with high frequency sampling [14]. We use this quantitative, continuous measure of the nature of a projection, the proportion of supragranular parent neurons or SLN [4] and computed this measure following injections in areas distributed across the whole brain (so this subset of areas is representative of the global cortical network).
Since retrograde tracers only describe the incoming connectivity of an injected area (coming from the whole cortex segmented into 83 source areas), we restricted our analysis to the set of 26 injected areas. This way, for any pair of areas within this set, the relation between them is fully characterized (connected or not, and the quantitative nature and relative strength of the projections, in both directions).
In this subnetwork of 26 cortical areas, we found a density much higher than previously reported, which can be explained by the high sensitivity and exhaustiveness of the technique used.
SLN varies between 0 (purely FB) and 1 (purely FF); it is correlated with hierarchical position in the binary-based hierarchy of Felleman and Van Essen, i.e. for every projection from A to B: (i) the closer SLN is to 1 (FF projection), the further A is below B (in number of discrete hierarchical levels crossed by the projection); (ii) the closer SLN is to 0 (FB projection), the further A is above B; and (iii) the closer SLN is to 0.5 (lateral projection), the closer A is to B.
Based on this correlation, our group already showed that SLN was a measure of hierarchical distance between source and target area. The use of a distance lifts the indeterminacy that can be very high when using binary relations. Using the difference between SLN
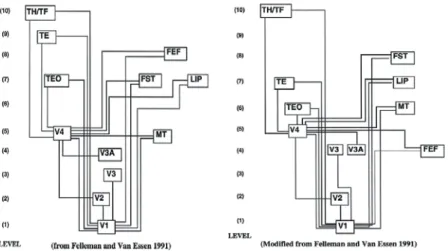
(A->C) and SLN (B-(A->C) as a measure of the hierarchical distance between A and B allowed reconstructing most of FvE’s model using only two injections instead of hundreds of different studies (figure 1). The quantitative method used also provides a measure of the relative strength of all incoming connections to a target area (known as FLN, for fraction of labelled neurons). It was proposed that SLN would be used to designate connections as either FF or FB, and together with FLN would be used to compute a weighted, hierarchical model of the cortical network.
However, SLN values and SLN differences from different injections can differ: some pairs of injections show a remarkable agreement, but others are less correlated. Thus, the strong assumption about SLN as a measure of distance has to be relaxed to derive a consistent picture of hierarchical relations in the cortex, and we have distinguished several possible ways of addressing this issue. First, use the binary information contained in SLN (i.e. simply segregate FF and FB by comparing SLN to 0.5). Second, use the ordinal information given by SLN, i.e. for each injection, order all labelled areas according to their SLN. This gives the hierarchical relation of all pairs of labelled areas, but does not retain the distance information (SLN difference) used to derive those relations. Third, use GLM applied to SLN values associated with existing projections. The use of GLM is based on the idea that SLN correlates with hierarchical distance, but that some monotonic transformation of SLN data should describe more accurately the hierarchical relations in the system. Finally, considering only the direct projections (as in the previous method), use continuous, rather than discrete, hierarchical levels, and allow for each projection a range of acceptable values rather than attempting to fit fixed hierarchical distances [15-16]. Matrix optimization: Since there is no strict hierarchy among the possible orderings [3], the aim of this study was to find an optimal one. Of course, there are many ways to define optimality, but the most straightforward measures of the un-hierarchical nature of an ordering is to count the number of violations (number of descending FF + number of ascending FB). One can also count or the total number of neurons contained in these violations, or their cumulative hierarchical distance (based on SLN difference). The number of possible orderings of 26 areas (i.e. of possible hierarchies to be evaluated) is large (factorial(26) ~ 10^26 possible orderings), so it is not possible to compute the cost of every order to find the lowest one and retain the ordering associated with it as the hierarchical model. Thus, heuristic methods are to be used rather than brute-force computation, which mean that the best order may not be found, but by choosing correctly the method, a “good” result is established, which has a cost close to the (unknown) real minimum. These methods are based on an exploration of the space of all possible ordering, and moving from one order to the next by simultaneous row-column permutations.
Figure 1. Comparison of the hierarchical model of visual system from F&VE1991 (right) and using SLN from Barone et al., 2000 (left).Adapted from Vezoli et al.2004
They necessitate the definition of a neighbourhood for each order, and starting from one, they explore the search space by moving away from this order to try and find a good cost (avoiding local minima). So far, we have used both a simulated annealing method, and a greedier algorithm exploring the search space with a metric based on number of permutations necessary to go from one order to another. The best result obtained by these methods is shown in figure 2. Although almost a quarter of the projections are in the unexpected direction (descending FF or ascending FB), these violations account for only a tenth of the total number of neurons in every known projection, indicating that the whole of the cortex is surprisingly hierarchical.
Figure 2: Graphic representation of SLN matrix. A black cell
indicate the absence of projection, and SLN values are color-coded along the scale shown on the right: the more FB projections are in dark blue, the more FF ones in bright red, with more lateral projections in light blue and yellow. The diagonal of these matrices is left empty even though the intrinsic FLN is very high, because we are here only interested in inter-areal connectivity.
Statistical modeling using GLM: Paired-comparisons are typically used in psychophysics to estimate perceptual scale values based on observer judgments of the relative strengths of stimuli. With connectivity data, each SLN value can be seen as the output of a paired-comparison: an SLN > 0.5 (FF projection) indicates that the source area is lower than the target area in the
hierarchy, and conversely, if the source area feeds back to the target area, then it is higher up. Since a single injection yields relations (S1, T), … , (Sm, T) with m the number of labelled areas, then from several injections there will be sufficient information to estimate a scale, even though not every pair of areas can be compared (when the projection is found absent). The paired-comparison analysis assumes that there is a representation that describes the data such that there exist numbers assigned to each area, h(Area), such that
h(A) > h(B) + e when A is above B, i.e. when SLN(A->B) < 0.5 , where e indicates a random error. The set of relations over all injections can be set up as a model where we try to predict scale values h, that maximize the likelihood of observing the ordering indicated by the SLN. The estimated scale values correspond to the relative hierarchical position of the areas. This model can be conceptualized as a generalized linear model with a binomial family, and this approach has the advantage that it is not necessary to know the relation between every pair of areas in order to perform the estimation. It additionally accommodates data from multiple injections at the same site: they are treated as replications. Finally, the actual numbers of neurons in the supra- and infragranular compartments can be incorporated into the analysis which then provides a weighted analysis. The GLM is set up as an equation of the following form g(E[Y]) = Xβ , where X is an incidence matrix, β is a vector of the scale values to be estimated and E[Y] is the expected value of the response. The incidence matrix, X, has a column for each area involved in a projection and a row for each pair of areas that are connected. A given row contains a 1 and -1 in the columns corresponding to the target and source of the projection, respectively, and 0 elsewhere. Here the response can be either a binary variable taking on values 1/0 depending on whether a relation is FF or FB, or in the weighted case, a vector indicating the numbers of supra- and infragranular neurons. The function g is referred to as a link function and its role is to transform the response to a scale in which it is linearly related to the explanatory variables, here the cortical areas considered. The expected response of a binary variable is a proportion or rate in the interval (0, 1). The Barone et al. analysis in which the differences
in SLN were taken directly as a measure of hierarchical distance would be equivalent to assuming that g is the identity function. Typical link functions are based on sigmoidal families such as the logistic, the Gaussian or the Cauchy distribution. These links map the unit interval onto the real line and thus might permit greater resolution in the hierarchical relations between areas.
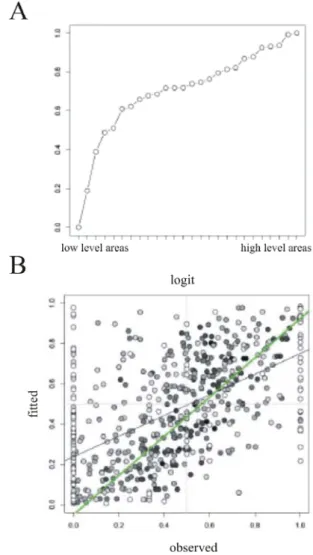
Several link functions have been tested, and yield in general similar results (with most differences being reversals of 1 or occasionally 2 steps.). Figure 3A shows the estimated scale values for the 26 areas from the unweighted GLM fit and the canonical link (the logit function). In other words, the only information used to constrain the hierarchical ordering was a binary variable indicating whether the pair of areas in a given projection was in a FB (SLN < 0.5) or a FF (SLN > 0.5) relation. Even though the GLM analysis was performed on the binary SLN relations (i.e., SLN > 0.5 or SLN < 0.5), the procedure generates a prediction for the quantitative SLN for each connection. These fitted values are plotted against the quantitative SLN values in
figure 3B. If the fit perfectly predicted GLM, the points
would fall on a line of unit slope through the origin. The best fit line obtained by linear regression is indicated by the black line. The slope is less than 1 though the linear relation is significant and yields nearly identical slopes for each link (slope between 0.51-0.52 and p << 0.001). The significance of the slope indicates that SLN does provide some measure of ordering the areas, i.e., a hierarchy, even if not perfect.
Because of the nature of SLN (proportion), it is more “granular” when very low numbers of neurons are involved: in this case it can only take a few discrete values and is not really continuous. The very weak projections are also less reliable because overlooking a small number of neurons could modify the nature of the projection, and it may be that the imprecision of their SLN value dilutes the underlying hierarchical relation. In figure 3B, the points have been colored with a grey level that depends on the number of neurons of the projection: the darker the point, the higher the total. On the plot, it does appear that the darker points yield a more systematic relation between the fitted and obtained SLN values. To quantify this, the regression line was recalculated for the projection with more than a thousand neurons (green line), and it does not differ significantly from a line with a unit slope and an intercept at the origin (intercept = -0.05, p = 0.38). Thus, excluding the weakest connections reveals a stronger hierarchical relation in the data.
Another indication of the goodness of fit is the proportion of misclassified projections. Here, we consider a projection misclassified if its SLN < 0.5 and the fitted value (predicted SLN) is greater, or vice versa. This corresponds to the proportion of points in quadrants 2 and 4, and the different links give a similar misclassification rate of about a quarter. This result suggests that including the number of neurons in a projection as a weight could enhance the GLM fits. As described above, this is easily done by modeling the numbers of supra- and infragranular neurons as binomial outcomes rather than just the FF/FB binary relation.
Figure 3: Comparing GLM fitted against observed values. A.
Estimated scale values from the unweighted GLM fit and the canonical link (logit function); B. Fitted values plotted against observed values, black line is linear regression (highly significant but less than 1) and green line is also linear regression but applied on SLN values without weak connections (the darker the points the greater the FLN).
In summary, the assumption that hierarchical distance can be directly inferred from SLN differences (as in GLM with identity link function) may be tempered when extended to areas of the brain that are wider apart both spatially and functionally, and whose hierarchical correlation may be lower. However, with distances one does not need to assume a priori transitivity of “above” or “below” relations to determine a hierarchy, and indeterminacy is indeed decreased by the redundancy of hierarchical information in our data. On the other hand, SLN alone cannot capture the essence of what the FF or FB nature of a projection means, and the use of this quantitative measure also introduces disparity and some contradictions in the data set. Still, ordinal information can be extracted from SLN (matrix optimization), and a likely continuous scale may be obtained (GLM with binomial family). The fact that these different methods yield similar results suggests that the cortex has a robust hierarchical trend even across lobes and modalities. These methods also revealed unhierarchical features that should be clearly identified and taken out so as to study the hypothesized superposition in the brain of
underlying hierarchies and some special relationships that can sustain additional properties of the system.
Strong Loops in the hierarchy and large-scale distribution of supragranular computation
The network can be described as the superimposition of FF directed and FB directed graphs that could be studied separately. If the system is purely hierarchical, all FF paths should go from lower levels to higher ones and not come back to their starting point i.e. each FF and FB directed sub-graph would be acyclic.
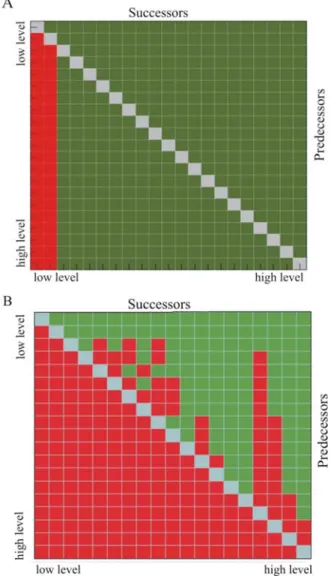
In our dataset, we have found a small subset of pairs of areas exhibiting a reliable FF-FF relation (e.g. two reciprocal connections between areas A and B, with SLN of 0.51 and 0.54, do not constitutes a strong dyad: it is more likely these two areas are simply very close in the hierarchy, and so share a lateral reciprocal relation). The exact list of dyads has yet to be finely tuned, based on global properties of the cloud of data points, but preliminary results on a subset of all injections (21 out of the 26 areas injected) already show the presence of such strong dyads, and of an interesting property they share: when present, the network of FF projections is not hierarchical (figure 4A), and contrary to what was assumed [6], FF information can travel from higher-order areas in the descending direction, as low as to early visual area V4. We found that these FF cycles can involve more than 2 areas and used 2nd order
connections to the define the "anomalous" FF direction within dyads (figure 4B); when removed from the network, FF can flow only from lower to higher areas, as predicted in the hierarchical framework.
Current ongoing analyzes show that the trend is present in the larger data set, so that these few anomalous connections would constitute unexpected FF descending pathways allowing a re-engagement of FF information at the lower levels, in an otherwise strongly hierarchical system.
We predict that more of these FF dyads will be found as more injections are added to dataset. Also, from the first one to be detected (FEF-V4, see [4]) to the others discovered so far, strong loops seem to be involved in some specialized cortical circuits [17-18]. This idea is supported by a graph theoretical analysis of information flow throughout the cortical graph, and fit with the Global Workspace Theory [11, 19].
Such dyads were predicted not to exist under the no-strong-loop hypothesis because they are intrinsically antihierarchical. However, if there is an underlying hierarchical trend, and the analyses of Felleman and Van Essen and Barone et al, certainly suggest that there is, then attempting to characterize it in spite of noise or anti-hierarchical relations is still be of value. We are now assessing this hierarchical structuring of remaining projections, which constitute the bulk of connectivity data.
3. Conclusion
These analyses demonstrated a significant hierarchical tendency in the pattern of laminar relations between cortical areas. Further, results evidenced a highly parallel system with high degree of reciprocity.
However, we found that the FF network does not have a perfect tree structure, and not all FF connections are reciprocated by FB ones: contrary to what was assumed so far [6], rare pairs of areas are reciprocally connected by FF connections (strong loops) in an otherwise hierarchical system.
Figure 4: Reachability matrices of the feedforward connectivity. A. Red cells indicate there is no path (direct or multi-step) from areas
on the left to areas at the bottom. Green cells indicate such a path exists. Within the graph FF information can go back as low as the 2nd
level using only FF connections; B. In A, FF information can travel in both directions (from bottom-up but also from top-down) because of a few reciprocal FF-FF connections. When the anomalous path of these strong dyads is removed, then the information can only travel in a bottom-up fashion. Strong loops thus allow a reengagement of FF information during cortical processing. Note that matrixes presented
here have been optimized.
Based on quantitative measurement of the FF or feedback nature of each projection we found some strong loops (i.e. pairs of areas with a reciprocal FF relation). Higher-order loops are also present, and the overall network is not thus strictly an acyclic directed graph. These dyads are part of this network, which has implications for the spread of FF information in the cortex. With respect to the hierarchical ordering of cortical areas, we found that each strong dyad is made of a regular, hierarchical projection, and an anomalous one which constitutes an unexpected descending path allowing re-engagement of FF information at the lowest
levels of the visual hierarchy (as low as V4). We also found that removing these rare anomalous connections resulted in a directed acyclic graph as predicted in the hierarchy framework, with ascending, uni-directional spread of FF information. This, and the central role of the areas involved in strong loops indicate that a few anomalous descending paths are adding new properties onto an underlying hierarchical system.
Finally, strong loops form long-distance links, and have higher than average weights for their distance values; further, they have a special profile linking different modalities and constitute unexpected descending paths in the hierarchical system of cortical areas. One consequence of this network is that the computations carried out in supragranular layers of the cortex [20] can be widely distributed in large-scale cortical networks mediating top-down control. The present anatomical results are unexpected but can be incorporated into theories and models already inspired of neuroanatomical findings e.g. [11, 21] . Strong loops could be part of constitutive synchronized networks that play an essential role in cognitive integration of information [22-23].
Acknowledgements
D. Autran, J. Beneyton, A. Kennedy, A. Batardiere, S. Zouaoui, for histological assistance and data collection, N. Kolomitre, M. Seon, M. Valdebenito for animal husbandry and V. Vezoli for administrative assistance. This work was supported by DAISY FP6-2005 IST-1583 (HK); ANR-05-NEUR-088 (HK), SECO FP7-2007-ICT-216593 (HK).
References
1. Rockland, K.S. and D.N. Pandya, Laminar origins and terminations of cortical connections of the occipital lobe in the rhesus monkey. Brain Res,
179(1), 1979,3-20.
2. Felleman, D.J. and D.C. Van Essen, Distributed hierarchical processing in the primate cerebral cortex. Cereb Cortex, 1(1), 1991,1-47.
3. Hilgetag, C.C., M.A. O'Neill, and M.P. Young, Indeterminate organization of the visual system.
Science, 271(5250), 1996,776-7.
4. Barone, P., et al., Laminar distribution of neurons in extrastriate areas projecting to visual areas V1 and V4 correlates with the hierarchical rank and indicates the operation of a distance rule. J
Neurosci, 20(9), 2000,3263-81.
5. Vezoli, J., et al., Quantitative analysis of connectivity in the visual cortex: extracting function from structure. Neuroscientist, 10(5), 2004,476-82. 6. Crick, F. and C. Koch, Constraints on cortical and
thalamic projections: the no-strong-loops hypothesis. Nature, 391(6664), 1998,245-50.
7. Rockland, K.S. and D.N. Pandya, Cortical connections of the occipital lobe in the rhesus monkey: interconnections between areas 17, 18, 19 and the superior temporal sulcus. Brain Res, 212(2), 1981,249-270.
8. Boussaoud, D., L.G. Ungerleider, and R. Desimone, Pathways for motion analysis: cortical connections of the medial superior temporal and fundus of the superior temporal visual areas in the macaque. J
Comp Neurol, 296(1990,462-495.
9. Kaas, J.H. and C.E. Collins, The organization of sensory cortex. Curr Opin Neurobiol, 11(4), 2001,498-504.
10. Lamme, V.A. and P.R. Roelfsema, The distinct modes of vision offered by feedforward and recurrent processing. Trends Neurosci, 23(11), 2000,571-9.
11. Dehaene, S., M. Kerszberg, and J.P. Changeux, A neuronal model of a global workspace in effortful cognitive tasks. Proc Natl Acad Sci U S A, 95(24), 1998,14529-34.
12. Goldman-Rakic, P.S., Topography of cognition: parallel distributed networks in primate association cortex. Annu Rev Neurosci, 11(1988,137-156. 13. Douglas, R.J. and K.A. Martin, Mapping the matrix:
the ways of neocortex. Neuron, 56(2), 2007,226-38. 14. Kennedy, H. and J. Bullier, A double-labeling
investigation of the afferent connectivity to cortical areas V1 and V2 of the macaque monkey. J
Neurosci, 5(10), 1985,2815-30.
15. Krumnack, A., et al., Criteria for optimizing cortical hierarchies with continuous ranges. Front
Neuroinformatics, 4(2010,7.
16. Reid, A.T., et al., Optimization of cortical hierarchies with continuous scales and ranges.
Neuroimage, 47(2), 2009,611-7.
17. Armstrong, K.M., J.K. Fitzgerald, and T. Moore, Changes in visual receptive fields with microstimulation of frontal cortex. Neuron, 50(5), 2006,791-8.
18. Rizzolatti, G. and C. Sinigaglia, The functional role of the parieto-frontal mirror circuit: interpretations and misinterpretations. Nat Rev Neurosci, 11(4), 2010,264-74.
19. Dehaene, S. and J.P. Changeux, A hierarchical neuronal network for planning behavior. Proc Natl
Acad Sci U S A, 94(24), 1997,13293-13298.
20. Douglas, R.J. and K.A. Martin, Recurrent neuronal circuits in the neocortex. Curr Biol, 17(13), 2007,R496-500.
21. Damasio, A.R., Time-locked multiregional retroactivation: a systems-level proposal for the neural substrates of recall and recognition.
Cognition, 33(1-2), 1989,25-62.
22. Engel, A.K., P. Fries, and W. Singer, Dynamic predictions: oscillations and synchrony in top-down processing. Nat Rev Neurosci, 2(10), 2001,704-16. 23. Gross, J., et al., Modulation of long-range neural
synchrony reflects temporal limitations of visual attention in humans. Proc Natl Acad Sci U S A,