Publisher’s version / Version de l'éditeur:
Leukos, 1, April 4, pp. 7-26, 2005-04-01
READ THESE TERMS AND CONDITIONS CAREFULLY BEFORE USING THIS WEBSITE.
https://nrc-publications.canada.ca/eng/copyright
Vous avez des questions? Nous pouvons vous aider. Pour communiquer directement avec un auteur, consultez la première page de la revue dans laquelle son article a été publié afin de trouver ses coordonnées. Si vous n’arrivez pas à les repérer, communiquez avec nous à PublicationsArchive-ArchivesPublications@nrc-cnrc.gc.ca.
Questions? Contact the NRC Publications Archive team at
PublicationsArchive-ArchivesPublications@nrc-cnrc.gc.ca. If you wish to email the authors directly, please see the first page of the publication for their contact information.
Archives des publications du CNRC
This publication could be one of several versions: author’s original, accepted manuscript or the publisher’s version. / La version de cette publication peut être l’une des suivantes : la version prépublication de l’auteur, la version acceptée du manuscrit ou la version de l’éditeur.
For the publisher’s version, please access the DOI link below./ Pour consulter la version de l’éditeur, utilisez le lien DOI ci-dessous.
https://doi.org/10.1582/LEUKOS.2004.01.04.001
Access and use of this website and the material on it are subject to the Terms and Conditions set forth at
Task lighting effects on office worker satisfaction and performance,
and energy efficiency
Newsham, G. R.; Arsenault, C. D.; Veitch, J. A.; Tosco, A. M.; Duval, C. L.
https://publications-cnrc.canada.ca/fra/droits
L’accès à ce site Web et l’utilisation de son contenu sont assujettis aux conditions présentées dans le site LISEZ CES CONDITIONS ATTENTIVEMENT AVANT D’UTILISER CE SITE WEB.
NRC Publications Record / Notice d'Archives des publications de CNRC:
https://nrc-publications.canada.ca/eng/view/object/?id=1e426f96-3df2-44df-a98b-b5f823ec4385 https://publications-cnrc.canada.ca/fra/voir/objet/?id=1e426f96-3df2-44df-a98b-b5f823ec4385
Task lighting effects on office worker satisfaction and
performance, and energy efficiency
Newsham, G.; Arsenault, C.; Veitch, J.;
Tosco, A.M.; Duval, C.
NRCC-48152
A version of this document is published in / Une version de ce document se trouve dans :
Leukos, v. 1, no. 4, April 2005, pp. 7-26
Doi:
10.1582/LEUKOS.01.04.001
Task lighting effects on office worker satisfaction and performance, and energy efficiency
Guy Newsham, Chantal Arsenault, Jennifer Veitch, Anna Maria Tosco, Cara Duval Institute for Research in Construction, M24
National Research Council Canada Ottawa, ON, K1A 0R6
Tel: (613) 993-9607; Fax: (613) 954-3733 guy.newsham@nrc-cnrc.gc.ca
ABSTRACT
This paper reports on two experiments conducted in the same office laboratory. As part of a larger experiment, 58 participants worked for a day under one of two lighting designs. The first design used ceiling-recessed parabolic luminaires only; the second design employed the same parabolic ambient lighting, with the addition of an angle-arm task light. Participants had no control over the lighting until the afternoon, when they were offered dimming control over the ambient parabolic lighting; participants with task lighting were also permitted to move the arm location. During the day participants performed a variety of simulated office tasks, as well as completing a number of questionnaires on mood, satisfaction, and discomfort. There was no main effect of lighting design on questionnaire outcomes, however, task lighting was associated with performance improvements on some tasks. Interestingly, provision of a task light did not lower participants' preferred ambient light output.
The second experiment, with 31 participants, followed up on this final point. Again, ambient lighting was provided by ceiling-recessed, parabolic luminaires, and participants were provided with a task light. For two task light types (angle-arm and luminous shade) at three different levels of output (0%, 50%, and 95%), participants used a dimmer to select their preferred level of ambient lighting. Increasing task lighting did reduce chosen ambient light output, but the reduction in lighting power was small, and only about the same as the power drawn by the task light. Results suggested that participants did not dim ambient lighting further because they preferred to maintain illumination on non-task surfaces, and to avoid extreme luminance ratios.
1. INTRODUCTION
Recommended practice documents for office lighting [e.g., New Buildings Institute 2001; Wolsey & Miller 1994; IESNA 2000 (p.26-1); ANSI/IESNA 2004 (p.21)] commonly propose that a primary route to energy savings in offices is to reduce ambient lighting levels and to compensate with local task lighting of much lower wattage. This strategy is also featured in green building rating systems. For example, in Australia the Green Star environmental rating system for office interiors [GBCA 2004] offers a credit “... if a two component lighting system (base lighting plus
supplementary task lighting) is installed and the base lighting level is no more than 150 lux…”. However, as described below, the scientific research is equivocal as to whether this approach is appropriate, particularly in a modern computer-equipped office space.
Tiller et al. [1995] studied a field site that replaced all centrally-controlled ambient luminaires with locally-switched furniture-mounted indirect luminaires plus task lights. They reported energy savings of ~75%. A group from Lawrence Berkeley National Laboratory installed desk lights with a luminous shade in a 14-person open-plan office. They recorded that ambient lighting that was often switched on before the addition of desk lights remained off afterwards, energy savings were ~50%, and the new lighting system was evaluated positively [LBNL]. Veitch and Newsham [1998] studied task-ambient lighting systems and ambient-only systems in an office laboratory. The task-ambient systems drew 30-60% less power than the ambient-only systems, and, overall, there was no negative effect on occupant mood, satisfaction and task performance. However, Collins et al. [1989] produced contrary findings in a field study of lighting systems in 13 office buildings. Lighting systems that included task lighting had substantially higher lighting power
densities, and occupants with task lights were significantly less satisfied. However, three-quarters of the task lighting was furniture-integrated, and approximately one-third of the task lighting was in buildings with a furniture-mounted indirect ambient lighting system and dark room surfaces, which seemed to contribute to the dissatisfaction levels.
In the above cases participants evaluated lighting systems as presented to them; they did not have the ability to modify the systems to optimise their performance. As such, the studies could be said to have examined acceptance rather than preference. Studies have been conducted that allowed participants to modify task light output to match their preferences. Boyce, Veitch et al. [2003] conducted two experiments in a simulated office environment. Of the six lighting conditions they studied, two are of interest here. In one design all lighting was provided by a direct/indirect ambient lighting system; this was compared to a design with an identical ambient system plus a luminous-shade desk light. Participants were free to choose one of four output levels for the desk light, with power draw of 0, 11, 19 or 35 W. Around 50% of participants chose output at the 35 W level, and another 40% at the 19 W level. Participants with the desk light sustained their motivation over time on a difficult task and took shorter rest breaks between typing tasks. However, there was evidence that the design with task lighting was appraised more negatively in terms of comfort, and in comparison to lighting in other similar buildings.
Yamakawa et al. [2000] conducted an experiment in a mock-up office in which participants chose their preferred level of task lighting for a given, fixed, ambient lighting level. Participants were exposed to ambient lighting from ceiling-recessed parabolic fixtures at 200, 300 or 400 lx. Participants then used a dimmer to select a preferred level of output from a task light. On average, a 100 lx reduction in ambient lighting was compensated by a 30 lx increase in task lighting. In Tabuchi et al. [1995] participants in a mock-up office laboratory used a dimmer to adjust ambient lighting in response to different, fixed, task lighting levels in the range 300 – 1000 lx. For a total task illuminance of 750 lx, they derived a minimum acceptable ambient light level of 200 lx, whereas the optimum level was 580 lx. Therefore, for the optimum level, savings due to task lighting were 20% at most. However, for task illuminances of 500 lx or below (recommended by IESNA [2000] for office tasks), participants preferred the ambient illuminance to be equal to or higher than the task illuminance. This suggests that task lighting supplements rather than supplants ambient lighting, resulting in no energy savings.
Bean and Hopkins [1980] drew conclusions similar to Tabuchi et al.’s. For relatively low levels of task lighting (200 and 400 lx), their qualitative data, from a mock-up office, indicated that task and ambient lighting should be at the same level. The results of a study reported by Fischer [1980] are also in line with these findings. This study was also conducted in a mock-up office space where 1000 lx was provided on the desktop with various combinations of ambient lighting from ceiling-recessed parabolic luminaires, and task lighting from a desk-mounted fixture. Observers judged the situation to be good if at least 500 lx was provided by ambient lighting. McKennan & Parry [1984] also conducted a study in a mock-up office where participants evaluated 10 different task-ambient lighting designs with an ambient lighting level of only 200-250 lx. The task lighting systems evaluated most highly used luminaires suspended from the ceiling, rather than local desk-mounted luminaires. These suspended luminaires substantially elevated illuminance outside the immediate task area (up to 600 lx) and created illuminance ratios closer to prevailing recommendations, similar to those in the UK today [CIBSE 1993]. Boyce [1979], however, reached a contrary conclusion: participants in a mock-up office were satisfied with a task illuminance of ~800 lx when the ambient illuminance in the location of the task was only 150 lx. Local task lighting often produces relatively high light levels on relatively small areas. This has the potential to create high luminance non-uniformity, which may be viewed negatively, as suggested by McKennan & Parry’s [1984] findings. The IESNA Handbook [IESNA 2000]
recommends that for office environments luminance ratios between tasks and adjacent surrounds (or vice versa) should be no greater than 3:1. Veitch & Newsham [2000b] conducted a study in an office laboratory with computer and paper-based tasks in which participants had control over several lighting circuits. Participants’ lighting choices resulted in an average desktop to
background luminance ratio of 1.7:1, and an average computer screen to background luminance ratio of 0.8:1. Rea [1983] also cited numerous articles indicating that the luminous distribution outside the task area influences the visibility of the task. Bernecker et al. [1993] examined five different luminance distributions from a undershelf task light in an open-plan office setting. The primary outcome variable was the visual comfort ratings of participants engaged in a paper-based reading task. The most uniform luminance distributions received the highest ratings.
In consideration of recommendations for task-ambient lighting in offices as an energy saving technique, and the fact that most work in the literature does not reflect modern North American office conditions, tasks, or cultural expectations, we decided to investigate the benefits of task lighting further via two experiments described below.
2 EXPERIMENT 1
2.1 Methods and Procedures 2.1.1 The Experimental Space
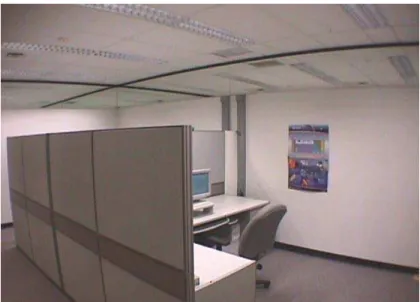
The experimental space was 7 m x 4.9 m x 2.75 m. Within this space were two workstations approx. 2.7 m x 2.9 m, and a corridor area (Fig. 1). The workstations were formed using two of the outside walls of the room and two 1.7 m height partition walls. Mirrors were installed across the width of the full-height walls, extending from the ceiling down to a depth of 0.45 m. These mirrors created a general feeling of a larger space, and an effectively infinite ceiling. Table 1a describes the major surfaces in the space, and their reflectances.
2.1.2 The Lighting Designs
The task lighting aspect of this experiment was part of a larger experiment [Newsham et al. 2003 and Newsham et al., 2004]. In the larger experiment, four lighting designs were used, of which two are of interest for the study of task lighting. Figure 2 shows a schematic layout for each of these two lighting designs. Identical luminaires have the same letter code, and are described by this letter code in Table 1b.
TABLE 1a. Description of the major surfaces in the experimental space, and their reflectances.
Surface Description Reflectance
Partitions Grey fabric 0.51
Walls Grey-painted gypsum 0.82
Desktop Grey plastic-coated steel 0.63
Carpet Grey carpet tile 0.15
Ceiling White gypsum tile 0.85
TABLE 1b. Description of the luminaires used.
Letter
Code Description
P 1’ x 4’ deep-cell parabolic louvre fixtures, recessed in the ceiling. 2 x 32 W T8 lamps (3500K, CRI=75); Electronic dimming ballast (5-110%).
D Angle-arm task light; 1 x 18 W quad CFL (4100 K, CRI=82) C Recessed downlight for corridor area.
1 x 50 W PAR 20 Halogen floodlight.
In both lighting designs, the ambient lighting was set at one of four initial output conditions, with the goal of producing a desktop illuminance (see Fig. 3) of 200, 400, 600, or 800 lx.
Fig. 1. Photograph of experimental space from entrance. Ambient Only C C C P P P P P P P P C C Ambient+Task C P D P D P P P P P P
2.1.3 Participants
Participants were recruited from a temporary employment agency, and were paid at their normal rate. The agency pre-screened participants on these criteria: minimum 18 years of age; normal or corrected-to-normal vision; normal hearing; no mobility impairments; experience with
Windows™ software; and a pass on the agency’s word fluency test. Participants were randomly assigned, in gender-matched pairs, to lighting conditions. One-hundred-and-eighteen people participated in the larger experiment. For the two lighting designs of interest here, for the Ambient Only design there were 30 participants, 15 male and 15 female, mean age ~ 28; for the Ambient+Task design there were 28 participants, 15 male and 13 female, mean age ~ 29.
2.1.4 Experimental Procedure
Before beginning the experiment, participants were able to adjust their office chair and keyboard tray, but could not alter the computer screen luminance, tilt or position because of the effect of these choices on important visibility-related outcomes. In the Ambient+Task design, participants were not allowed, initially, to change the position of the task light.
For the remainder of the one-day session the participant was guided by instructions on the computer screen. The morning coffee break was preceded by practice sessions for some performance tasks, the first administration of the Vision Test, and the first administration of some questionnaires. The rest of the day was divided into three parts (pre-lunch, pre-afternoon break, post-afternoon break) with similar repetitions of tasks. When participants returned from an afternoon coffee break, on-screen instructions informed them that they now had control over their lighting, using an on-screen dimmer. In the Ambient Only design, this meant dimming control over the recessed parabolics; in the Ambient+Task design this meant dimming control over the recessed parabolics, and the ability to move the arm of the task light. More information on the procedure is available in Newsham et al. [2003].
2.1.5 Simulated Office Tasks and Questionnaires
The tasks and questionnaires completed by the participants are described briefly below. More information on these is available in Newsham et al. [2003].
Vision Test. We measured contrast sensitivity using custom software. A target grating was presented on the computer screen at various contrasts, and the participant’s task was to indicate, as fast as they could, whether they saw a target or not. For analysis we combined response times and accuracy scores to form a composite visual performance score.
Visual and Physical Comfort. Participants indicated the intensity of eight symptoms of eye discomfort, and nine symptoms related to general physical discomfort.
Simple Cognitive/Clerical Performance. This was assessed using a typing task scored for speed and accuracy. Participants retyped three ~300-word passages from printed originals placed on a document holder close to the computer screen. For analysis the single dependent variable was correct characters typed per second.
Complex Cognitive Performance. There were three measures of this construct. All were based on short articles (200-300 words) on topics broadcast in the popular media:
1. Article Categorisation. The participant saw the first few sentences of an article on screen. Below the article was a list of four categories that might describe the article. Dependent measures were the speed and accuracy of categorisation.
2. Summary Evaluations. After the categorisation question, participants rated their interest in reading the whole article based on the summary. Then the entire article appeared, and
participants rated the summary for the facts it contained, its grammatical accuracy, and how well written it was.
3. Summary Extraction. Participants read an article on paper. A list of all the sentences appearing in the article in sequential order then appeared on screen. Participants indicated the four most important sentences, and the dependent measure was the time taken.
We analyzed outcomes from the first six trials in each session only, a number that everyone completed. There were three measures of speed. The first (CATTIM) was the time taken to make the category decision. The second (CATTR) was the time taken to complete the entire categorization trial, including category decision. The third (SUMTIM) was the total time taken to complete the extraction trial. The session scores were the mean times for the six trials within that session.
Conflict Resolution. Participants read scenarios describing common workplace conflicts, then indicated their preferred conflict resolution style for each scenario.
Vigilance/Alertness. There was an envelope icon on the computer screen. Participants were instructed that when the icon changed colour and they heard a 'beep', they should click on the icon as quickly as possible.
Motivation/Persistence. Symbols entered the screen from the left, travelling along a black line similar to a conveyor belt. Certain symbols were designated as targets, and participants were instructed to remove them as quickly as possible by pressing the keyboard spacebar. The speed that the symbols travelled increased and participants were instructed to stop when they could no longer keep up. The measure of persistence was the speed at which they stopped responding. We also measured the rate of target removal at a lower speed as a Vigilance/Alertness outcome, this was the average hit rate at the third highest speed (~1.1 symbols/sec). We chose this speed for analysis because the task was becoming more challenging, but the participants were still responding normally.
Environmental Competence. This questionnaire assessed office workers' feelings of competence to create desirable environmental conditions.
Mood. Mood was assessed using the Russell and Mehrabian 3-Factor Mood Scale [Russell & Mehrabian 1977], for ratings of Pleasure, Arousal, and Dominance.
Room Appraisal. This was assessed using a set of 27 semantic differentials based on well-known lighting research [Flynn et al. 1979; Loe et al. 1994].
Lighting Preferences. We used the lighting quality scale developed by Veitch & Newsham [2000a], which includes scales for lighting satisfaction and glare dissatisfaction.
Workplace Satisfaction. Three sets of ratings scales to assess overall environmental satisfaction, satisfaction with performance, and the effect of the environment on self-assessed productivity. Workday Experiences. We asked questions about the difficulty of the tasks, and participant beliefs concerning the nature of the study. We also asked participants how willing they would be participate for a second day, and to complete additional questionnaires at home.
Lighting Control Evaluation. A five-item scale on the ease of use of the lighting controls, the speed of response of the system, and the ability of the system to create preferred conditions.
2.1.6 Physical Measurements
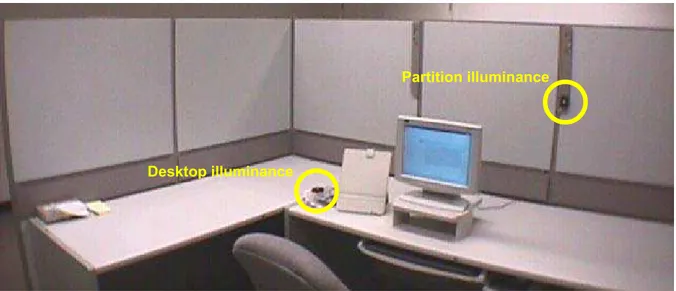
We recorded illuminance at typical desktop and partition locations in each workstation using Minolta T-10M illuminance meters (Fig. 3). Readings were taken automatically every time a participant enacted a control action, and were also triggered manually by the experimenter at the start of the day, and during breaks. In addition, all control signals were recorded, enabling us to
recreate the various conditions after the session had been completed. This allowed us to do more detailed post-hoc photometry, reported in Newsham et al [2004].
Desktop illuminance
Partition illuminance
Fig. 3. Fixed photometric measurement points.
2.2 Results
This experiment had a 4 x 4 x 3 (lighting design x starting illuminance x time-of-day) design. Lighting design and starting illuminance were varied between subjects, and time-of-day was a within-subjects variable. In this paper we focus on the effect of lighting design, in particular, the Ambient Only vs. Ambient+Task contrast.
2.2.1 Participants preferred luminous conditions
Table 3 gives descriptive statistics for chosen desktop and partition illuminances, and chosen ambient dimmer settings, at the end of the day. The average preferred desktop illuminance varied by lighting design, not surprising given the expected influence of the task light. Choices also varied substantially between participants.
TABLE 3. Descriptive statistics for the illuminance measured at the end of the day, by lighting design. More detail on illuminance uniformity across the desk is given in Newsham et al. [2004]
Desktop Illuminance, lx Partition Illuminance, lx Ambient Dimmer Setting, % Ambient Only Ambient +Task Ambient Only Ambient +Task Ambient Only Ambient +Task N 30 28 30 26 30 28 Minimum 33 188 13 33 0 0 Maximum 944 1478 418 414 99 99 Median 413 544 169 224 41.5 48.5 Mean 452 582 201 211 46.7 47.0 Standard Dev 241 278 112 102 26.1 23.4 A t-test on ambient dimmer settings by lighting design showed no significant difference (t56=-0.05, tcrit=2.00). That is, the provision of a task light did not change the chosen level of ambient lighting from ceiling-recessed parabolics.
2.2.2 The effect of task lighting on mood, satisfaction, and performance
We conducted a series of analyses of variance. When there was only one outcome the tests were univariate (ANOVAs), when there was more than one related outcome the tests were multivariate (MANOVAs). In some cases simple transformations were applied to outcome variables to improve the normality of data distribution. To avoid Type I statistical errors, we examined univariate effects within MANOVAs only if the overall MANOVA was significant. In this paper we focus on the effect of lighting design, and the Ambient Only vs. Ambient+Task contrast, and the interactions with time-of-day. Detailed information on all the significant effects outside the scope of this paper are available in Newsham et al. [2003] and Newsham et al [2004]. Some performance tasks included within-subject variables particular to the task; e.g. contrast on the Vision Test, and print size for the Typing Task. These effects were tested and followed expectations; details are available in Newsham et al [2004].
Most outcomes were measured at three general times of day: pre-lunch (T1), pre-afternoon break (T2), and post-afternoon break after control was introduced (T3). In such cases, we conducted tests on two single degree-of-freedom contrasts: T1 vs. T2 and T2 vs. T3. Note that the latter comparison is not a simple time-of-day effect, it also includes the effect of introducing control. These effects are confounded, but are difficult to counterbalance because providing control earlier in the day and then removing it would have created a further problem of resentment. When the main topic of interest was the effect of control, and not lighting design, we attempted to tease apart the confound by comparison to other studies (see Newsham et al. [2004]). It is true that the type of control introduced differed between designs (ambient dimming only vs. ambient dimming plus movement of the task light arm), but this difference was small, and the main variable of interest, ambient dimmer setting, was manipulated in an identical manner. There were no significant effects of lighting design on the mood, satisfaction, and discomfort outcomes. (However, there were many positive effects associated with the introduction of control [Newsham et al. 2003]). However, there were both significant main effects and interactions for task performance outcomes, as shown in Table 4; data for significant effects only are shown. On the Vision test, there was one significant interaction of lighting design x time-of-day, from T1 to T2. Although performance improved for both lighting designs from T1 to T2, the improvement was higher for Ambient Only.
For Typing, there was a significant main effect of lighting design: typing speed for Ambient+Task was higher than for Ambient Only. The mean difference was large, at 24%.
For speed and accuracy outcomes on the Cognitive performance tasks, there were two significant lighting design x time-of-day interactions. For CATTR, from T2 to T3, Ambient+Task participants improved at a greater rate than Ambient Only participants, though they still took longer at T3, on average. For SUMTIM, from T2 to T3, Ambient+Task participants improved their performance at a greater rate than Ambient Only participants, they were slower at T2, and about equal at T3. For Vigilance/Alertness there was a significant main effect of lighting design: performance for Ambient+Task was higher than for Ambient Only, the mean difference was large, at 42%.
TABLE 4. Summary of the analyses of task performance outcomes. Data for statistically significant tests only are shown. *p < 0.05, ** p < 0.01; M = mean, SD = standard deviation.
VISION (correct/sec) Ambient Only Task +Ambient ANOVA T1 M (SD) 0.783 (0.267) 0.820 (0.340) T2 M (SD) 1.101 (0.258) 1.014 (0.290) F(1,114) = 5.45*; η2 partial = 0.046 TYPING (char/sec) Ambient Only Task +Ambient M (SD) 2.57 (0.88) 3.19 (1.38) ANOVA F(1,101) = 5.30*; η2 partial = 0.050
COGNITIVE Lighting Design Ambient Only Task +Ambient univariate effects CATTR(sec) T2 M (SD) 76.6 (27.9) 92.9 (34.6) T3 M (SD) 73.9 (36.1) 80.6 (31.0) F(1,114) = 5.20*; η2 partial = 0.044 SUMTIM(sec) T2 M (SD) 113.7 (28.4) 126.6 (49.7) T3 M (SD) 104.5 (35.4) 104.8 (37.1) F(1,114) = 5.67*; η2 partial = 0.047 MANOVA Wilks’ Λ = 0.910; F(4,111) = 2.75*; η2 partial(ave) = 0.030 VIGILANCE Ambient Only Task +Ambient HITS(sym/s) M (SD) 2.57 (0.88) 3.19 (1.38) univariate effect F(1,93) = 7.55**; η2 partial = 0.075 MANOVA Wilks’ Λ = 0.902; F(2,92) = 4.99**; η2 partial(ave) = 0.045
2.3 Discussion: Experiment 1
Considering preferred luminous conditions, it is interesting to note that for the most conventional design, Ambient Only, the average desktop illuminance resulting from control choices was 400 – 450 lx, typical of other studies [e.g. Veitch & Newsham 2000a], and recommended practice [IESNA 2000]. However, the average partition illuminance, around 200 lx for both designs, is considerably higher than the 50 lx in IESNA recommended practice [IESNA 2000].
The effects of lighting design on task performance were few and mixed, but, on balance, tended to favour the Ambient+Task design over the Ambient Only design. This was most marked for the typing task, for which participants worked to transcribe a text on paper into the computer. This task might be expected to benefit most from the presence of a task light to highlight the paper text, even in the arm’s initial location.
The fact that the chosen ambient dimmer setting did not differ between the two lighting designs was intriguing in that it contradicted commonly proposed office lighting design advice, which holds that a primary route to energy savings is to reduce ambient lighting levels and to compensate with local task lighting of lower wattage. If participants felt that task lighting fully compensated for ambient lighting then they would have lowered their preferred ambient lighting level when task lighting was introduced. We did not observe this, suggesting that task lighting was employed as a supplement to ambient lighting, not a replacement for it. Given the potential impact on
recommended practice, we decided to follow up on this result with a second study (Experiment 2) on office workers’ preferred ambient lighting choice in the presence of task lighting.
3 EXPERIMENT 2
3.1 Methods and Procedures 3.1.1 The Experimental Space
The experimental space was the same as in Experiment 1.
3.1.2 The Lighting Designs
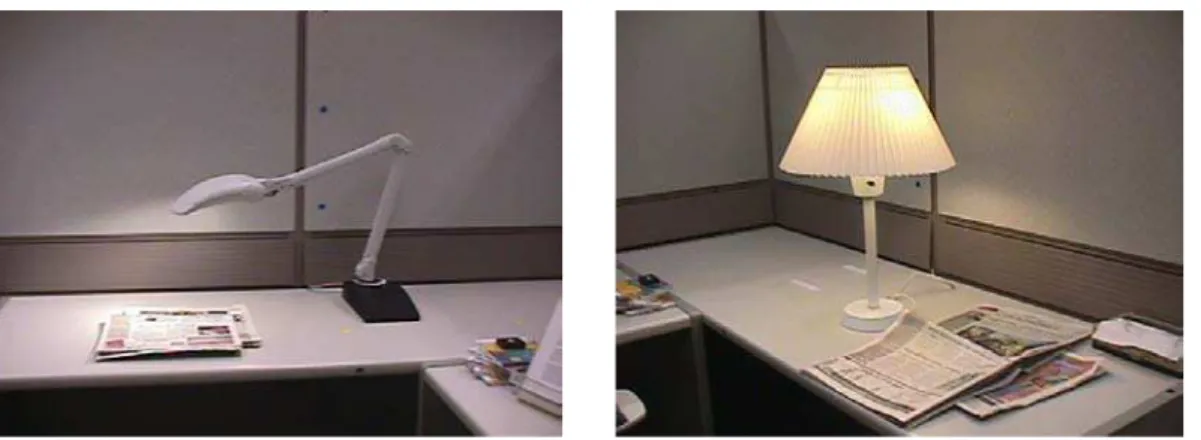
The ambient lighting system, ceiling-recessed deep-cell parabolic luminaires, was the same as in Experiment 1. Two different desk-mounted task lights were used: the same angle-arm task light used in Experiment 1 in one workstation (though with a dimmable version of the quad CFL, 3500 K, CRI=82), and a luminous-shade table lamp in the other workstation (23W dimmable CFL, 2700 K, CRI=82). Figure 4 shows the two task lights.
3.1.3 Participants
articipants were employees at our own institute from groups not involved in lighting research.
.1.4 Experimental Procedure
he experimenter took the participant to one of the two workstations (randomly assigned) where nt vited to
puter,
he experiment consisted of seven trials. Each trial was a combination of ambient and task light
l
or each of the seven trials, an instruction on the computer screen prompted the participant to e d nt ess d the .1.5 Physical Measurements
he physical measurements during the session were the same as those done in Experiment 1.
.2 Results
P
Detailed demographic data were not collected, but participants met the following criteria: at least 18 years of age; normal or corrected-to-normal vision; no disabilities interfering with office work. The compensation for participation was a free drink and snack. Thirty-five people participated, and data from 31 participants were retained for final analyses; 18 were male and 13 female, and they were in the approximate age range 20-60. We tested neither sex or age effects in the analyses.
3
T
they adjusted their chair and keyboard tray. They were not permitted to change the computer screen luminance, tilt or position, nor were they permitted to change the position of the docume holder. All luminaires in both workstations were set to 50% of full light output before the participant entered (providing 300 – 500 lx on the desk area). The participant was then in
put the task light where they would prefer it to go; for the angle-arm light, the base of the light was fixed, but the head had a large range of movement; for the luminous shade light, the base moved anywhere on the desktop to the right of the computer screen. When making their choice,
participants considered tasks on the computer screen, the document holder next to the com and on the desktop. Once they chose a preferred task light position they could not change it for the rest of their time in that workstation.
T
lighting settings as a starting point for a judgement about the participant's preferred ambient level. The first trial was a practice trial for which the starting point was task light at 95% of full output and ambient light at 35% of full output. Six sets of initial lighting conditions were the rea trials. For these trials, which were presented in random order, the task light output was fixed at either 0%, 50% or 95% output, for each initial ambient lighting level of 35% or 70% output. F
look at the wall behind them. Then all lights in the room were raised to 100% light output for fiv seconds before a new lighting condition was set; this was designed to prevent direct comparison of lighting conditions from one trial to the next. The computer then prompted the participant to turn to face the computer again. A new screen on the computer prompted the participant to rea an article on the computer screen, read the newspaper on the desk, look at the document on the document holder, and look at other areas of the workstation. During this time the participant became adapted to the new condition. After 60 seconds the computer prompted the participa to use on-screen dimmer buttons to modify the ambient light output to their preferred level. The buttons allowed for changes of ±20% or ±5% of full light output. After they finalized their selection, the computer prompted the participants to face the rear wall again, and the proc was repeated for another lighting condition. After repeating this process for seven lighting conditions in one workstation, the lights were returned to 50% and the experimenter escorte participant to the other workstation where they repeated the same process for the other task light. Participants took around 30 minutes to complete the experimental session.
3
T
Readings were taken automatically every time a participant finalized their preferred ambient lighting output for each condition.
This experiment had a 2 x 2 x 3 (task light type x task light output x initial ambient light output) within-subjects design. In our statistical analysis we analyzed three outcome variables:
• ambient dimmer choice, this is the most important outcome for determining potential energy savings due to task light provision.
• desktop illuminance and partition illuminance; these are the most important (and easily collected) variables for providing information on preferred luminous environment. We analyzed ambient dimmer choice using a repeated-measures ANOVA, and analyzed both illuminances together using a repeated-measures MANOVA1. Results are shown in Tables 5-6.
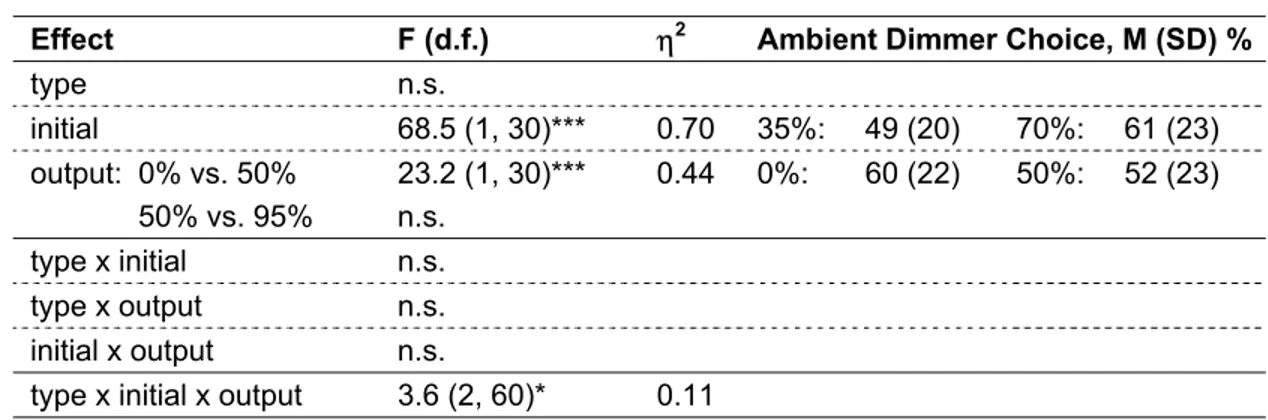
TABLE 5. Summary of ANOVA on ambient dimmer choice. ‘type’ = effect of task light type (angle-arm or luminous shade); ‘initial’: initial ambient dimmer setting (35% or 70%); ‘output’: task
light output dimmer setting (0%, 50%, or 95%). *: p<0.05; **: p<0.01; ***: p<0.001. η2 = percentage variance in outcome explained by effect. ‘n.s.’ = effect not significant.
Effect F (d.f.) η2 Ambient Dimmer Choice, M (SD) %
type n.s. initial 68.5 (1, 30)*** 0.70 35%: 49 (20) 70%: 61 (23) output: 0% vs. 50% 23.2 (1, 30)*** 0.44 0%: 60 (22) 50%: 52 (23) 50% vs. 95% n.s. type x initial n.s. type x output n.s. initial x output n.s.
type x initial x output 3.6 (2, 60)* 0.11
Table 5 shows a significant main effect of initial ambient light output setting: the higher the initial ambient light setting, the higher the chosen ambient light output setting. The explanation for this effect depends on how context-dependent lighting preferences are. If preferences are stable independent of context then this effect is an artifact of the experimental design, likely due to the short exposure times. When the initial ambient level was high (70%) participants chose a lower average level (61%), when the initial ambient level was low (35%) participants chose a higher average level (50%). We can speculate that with longer exposure, preference for ambient light level will converge independent of initial level, but this remains to be tested.
There was also a significant decrease in chosen ambient light output with increasing task light output from 0 to 50%, but there was no further decrease when task light output was increased to 95%. Increasing task light setting from 0% to 50% required an extra 10-12 W. This produced an average decrease in ambient light setting from 60% to 52%, equivalent to a decrease in power of 13 W. Therefore, the decrease in ambient lighting power due to the provision of a task light barely compensated for the power required to supply the task light itself.2
Table 6 shows a significant effect of initial ambient light output setting on illuminance. There was also a large increase in desktop illuminance with increasing task light output, not surprising given the proximity of the task light to the desktop illuminance measurement location.
1
The distribution of ambient dimmer choices was not ideally normal. Normal distribution is a pre-condition for analysis of variance. However, the distributions were not very skewed, and transformation would have produced a non-intuitive outcome variable. Distributions of the other outcome variables, desktop and partition illuminance, were approximately normal.
2
There was a significant three-way interaction between task light type, ambient lighting initial setting, and task light output setting. This is a relatively small effect, difficult to interpret (like all three-way interactions), and did not modify the conclusions based on the main effects, and so we will not describe it in any further detail.
More interesting are the effects on partition illuminance. There were significant main effects of task light type and output, but also a significant interaction, which modifies the interpretation of these main effects. Partition illuminance was higher at non-zero task light outputs for the
luminous shade task light. This was expected given the luminous distributions of the task lights. The angle-arm task light delivers little light above the plane of the lamp and is unlikely to affect the partition; the luminous shade task light is a more global emitter. The effect of task light output from 0 to 50% is present only for the angle-arm task light. When task light output increases from 0 to 50% chosen ambient light output goes down, and therefore less ambient light is delivered to the partition. For the luminous shade task light, with its more global light distribution, the increase in task light output compensates for this.
TABLE 6. Summary of MANOVAs on illuminance. ‘type’ = effect of task light type; ‘initial’: initial ambient dimmer setting; ‘output’: task light output dimmer setting. *:p <0.05; **: p<0.01; ***: p<0.001. η2 = percentage variance in outcome explained by effect. ‘n.s.’ = effect not significant.
Univariate effects
Effect Outcome F (d.f.) η2 MANOVA
type desktop n.s.
partition 19.6 (1, 30)*** 0.40 arm: 211 (78) shade: 241 (87)
Wilks’ Λ=0.56, F=11.5 (2,29)***, ηave2=0.21 initial desktop 62.7 (1, 30)*** 0.68 35%: 611 (274) 70%: 697 (287) partition 75.4 (1, 30)*** 0.72 35%: 204 (76) 70%: 248 (86) Wilks’ Λ=0.28, F=37.4 (2,29)***, ηave 2 =0.70 output 0% vs. 50% desktop 27.1 (1, 30)*** 0.48 0%: 501 (171) 50%: 640 (216) partition 11.4 (1, 30)** 0.28 See task x output interaction
Wilks’ Λ=0.33, F=29.9 (2,29)***, ηave 2 =0.38 50% vs. 95% desktop 79.8 (1, 30)*** 0.73 50%: 640 (216) 95%: 822 (337) partition n.s. Wilks’ Λ=0.27, F=38.6 (2,29)***, ηave2=0.38 type x initial n.s. type x output 0% vs. 50% desktop n.s.
partition 6.9 (1, 30)* 0.19 Angle arm
0%: 231 (78) 50%: 198 (75) Lumin. shade 0%: 244 (83) 50%: 238 (89) Wilks’ Λ=0.81, F=3.4 (2,29)*, ηave2=0.12 50% vs. 95% n.s. initial x output n.s. type x initial x output3
Table 7 shows the illuminances at the fixed measurement points resulting from participants’ lighting choices, for each task light output setting.
3
There was a significant three-way interaction between task light type, ambient lighting initial setting, and task light output setting for partition illuminance, between 50% and 95% task light output. This is a relatively small effect, difficult to interpret (like all three-way interactions), and did not modify the conclusions based on the main effects, and so we will not describe it in any further detail.
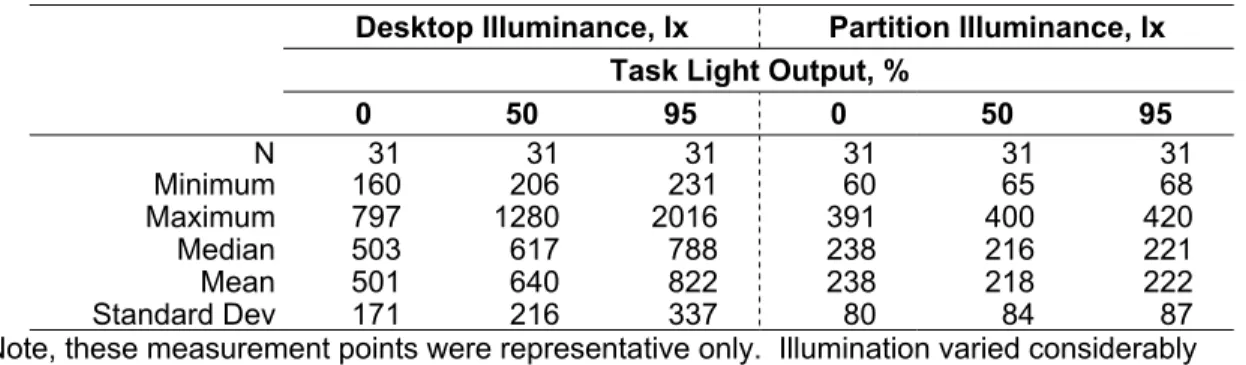
TABLE 7. Descriptive statistics for chosen desktop illuminance and partition illuminance vs. task light setting. Data are collapsed over initial ambient setting and task light type.
Desktop Illuminance, lx Partition Illuminance, lx Task Light Output, %
0 50 95 0 50 95 N 31 31 31 31 31 31 Minimum 160 206 231 60 65 68 Maximum 797 1280 2016 391 400 420 Median 503 617 788 238 216 221 Mean 501 640 822 238 218 222 Standard Dev 171 216 337 80 84 87
Note, these measurement points were representative only. Illumination varied considerably across surfaces.
3.3 Discussion: Experiment 2
To compare preferred luminous conditions to recommended practice for general office lighting, consider the case with no light from the task lights and parabolic ambient lighting only: the average illuminance on the desktop was 500 lx, and the average illuminance on the partition was 240 lx. This compares with the values recommended by the IESNA [2000] for general VDT work in an open-plan office of 500 lx for horizontal illumination and 50 lx for vertical illumination. Note that the latter recommendation for vertical surfaces is for ‘orientation and simple visual tasks’. If there were papers tacked to vertical surfaces with small text, for example, higher illuminances would be recommended, but in our study the furniture partitions were “clean”. While the average desktop illuminance after dimming choice was in line with IESNA recommendations, the average partition illuminance was substantially higher. Note also the wide variation in individual
preferences for illuminance, consistent with other observations in similar settings [Veitch & Newsham 2000b]. These observations concur with Experiment 1 findings.
Also in agreement with Experiment 1, we found that the provision of task lighting did not lead to large reductions in preferred ambient lighting. If participants were controlling ambient light output primarily to maintain desktop illuminance on paper-based tasks they would have reduced ambient light output substantially with increasing task light output. This was not the case as shown in Table 7, in fact, it was the partition illuminance that, on average, remained reasonably constant, suggesting a preference for a maintained vertical illuminance.
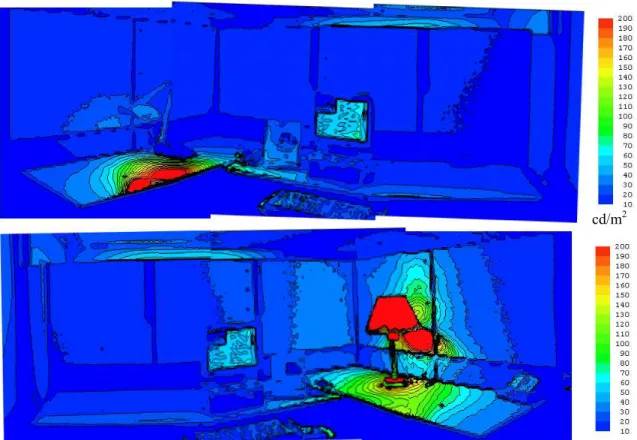
In the Introduction previous research had indicated the importance of luminance ratios in creating a satisfactory lit environment. Figures 5 and 6 show luminance maps for two representative lighting conditions, measured using a Radiant Imaging Prometric video photometer. Figure 5 illustrates a lighting design similar to that suggested by Green Star [GBCA 2004], where ambient lighting provides 100-150 lux on the desktop, and is supplemented by task lighting. With our lighting equipment, the ambient lighting is at 15% output, and the task light is at 95% output. Considering luminance ratios, the IESNA [2000] recommends that the luminance ratio between a task and adjacent surrounds should not exceed 3:1, and across a person’s field of view, the ratio of maximum to minimum should not exceed 10:1. The situation in Fig. 5 violates these
recommendations: the luminance ratio between the desktop below the task light and the
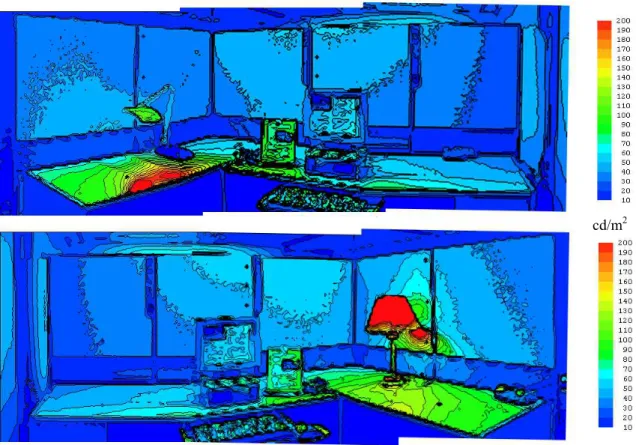
document holder is ~ 6:1, and between the desktop below the task light and the computer screen is ~ 4:1. Across a larger field of view, the luminance ratio between the desktop below the task light and the partitions is approximately 15:1. Figure 6 depicts a situation similar to the average preferred condition from this experiment, where both the ambient and task lighting are at 50% output. Illuminance close to the task light is still high, and illuminances at more distant points on the desktop are around 300-500 lx. The luminance ratios in this case are closer to
is ~ 2.5:1, and between the desktop below the task light and the computer screen is ~ 4:1. Across a larger field of view, the luminance ratio between the desktop below the task light and the partitions is approximately 6:1.
cd/m2
Fig. 5. False-colour luminance map for workstations with angle-arm task and luminous shade task lights, ambient lighting at 15% of full output, task lighting at 95% of full output.
cd/m2
Fig. 6. False-colour luminance map for workstations with angle-arm task and luminous shade task lights, ambient lighting at 50% of full output, task lighting at 50% of full output.
4. DISCUSSION
Here we synthesize the results from both experiments, to answer various questions of interest.
4.1 What are preferred luminous conditions?
The results generally confirm the results of other similar studies of office worker lighting
preferences [Newsham et al. 2002; Veitch & Newsham 2000a; Newsham & Veitch 2001; Loe et al. 1994; Berrutto et al. 1997]. With conventional lighting systems, average preferred desktop illuminances were in the 400-500 lx range, and average preferred partition illuminances were in the 200-250 lx range, resulting in luminances on the partitions of around 30-40 cd/m2. This supports current recommended practices [for example, IESNA 2000; ANSI/IESNA 1993; CIBSE 1994; CIBSE 1993] for desktop illuminance, but suggests higher preferred vertical illuminance than IESNA recommendations.
4.2 What is the effect of task lighting on mood, satisfaction, and performance?
In Experiment 1 we found that the addition of a task light to a ceiling-recessed, deep-cell parabolic ambient lighting system had no significant effect on mood, satisfaction, or discomfort. The results related to task performance were few and mixed, but, on balance, tended to favour the Ambient+Task design over the Ambient Only design. The most obvious explanation for an improvement in typing speed is the provision of more light on the paper-based target text, leading to an improvement in visibility. The mechanism for improvements on other performance
4.3 Does adding a task light save energy?
The short answer, based on occupant preference for ambient lighting, is no. In Experiment 1, in a between-subjects design, adding an angle-arm task light did not change the preference for ambient light output. In Experiment 2, in a within-subjects design, adding an angle-arm or a luminous shade task light at low output did reduce preference for ambient light output, but only by a small amount. The small reduction in ambient lighting power was approximately equal to the power required by the task light.
The rationale for energy savings with task/ambient lighting designs is that ambient lighting can be reduced because the task light can maintain illumination, and therefore visibility, of the localised task. This might be the chief concern when the primary task is paper-based and on the desktop, but the primary task for most modern office workers involves looking at a self-luminous computer screen in the vertical plane. In such a situation direct illumination of the task is of little relevance. Indeed Rea [1983], writing at a time when most office work was paper-based, noted that: “… the ultimate viability of task lighting does not rely so much upon its ability to provide high illumination levels but, more correctly, upon its ability to deliver a suitable luminous environment for seeing tasks.” (p. 174). This conclusion was reinforced by Bernecker et al. [1993] (p.24). When the goal is to see a task on a computer screen, Experiment 2 suggests that occupants prefer to maintain illumination on vertical surfaces and to experience moderate luminance ratios in the field of view, something that the task lights used in these experiments could not do.
In summary, although office workers might be willing to accept lower ambient lighting levels when a task light is provided, as suggested by earlier studies referenced in the Introduction, it is not their preferred luminous environment. Task lighting should be considered as a useful supplement to ambient lighting, with some evidence for performance improvements, rather than a
replacement for it. In a field setting, a small reduction in ambient lighting level is reasonable in the presence of task lighting. In the office areas these savings will be cancelled out by the power required by the task lights, however, modest savings will accrue in circulation spaces, and if occupants switch task lights off when they leave the space.
5. CONCLUSIONS
As with all research, the conclusions must be considered in the context in which the research was carried out. Our experiments were conducted in an office laboratory with a particular furniture type, a single type of ambient luminaire and two types of desktop task lights. The primary tasks were computer-based, and, particularly in Experiment 2, exposure to conditions was short. In this context, our principal conclusions are:
• There was no evidence, based on occupant preferences for lighting, that provision of task lighting as a replacement for ambient lighting leads to large energy savings in offices. Following such a strategy for reasons of energy efficiency may backfire in the long-term by creating sub-optimal lighting conditions.
• Provision of task lighting as a supplement to preferred levels of ambient lighting led to improvements in performance on some tasks. Future research should examine the mechanism for such improvements.
• Current recommended practice for ambient lighting on the desktop of 400-500 lx is appropriate based on average occupant preferences. However, recommended practice for illuminance on vertical surfaces such as partitions should be revised upward, to 200-250 lx.
6. ACKNOWLEDGEMENT
Experiment 1 was sponsored by the National Research Council Canada (NRC), the Program on Energy Research & Development, and Public Works & Government Services Canada (PWGSC). Experiment 2 was supported by the Climate Change Plan for Canada,Technology and Innovation
R&D Initiative (CCTI), BC Hydro Power Smart, and the National Research Council. We are also indebted to. The authors are also grateful for the technical help provided by Roger Marchand (NRC), Hervé Guitet (INSA-Lyon), and Jana Svec (NRC), and for the support and encouragement from Morad Atif (NRC), Ivan Pasini (PWGSC) and Karen Pero (PWGSC), Cristian Suvagau (BC Hydro), and Roy Hughes (BC Hydro).
7. REFERENCES
ANSI/ IESNA. 2004. American national standard practice for office lighting ANSI/IESNA-RP-1-04. New York: Illuminating Engineering Society of North America.
Bean AR, Hopkins AG. 1980. Task and background lighting. Lighting Research and Technology 12(3): 135-139.
Bernecker CA, Davis RG, Webster MP, Webster JP. 1983. Task lighting in the open office: a visual comfort perspective. Journal of the Illuminating Engineering Society 22(1): 18-25. Berrutto V, Fontoynont M, Avouac-Bastie P. 1997. Importance of wall luminance on users satisfaction: pilot study on 73 office workers. Proceedings of Lux Europa – 8th European Lighting Conference (Amsterdam) Arnhem: NSVV: 82-101. .
Boyce PR. 1979. Users’ attitudes to some types of local lighting. Lighting Research and Technology 11(3): 158-164.
Boyce PR, Veitch JA, Newsham GR, Myer M, Hunter C. 2003. Lighting quality and office work: a field simulation study (PNNL 14506). Richland, WA, USA: Pacific Northwest National Laboratory. http://irc.nrc-cnrc.gc.ca/fulltext/B3214.1/. Last accessed Nov. 2004.
CIBSE. 1993. Lighting for offices, LG7. Chartered Institution of Building Services Engineers, London, UK.
CIBSE. 1994. Code for interior lighting. London, UK: Chartered Institution of Building Services Engineers.
Collins B L, Fisher WS, Gillette GL, Marans RW 1989. Evaluating office lighting environments: second level analysis. NIST Report NISTIR 89-4069, 129 pages. (also published in abbreviated form in Journal of the Illluminating Engineering Society 19(2): 21-44).
Fischer D. 1980. General lighting versus local lighting in offices. International Lighting Review (4): 108-110.
Flynn JE, Hendrick C, Spencer T, Martyniuk O. 1979. A guide to methodology procedures for measuring subjective impressions in lighting. Journal of the Illuminating Engineering Society 8: 95-110.
GBCA. 2004. Green star environmental rating system for buildings: office interiors (pilot). Green Building Council Australia.
IESNA. 2000. Lighting handbook 9th edition (Ed: Rea M). New York, NY, USA: Illuminating Engineering Society of North America
LBNL. City of Berkeley (14 Person Office), http://eetd.lbl.gov/BTD/lsr/ld_table_case2.html. participant surveys, http://eetd.lbl.gov/BTD/lsr/ld_table_case9.html. Last accessed Nov. 2004. Loe DL, Mansfield KP, Rowlands E. 1994. Appearance of lit environment and its relevance in lighting design: experimental study. Lighting Research and Technology 26 (3): 119-133.
McKennan GT, Parry CM. 1984. An investigation of task lighting for offices. Lighting Research and Technology 16(4): 171-186.
New Buildings Institute. 2001. Advanced lighting guidelines. http://www.newbuildings.org/lighting.htm. Last accessed Nov. 2004.
Newsham GR, Veitch JA. 2001. Lighting quality recommendations for VDT offices: a new method of derivation. Lighting Research and Technology 33 (2): 97-116.
Newsham GR, Arsenault C, Veitch JA. 2002. Preferred surface illuminances and the benefits of individual lighting control: a pilot study. Proceedings of the IESNA Annual Conference (Salt Lake City): 101-113.
Newsham GR, Veitch JA, Arsenault C, Duval C. 2003. Lighting for VDT workstations 1: effect of control on energy consumption and occupant mood, satisfaction and discomfort. IRC Research Report RR-165. Ottawa, ON, Canada: National Research Council.
http://irc.nrc-cnrc.gc.ca/fulltext/rr165/ Last accessed Nov. 2004.
Newsham GR, Veitch JA, Arsenault C, Duval C. 2004. Lighting for VDT workstations 2: effect of control on task performance, and chosen photometric conditions. IRC Research Report RR-166. Ottawa, ON, Canada: National Research Council.
http://irc.nrc-cnrc.gc.ca/fulltext/rr166/. Last accessed Nov. 2004.
Rea MS. 1983. Behavioral responses to a flexible desk luminaire. Journal of the Illuminating Engineering Society 13(1): 174-190.
Russell JA, Mehrabian A. 1977. Evidence for a three-factor theory of emotions. Journal of Research in Personality 11: 273-294.
Tabuchi Y, Matsushima K, Nakamura H. 1995. Preferred illuminances on surrounding surfaces in relation to task illuminance in office room using task-ambient lighting, Journal of Light & Visual Environment 19(1): 28-39.
Tiller DK, Pasini IC, Jaekel RR, Newsham GR, Iwata T. 1995. Furniture mounted lighting system performance: 1. Lighting energy consumption. Proceedings of the CIE 23rd Session (New Delhi, India): 296-297.
Veitch JA, Newsham GR. 1998. Lighting quality and energy-efficiency effects on task performance, mood, health, satisfaction and comfort. Journal of the Illuminating Engineering Society 27 (1) Winter: 107 -129.
Veitch JA, Newsham GR. 2000a. Exercised control, lighting choices, and energy use: an office simulation experiment. Journal of Environmental Psychology 20 (3) September: 219-237. Veitch JA, Newsham GR. 2000b. Preferred luminous conditions in open-plan offices: Research and practice recommendations. Lighting Research and Technology 32: 199-212.
Wolsey R, Miller N. 1994. Lighting answers: task lighting for offices. National Lighting Product Information Program 1 (3): 8 pages. Lighting Research Center: Try, NY.
Yamakawa K, Watabe K, Inanuma M, Sakata K, Takeda H. 2000. A study on the practical use of a task and ambient lighting system in an office. Journal of Light & Visual Environment 24(2): 15-18.