HAL Id: hal-00330275
https://hal.archives-ouvertes.fr/hal-00330275
Submitted on 9 Nov 2007HAL is a multi-disciplinary open access
archive for the deposit and dissemination of sci-entific research documents, whether they are pub-lished or not. The documents may come from teaching and research institutions in France or abroad, or from public or private research centers.
L’archive ouverte pluridisciplinaire HAL, est destinée au dépôt et à la diffusion de documents scientifiques de niveau recherche, publiés ou non, émanant des établissements d’enseignement et de recherche français ou étrangers, des laboratoires publics ou privés.
Quality control of CarboEurope flux data – Part I:
Footprint analyses to evaluate sites in forest ecosystems
M. Göckede, T. Foken, M. Aubinet, M. Aurela, J. Banza, C. Bernhofer, J. M.
Bonnefond, Y. Brunet, A. Carrara, R. Clement, et al.
To cite this version:
M. Göckede, T. Foken, M. Aubinet, M. Aurela, J. Banza, et al.. Quality control of CarboEurope flux data – Part I: Footprint analyses to evaluate sites in forest ecosystems. Biogeosciences Discussions, European Geosciences Union, 2007, 4 (6), pp.4025-4066. �10.3929/ethz-b-000006696�. �hal-00330275�
BGD
4, 4025–4066, 2007 QAQC of CarboEurope flux data – footprints M. G ¨ockede et al. Title Page Abstract Introduction Conclusions References Tables Figures ◭ ◮ ◭ ◮ Back CloseFull Screen / Esc
Printer-friendly Version Interactive Discussion
EGU
Biogeosciences Discuss., 4, 4025–4066, 2007 www.biogeosciences-discuss.net/4/4025/2007/ © Author(s) 2007. This work is licensed
under a Creative Commons License.
Biogeosciences Discussions
Biogeosciences Discussions is the access reviewed discussion forum of Biogeosciences
Quality control of CarboEurope flux data –
Part I: Footprint analyses to evaluate sites
in forest ecosystems
M. G ¨ockede1,*, T. Foken1, M. Aubinet2, M. Aurela3, J. Banza4, C. Bernhofer5, J. M. Bonnefond6, Y. Brunet6, A. Carrara7, R. Clement8, E. Dellwik9, J. Elbers10, W. Eugster11, J. Fuhrer12, A. Granier13, T. Gr ¨unwald5, B. Heinesch2,
I. A. Janssens14, A. Knohl15,16, R. Koeble17, T. Laurila3, B. Longdoz13, G. Manca17, M. Marek18, T. Markkanen1,19, J. Mateus20, G. Matteucci21, M. Mauder1,**, M. Migliavacca22, S. Minerbi23, J. Moncrieff8, L. Montagnani23, E. Moors10, J.-M. Ourcival24, D. Papale25, J. Pereira26, K. Pilegaard9, G. Pita20, S. Rambal24, C. Rebmann15, A. Rodrigues27, E. Rotenberg28, M. J. Sanz7, P. Sedlak18,29, G. Seufert17, L. Siebicke1, J. F. Soussana30, R. Valentini25, T. Vesala19, H. Verbeeck14,***, and D. Yakir28
1
University of Bayreuth, Dept. of Micrometeorology, Bayreuth, Germany
2
University of Agricultural Sciences, Unit of Biosystems Physic, Gembloux, Belgium
3
BGD
4, 4025–4066, 2007 QAQC of CarboEurope flux data – footprints M. G ¨ockede et al. Title Page Abstract Introduction Conclusions References Tables Figures ◭ ◮ ◭ ◮ Back CloseFull Screen / Esc
Printer-friendly Version Interactive Discussion
EGU
4
University of Evora, Evora, Portugal
5
Technische Universit ¨at Dresden, Inst. of Hydrology and Meteorology, Dept. of Meteorology, Tharandt, Germany
6
INRA, EPHYSE, Bordeaux, France
7
Foundation CEAM, Valencia, Spain
8
University of Edinburgh, School of GeoSciences, Edinburgh, UK
9
Technical University of Denmark, Risø National Laboratory, Roskilde, Denmark
10
Alterra, Wageningen, The Netherlands
11
ETH Zurich, Institute of Plant Sciences, Zurich, Switzerland
12
Agroscope Research Station ART, Air Pollution/Climate Group, Zurich, Switzerland
13
INRA, Centre INRA Nancy, UMR1137 Ecologie et Ecophysiologie Foresti `eres, Champenoux, France
14
University of Antwerpen, Dept. of Biology, Research Group of Plant and Vegetation Ecology, Wilrijk, Belgium
15
Max Planck Institute for Biogeochemistry, Jena, Germany
16
ETH Zurich, Institute of Plant Sciences, Zurich, Switzerland
17
JRC, Inst. for Environment and Sustainability, Ispra, Italy
18
Institute of Systems Biology and Ecology AS CR, ˇCesk ´e Bud ˇejovice, Czech Republic
19
University of Helsinki, Dept. of Physical Sciences, Helsinki, Finland
20
Instituto Superior Tecnico, Lisbon, Portugal
21
CNR-ISAFOM, Institute for Mediterranean Agricultural and Forest Systems, Rende, Italy
22
Remote Sensing of Environmental Dynamics Lab., DISAT-UNIMIB, Milan, Italy
23
Forest Dept., Agency for the Environment, Autonomous Province of Bolzano-South Tyrol, Italy
24
INRA, DREAM CEFE-CNRS, Montpellier, France
25
University of Tuscia, Dept. of Forest Environment and Resources, Viterbo, Italy
26
Instituto Superior de Agronomia, Lisbon, Portugal
27
BGD
4, 4025–4066, 2007 QAQC of CarboEurope flux data – footprints M. G ¨ockede et al. Title Page Abstract Introduction Conclusions References Tables Figures ◭ ◮ ◭ ◮ Back CloseFull Screen / Esc
Printer-friendly Version Interactive Discussion
EGU
28
Weizman Institute of Science, Dept. of Environmental Sciences and Energy Research, Re-hovol, Israel
29
Institute of Atmospheric Physics AS CR, Praha, Czech Republic
30
INRA, Institut National de la Recherche Agronomique, Paris, France
∗now at: Oregon State University, Dept. of Forest Science, Corvallis, USA ∗∗now at: Agriculture and Agri-Food Canada, Research Branch, Ottawa, Canada
∗∗∗now at: Laboratory of Climate Sciences and the Environment (LSCE), Joint Unit of
CEA-CNRS, Gif-sur-Yvette, France
Received : 27 September 2007 – Accepted: 29 October 2007 – Published: 9 November 2007 Correspondence to: M. G ¨ockede (mathias.goeckede@oregonstate.edu)
BGD
4, 4025–4066, 2007 QAQC of CarboEurope flux data – footprints M. G ¨ockede et al. Title Page Abstract Introduction Conclusions References Tables Figures ◭ ◮ ◭ ◮ Back CloseFull Screen / Esc
Printer-friendly Version Interactive Discussion
EGU
Abstract
We applied a site evaluation approach combining Lagrangian Stochastic footprint mod-elling with a quality assessment approach for eddy-covariance data to 25 forested sites of the CarboEurope-IP network. The analysis addresses the spatial representative-ness of the flux measurements, instrumental effects on data quality, spatial patterns in 5
the data quality, and the performance of the coordinate rotation method. Our findings demonstrate that application of a footprint filter could strengthen the CarboEurope-IP flux database, since only one third of the sites is situated in truly homogeneous ter-rain. Almost half of the sites experience a significant reduction in eddy-covariance data quality under certain conditions, though these effects are mostly constricted to a small 10
portion of the dataset. Reductions in data quality of the sensible heat flux are mostly induced by characteristics of the surrounding terrain, while the latent heat flux is sub-ject to instrumentation-related problems. The Planar-Fit coordinate rotation proved to be a reliable tool for the majority of the sites using only a single set of rotation angles. Overall, we found a high average data quality for the CarboEurope-IP network, with 15
good representativeness of the measurement data for the specified target land cover types.
1 Introduction
Continuous monitoring of fluxes between biosphere and atmosphere using the eddy-covariance technique (e.g. Aubinet et al., 2000; Baldocchi et al., 2000) has become an 20
important tool to improve understanding of the role of different types of ecosystems as sources or sinks for greenhouse gases, with a particular focus on CO2. Datasets
gath-ered by extensive networks such as FLUXNET (Baldocchi et al., 2001), CarboEurope (Valentini et al., 2000) and Ameriflux (Law, 2005) allow studying detailed ecosystem functions across biomes (e.g. Law et al., 2002; Hibbard et al., 2005; Reichstein et al., 25
interan-BGD
4, 4025–4066, 2007 QAQC of CarboEurope flux data – footprints M. G ¨ockede et al. Title Page Abstract Introduction Conclusions References Tables Figures ◭ ◮ ◭ ◮ Back CloseFull Screen / Esc
Printer-friendly Version Interactive Discussion
EGU
nual variability (e.g. Wilson et al., 2002; Ciais et al., 2005; Reichstein et al., 2007a), or conducting inverse modeling studies to constrain carbon fluxes (e.g. Gerbig et al., 2003; Wang et al., 2007). Theoretical assumptions restrict the application of the eddy-covariance technique to conditions that often cannot be strictly observed (e.g. Kaimal and Finnigan, 1994; Lee et al., 2004; Foken, 2006), especially at sites placed in topo-5
graphically challenging terrain or surrounded by a heterogeneous land cover structure. Therefore, to ensure provision of high quality data for the growing community of flux data users, sophisticated protocols for the processing of eddy-covariance measure-ments (e.g. Mauder et al., 2006; Papale et al., 2006; Mauder et al., 2007b) as well as for quality assessment and quality control (QA/QC, e.g. Foken et al., 2004) have been 10
established.
In most of the studies using eddy-covariance databases on regional to continental scales, each site of the network is used to represent a certain biome type. Since for most sites the scale of horizontal variation is 1 km or less (e.g. Schmid, 2002), a distance that will often be exceeded by the fetch of the flux measurements (e.g. Jegede 15
and Foken, 1999), footprint analyses (e.g. Schuepp et al., 1990; Horst and Weil, 1994; Schmid, 1994; Leclerc et al., 1997; Rannik et al., 2000; Kljun et al., 2002) have to be performed to test under which conditions the assumption of spatial representativeness is valid. G ¨ockede et al. (2004) combined a flux data quality assessment approach (Foken et al., 2004) with analytic footprint modeling (Schmid, 1994; 1997) to address 20
this issue, and to identify correlations between flux data quality and characteristics of the terrain surrounding the flux site. Their approach was successfully applied by Rebmann et al. 2005) on 18 forest sites of the CARBOEUROFLUX network.
This study presents an update of the study by Rebmann et al. (2005), extending the work to the larger number of 25 CarboEurope-IP sites, which cover a wide range of 25
forest ecosystems, climate zones, and management regimes. The original site evalua-tion approach (G ¨ockede et al., 2004) has been replaced here by an improved version (G ¨ockede et al., 2006) that builds on a more sophisticated Lagrangian Stochastic foot-print algorithm (Rannik et al., 2000; 2003) and a more realistic approach to obtain
BGD
4, 4025–4066, 2007 QAQC of CarboEurope flux data – footprints M. G ¨ockede et al. Title Page Abstract Introduction Conclusions References Tables Figures ◭ ◮ ◭ ◮ Back CloseFull Screen / Esc
Printer-friendly Version Interactive Discussion
EGU
areally-averaged surface roughness lengths (Hasager and Jensen, 1999) as input for the model. The extended site evaluation scheme includes (i) a quality assessment of the eddy-covariance fluxes and spatial structures in data quality, (ii) analysis of the spatial representativeness in terms of land cover structure and (iii) assessment of the performance of the applied Planar-Fit coordinate rotation procedure (Wilczak et al., 5
2001). Combination of these measures identifies potential problems connected to ter-rain characteristics and instrumental setup that reduce data quality. Including these findings as of quality flags into eddy-covariance databases strengthens data reliability, allowing the user community to filter out measurements that do not meet the standards required for their specific studies.
10
2 Data
A total of 25 forested flux measurement sites of the CarboEurope-IP network were analyzed in the context of this study. Site names and main characteristics are listed in Table 1. Flux data processing for all participating sites followed the concept proposed by Aubinet et al. (2000), which has been further refined by Mauder et al. (2006, 2007b). 15
Original flow fields were rotated according to the planar fit method (Wilczak et al., 2001), and subsequently the Moore- (Moore, 1986), Schotanus- (Liu et al., 2001), and WPL-corrections (Webb et al., 1980) were performed. The corrected fluxes were checked for their quality according to a scheme proposed by Foken and Wichura (1996) in the revised version as presented by Foken et al. (2004), which rates eddy-covariance 20
fluxes by analyzing stationarity of the flow, the development of the turbulent flow field (using the so-called integral turbulence characteristics), and the deviation of the mean vertical wind component from zero. Their scheme assigns quality flags on a scale from one (best) to nine (worst) to each flux measurement. As a short guideline, fundamental research should be restricted to measurements with the highest data quality (classes 25
one to three), while classes four to six indicate good quality, and data can be used for calculating solid averages or long-term budgets of the exchange fluxes. Classes
BGD
4, 4025–4066, 2007 QAQC of CarboEurope flux data – footprints M. G ¨ockede et al. Title Page Abstract Introduction Conclusions References Tables Figures ◭ ◮ ◭ ◮ Back CloseFull Screen / Esc
Printer-friendly Version Interactive Discussion
EGU
seven and eight may be included for averaging purposes at the user’s discretion, but should be checked with care for plausibility because of significant deviations from the basic theoretical assumptions for the eddy-covariance technique. Measurements rated with quality class nine should be discarded in any case. This classification does not include a test for the presence of advective fluxes, which can act as a large selective 5
systematic error in the measurements and introduce large uncertainties into long-term budgets in addition to small errors in half-hourly measurements.
For the 25 sites that participated in this study, on average three months of flux data (minimum two months, maximum five months, Table 2) were provided (76 months of total raw data). The majority of the data (93%, or 71 months) was sent as raw data files 10
by the cooperating research teams and uniformly processed with the flux processing software at the University of Bayreuth (TK2, Mauder et al., 2007a). At the two sites that provided processed fluxes instead of eddy-covariance raw data for this study, data processing protocols exactly matched that of the TK2, ensuring a uniform data pro-cessing for the entire study. The average data loss due to gaps in the raw data was 15
9.2% (minimum 0.3%, maximum 37.6%). For the majority of the sites (14), the data loss due to gaps was below 5%.
24 out of the 25 participating sites provided the land cover maps required to ana-lyze the spatial representativeness of the eddy-covariance fluxes (for CH-Lae, the land cover map was not compatible with the format needed for this analysis). These maps 20
had a mean grid resolution of 40 m (minimum 10 m, maximum 150 m) and an averaged number of land cover classes of 10 (minimum 2, maximum 34). See Table 2 for details. The different characteristics of the map material compromise a comparison between the sites, as the quality of the land cover information also influences the accuracy of the footprint analysis, and the various levels of detail may lead to biased conclusions 25
about representativeness. For example, a forest with a large number of small scale heterogeneities such as roads and small clearings would be completely differently de-scribed by a map read out from topographical maps in a resolution of 100 m, or pro-duced based on remote sensing data with a resolution of 15 m. In the former case,
BGD
4, 4025–4066, 2007 QAQC of CarboEurope flux data – footprints M. G ¨ockede et al. Title Page Abstract Introduction Conclusions References Tables Figures ◭ ◮ ◭ ◮ Back CloseFull Screen / Esc
Printer-friendly Version Interactive Discussion
EGU
the implicit majority filter would make most the heterogeneities disappear, resulting in a description of a homogeneous forest, while the remote sensing map is capable to resolve the heterogeneities. On the other hand, a coarse resolution may also enhance the influence of heterogeneities which are just large enough to form the majority of a pixel, and therefore decrease the level of representativeness in the footprint analysis. 5
Consequently, the choice of the map resolution has a significant impact on the footprint analysis, with the direction of the bias dependent on the specific land cover structure. The number of land cover types distinguished might also have a large impact on the footprint analysis, since an area with patches of different forest types might appear as homogeneous forest in a simpler map, and thus vary the target area significantly. 10
3 Site characterization methodology
3.1 Source area analysis
The footprint algorithm applied for this study builds on the Thomson (1987) LS tra-jectory model of Langevin type (e.g. Wilson et al., 1983; Wilson and Sawford, 1996), which is operated forward in time. The exact formulation of the footprint algorithms, the 15
definition of the flow statistics and the effect of stability on the profiles is described in Rannik et al. (2003). For each model run, 5×10⁴particles were released from a height equal to 0.01 times the canopy height. A flux footprint can be derived by integrating their trajectories up to the upwind distance accounting for approximately 90% of the total flux. To enable footprint analyses based on 30-min averaged fluxes over periods 20
of months for a large number of sites, source weight functions were pre-calculated and stored for more than 10 000 different combinations of measurement height, roughness length and atmospheric stability.
Summing up individual 30-min source weight functions for the entire observation pe-riod of a specific site yields the relative influence of each part of the surrounding terrain 25
BGD
4, 4025–4066, 2007 QAQC of CarboEurope flux data – footprints M. G ¨ockede et al. Title Page Abstract Introduction Conclusions References Tables Figures ◭ ◮ ◭ ◮ Back CloseFull Screen / Esc
Printer-friendly Version Interactive Discussion
EGU
these results on a matrix representing the structure of different land cover types in the area surrounding the tower yields the relative contribution of each cover type to the measurements. Finally, maps of flux data quality can be produced by linking the footprint results to data quality flags produced by the scheme of Foken et al. (2004). The quality measures analyzed in this study are the QA/QC flags for momentum flux, 5
sensible heat flux, latent heat flux, CO2flux, and the mean values of the vertical wind
component before and after performing the Planar-Fit rotation (Wilczak et al., 2001). These concepts of linking footprint results with flux data attributes are described in detail in G ¨ockede et al. (2004, 2006).
3.2 Evaluation of land cover composition within the footprint 10
The evaluation of the land cover composition within the footprint of the measurements is a centerpiece of this study. Each of the sites in networks such as CarboEurope-IP has been set up to monitor a specific type of land cover, or a combination of two or more land cover types, respectively. Flux contributions from different land cover types than the specified target introduce a systematic bias to the measurements, altering 15
the “true” signal from the target land cover type and thus increasing the scatter in biome intercomparison studies. Therefore, the source area of the fluxes measured has to be known to evaluate how well the measurements represent the specified target land cover. The approach presented herein determines the overall representativeness of a site with respect to the specified target land cover type, and identifies possible 20
problematic wind sectors or meteorological situations that fail to produce representative data.
For each of the 30-min averaged fluxes of a processed dataset, our approach de-termines the flux contribution of the specified target land cover type, and the results are transferred to a database. Based on this information, individual thresholds for a 25
minimum required flux contribution can be defined for different studies to filter out mea-surements failing to meet that requirement. After intensive pre-analyses, we found the following classification into four groups the most practicable to characterize individual
BGD
4, 4025–4066, 2007 QAQC of CarboEurope flux data – footprints M. G ¨ockede et al. Title Page Abstract Introduction Conclusions References Tables Figures ◭ ◮ ◭ ◮ Back CloseFull Screen / Esc
Printer-friendly Version Interactive Discussion
EGU
30-min measurements and facilitate the overall site evaluation:
– Homogeneous measurements: 95% or more of the flux are emitted by the
spec-ified target land cover type. Systematic bias by flux contributions from other land cover types is negligible. Sites with a high percentage of homogeneous measure-ments reliably represent their specified target land cover type, and are thus ideal 5
for across-biome studies.
– Representative measurements: 80 to 95% of the flux are emitted by the target
land cover type. We chose the 80%-threshold to limit possible disturbing influ-ences of non-target land cover types on the measured fluxes to a low level. At the same time, the threshold is relaxed enough to acknowledge the fact that the vast 10
majority of FLUXNET sites has to deal with heterogeneous land cover structures to a certain degree, and ideal homogeneity in the fetch is very rare.
– Acceptable measurements: 50 to 80% flux contribution are emitted by the target
land cover type. Though still dominant, the fluxes from the target areas are diluted significantly. Use for across-biome studies is not recommended, but may be valid 15
depending on study objectives.
– Disturbed measurements. Less than 50% flux contribution from the target land
cover type. These measurements are dominated by flux contributions which, strictly speaking, should be regarded as disturbances. These data are therefore not valid for across-biome studies.
20
Using the above categories, the sites within a flux network can be grouped according to the usefulness of a footprint filter to assure the representativeness of the measurement data for the specified target land cover type (see Sect. 4.1).
3.3 Spatial structures in the data quality flags
Based on the footprint results, this approach links the quality flags for momentum flux, 25
BGD
4, 4025–4066, 2007 QAQC of CarboEurope flux data – footprints M. G ¨ockede et al. Title Page Abstract Introduction Conclusions References Tables Figures ◭ ◮ ◭ ◮ Back CloseFull Screen / Esc
Printer-friendly Version Interactive Discussion
EGU
terrain. Comparison of spatial structures in the data quality between individual sites is not straightforward, since local terrain characteristics and climate conditions may vary significantly. To facilitate an overall evaluation and allow site intercomparisons, we differentiate between three kinds of spatial effects in the data quality, isolated ef-fects, multidirectional effects and instrumental effects. The abundance of each of those 5
effects can be used for site classification (see Sect. 4.2).
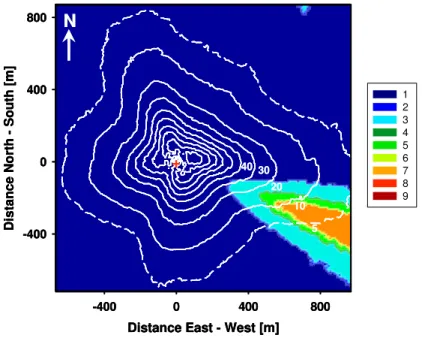
Isolated effects on the data quality consist of a narrow wind sector with reduced data quality in an otherwise high-quality region of the map. Usually, due to the restric-tion to a specific wind direcrestric-tion and stability regime, the total number of lower-quality measurements is rather low, so that they could easily be overlooked if not coupled to 10
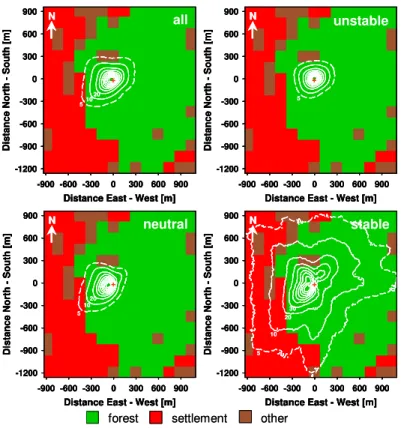
footprint results as done in this approach. A perfect example for an isolated effect in the data quality was found for the Wetzstein site (DE-Wet, Fig. 1). This site received an outstanding overall quality rating for all fluxes, except for a narrow wind sector around 110◦where the quality of all four fluxes analyzed was significantly reduced during
sta-ble to neutral stratification. In this case, the effect can most probably be attributed to 15
flow distortion induced by the instrumentation setup, as it occurs independent of the type of flux. However, since wind direction from this sector is very rare at the Wetzstein site (1.8% for 2002–2006 for 105–115◦
over all stability regimes), this effect does not have a significant impact on the overall site performance.
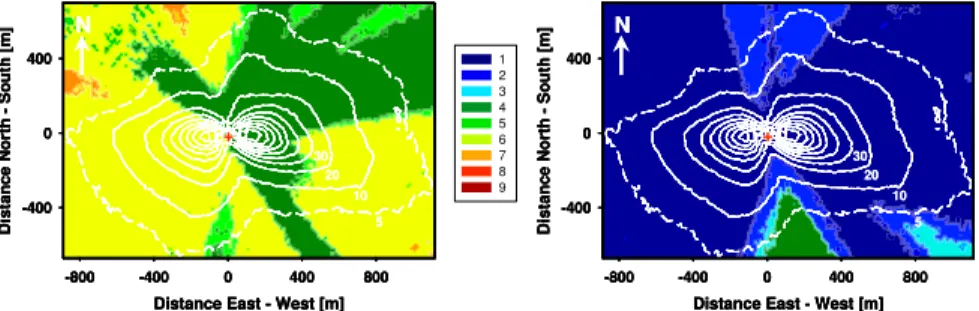
For multidirectional effects, the median data quality is significantly lower than aver-20
age for a specific stability of stratification or flux. In contrast to the isolated effect, a reduced data quality is found for several wind sectors, or is observed independent of the wind direction. Multidirectional effects are in most cases caused by instrumentation effects or regional flow patterns, rather than by the local scale characteristics of the sur-rounding terrain. A very good example for the identification of an multidirectional effect 25
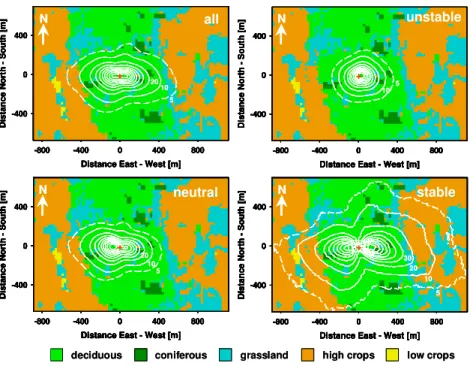
on the data quality was found for the Danish Sorø site (DK-Sor). At Sorø, all fluxes analyzed were of very good overall quality independent of the stability of stratification, except of the latent heat flux during stable stratification (Fig. 2). Since also the CO2flux
BGD
4, 4025–4066, 2007 QAQC of CarboEurope flux data – footprints M. G ¨ockede et al. Title Page Abstract Introduction Conclusions References Tables Figures ◭ ◮ ◭ ◮ Back CloseFull Screen / Esc
Printer-friendly Version Interactive Discussion
EGU
instrumental problems of infra-red gas analyzer (IRGA) or sonic anemometer can be ruled out as a possible cause of the problem. One plausible explanation is that the tub-ing of the closed-path IRGA system affects water vapor transport to the sensor durtub-ing nighttime measurements, altering the quality of the latent heat flux, but not of the CO2 flux. Other multidirectional effects identified in the context of this study were caused 5
by extreme low turbulence intensities during stable stratification which did not pass the test for a well-developed turbulent flow field (FI-Hyy), or by a regional wind climatology with channeled flow that covered certain wind sectors only during transitional periods with non stationary flow conditions (CH-Lae, ES-LMa).
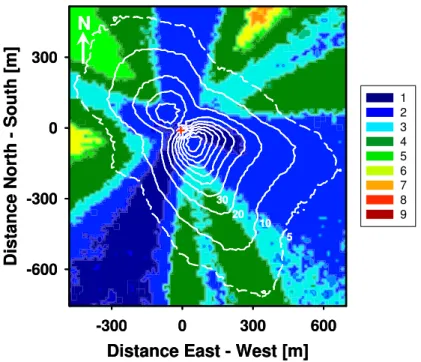
Instrumental effects are identified by obvious spatial structures in the maps of median 10
data quality that can be correlated to the geometry of the installed sensors. In the context of this study, all such effects found were related to the sonic anemometers, while no general data quality effect could be linked to the IRGAs. As an example, Fig. 3 shows the data quality map for the latent heat flux during stable stratification at Sodankyl ¨a (FI-Sod), where a METEK USA1 sonic anemometer is installed. For this 15
site, during stable stratification quality maps for all fluxes were structured into 3 sectors of 120 degrees each, with good data quality in the north, east-southeast and southwest, and a reduced quality in between. These results indicate that there is a flow distortion induced by geometry of the METEK USA1 sensor head, slightly compromising the quality of the measurements.
20
3.4 Evaluation of the Planar-Fit coordinate rotation method
For this study, we applied the Planar-Fit coordinate rotation method (Wilczak et al., 2001) for all sites to adapt the orientation of the measured wind regime to the require-ments of eddy–covariance flux data processing (e.g. a mean vertical wind velocity of zero). Only one set of coordinate rotation angles was applied at each site to avoid 25
systematic errors in long-term mass balances introduced by transient horizontal flux divergences below the sensor height for sensors mounted above tall canopies (Finni-gan et al., 2003). Consequently, in many cases the rotated mean vertical wind velocity
BGD
4, 4025–4066, 2007 QAQC of CarboEurope flux data – footprints M. G ¨ockede et al. Title Page Abstract Introduction Conclusions References Tables Figures ◭ ◮ ◭ ◮ Back CloseFull Screen / Esc
Printer-friendly Version Interactive Discussion
EGU
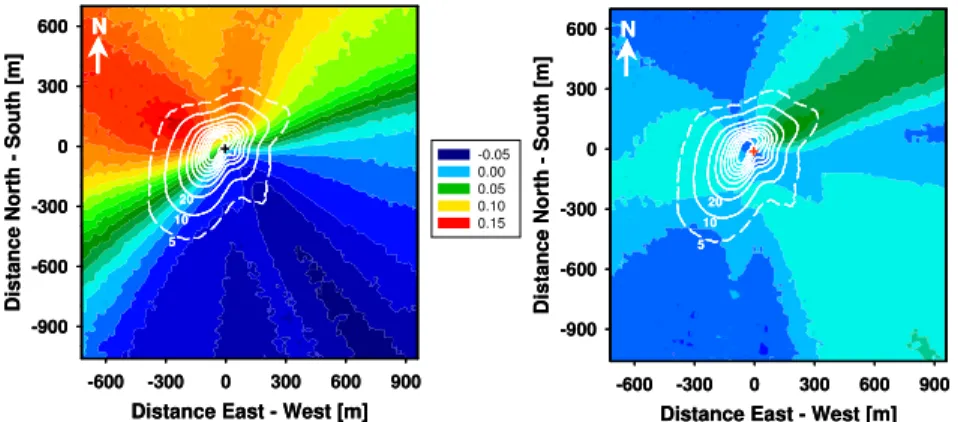
still deviates from the ideal value of zero in some of the wind sectors, because the ver-tical wind field is often curved instead of being an ideal plane. For a detailed analysis of individual sites, maps of the mean vertical wind velocity before and after rotation can be compared to evaluate the performance of the Planar-Fit method. In the exam-ple of the Hesse site (FR-Hes, Fig. 4), the tilted unrotated wind field (maximum mean 5
vertical velocity 0.15 m s−1) was rotated into a balanced plane with absolute residues
below 0.03 m s−1. For site intercomparison, the maximum absolute value of the vertical
wind velocity after rotation can be used to evaluate the performance of the Planar-Fit coordinate rotation method.
4 Results for the CarboEurope-IP network
10
4.1 Representativeness for the specified target land cover
We analyzed the representativeness for the specified land cover type for 24 forested CarboEurope sites. Please note that while the classification of individual 30-min aver-ages follows the scheme proposed in Sect. 3.2, for the overall site evaluation it has to be determined what percentage of the total dataset exceeds one of those thresholds, 15
which can be chosen by the user. Three of those thresholds were tested herein. The vast majority (for most sites all) of the 30-min measurements analyzed in this study were dominated by flux emitted from the specified target land cover type (flux contribution of a 30-min averaged flux>50%). The maximum percentage of measure-ments with target area flux contributions lower than 50% in the dataset for an individual 20
site was 3.3%. However, application of this threshold is not suitable for an overall site evaluation, because with a possible 49% of flux emitted by other sources there is still a significant source of uncertainty that might compromise the representativeness.
Checking for the most rigid quality measure, the test for homogeneous source areas (95% or more of the flux is emitted by the target land cover type), we found that 10 of 25
BGD
4, 4025–4066, 2007 QAQC of CarboEurope flux data – footprints M. G ¨ockede et al. Title Page Abstract Introduction Conclusions References Tables Figures ◭ ◮ ◭ ◮ Back CloseFull Screen / Esc
Printer-friendly Version Interactive Discussion
EGU
These sites, which perfectly represent their specified target land cover type, are FR-Pue (99.9), PT-Mi1 (99.9), CZ-BK1 (99.7%), UK-Gri (99.2%), ES-LMa (96.3%), IT-Col (89.9%), IT-Ren (86.6%), DE-Hai (83.5%), NL-Loo (72.8%), and DE-Wet (56.9%). Values in brackets give the percentage of 30-min measurements with homogeneous source area compositions.
5
The most suitable threshold defined in Sect. 3.2 to perform an overall site evaluation is the percentage of 30-min measurements exceeding the threshold of 80% flux con-tribution from the target land cover type (representative measurements). For a better overview of the results, we grouped the 24 sites into four different categories according to the percentage of representative measurements in the total dataset:
10
– 90% or more of data exceed 80%-threshold: 15 sites (BE-Vie, CZ-BK1, DE-Hai,
DE-Tha, DE-Wet, ES-LMa, FI-Sod, FR-Pue, IL-Yat, IT-Col, IT-Ren, NL-Loo, PT-Esp, PT-Mi1, UK-Gri). These sites represent their specified target land cover type very well. The measurements could be used without additional footprint filters, as the influence of disturbing heterogeneities is very low. Note that the 10 15
‘homogeneous′sites listed above all have 99.9% or more of the 30-min averaged
data exceeding the threshold for representative measurements.
– 60% to 90% of data exceed 80% threshold: 4 sites (DE-Wei, FR-Hes, FR-LBr,
IT-Ro1). For these sites, a footprint analysis is recommended to filter the data which are provided for the CarboEurope-IP database. With a considerable percentage of 20
measurements not truly representative for the target land cover type, an additional footprint flag indicating the flux contribution from the target land cover type will significantly strengthen the data for further use.
– 50% to 60% of data exceed the 80% threshold: 3 sites (FI-Hyy, IT-PT1, IT-SRo).
Most measurements are still representative for the target land cover type, but 25
small scale heterogeneities close to the tower that slightly influence the measure-ments during all stratification cases reduce the flux percentage of the target land cover type. During stable stratification, short fetches in one or several wind
sec-BGD
4, 4025–4066, 2007 QAQC of CarboEurope flux data – footprints M. G ¨ockede et al. Title Page Abstract Introduction Conclusions References Tables Figures ◭ ◮ ◭ ◮ Back CloseFull Screen / Esc
Printer-friendly Version Interactive Discussion
EGU
tors lead to a large influence of non-target land cover types. These datasets need a detailed footprint analysis before uploading into the database.
– Less than 50% of data exceed the 80% threshold: 2 sites (BE-Bra, DK-Sor).
The representativeness of these sites for the specified target land cover types is significantly reduced, due to various reasons. Details on these sites are listed 5
further below.
For Brasschaat (BE-Bra, Fig. 5), the percentage of measurements exceeding the 80% threshold of flux contribution from the target land cover (forest) is only 42.5%. How-ever, the general situation is similar to the three sites listed in the third category above (50–60% of representative data), with a small scale heterogeneity close to the tower, 10
but significant reductions of the representativeness only to be found during stable strat-ification. However, the fetch is extremely short, especially in the main wind direction around the west. Measurements during stable stratification should generally be dis-carded except for easterly winds. Application of a footprint filter based on the results by Rebmann et al. (2005) at this site increased the contribution of the target vegetation 15
to>90% (Nagy et al., 2006). Because stable stratification is predominantly a night-time phenomenon at this site, the footprint filter strongly affected the nightnight-time fluxes (on average more than 10% reduction), while it had virtually no effect on the daytime fluxes.
Two major factors compromise the representativeness of the Sorø (DK-Sor, Fig. 6) 20
data for the target land cover type deciduous forest: First, the deciduous forest is interspersed by a large number of small heterogeneities such as other forest types or grassland patches, and second the fetch is rather short especially in the main wind directions to the east and to the west. Consequently, only 9.3% of all measurements exceed the threshold of 80% flux contribution from the target land use type (however, 25
still 99.3% exceed the threshold of 50%). These results have to be interpreted with care, since the wind climatology within the 21/2month period in summer 2002 used for
BGD
4, 4025–4066, 2007 QAQC of CarboEurope flux data – footprints M. G ¨ockede et al. Title Page Abstract Introduction Conclusions References Tables Figures ◭ ◮ ◭ ◮ Back CloseFull Screen / Esc
Printer-friendly Version Interactive Discussion
EGU
site. In addition, most of the large grassland patches, or clearings, within the forest, have characteristics very close to those of the target land cover type deciduous forest. A more representative wind climatology and inclusion of the clearings into the target area would lead to a significant increase of measurements truly representative for the specified target land cover type. Since the quite detailed land cover map provided for 5
this site may have biased the results, a different treatment of the land cover data may change the representativeness of the flux data significantly. The footprint issue for this site has previously been dealt with by Dellwik and Jensen (2000, 2005).
Sites that have “footprint problems”, i.e. a high percentage of flux contributions emit-ted from outside their defined target land cover type, can however be used without 10
restrictions in applications where the exact source of the fluxes is not important. Stud-ies like that could include for example the analysis of interannual variability analysis, monitoring of disturbances effects, and parameterization and validation of models with a low horizontal resolution compared to the footprint of the measurements.
4.2 Evaluation of spatial structures in flux data quality 15
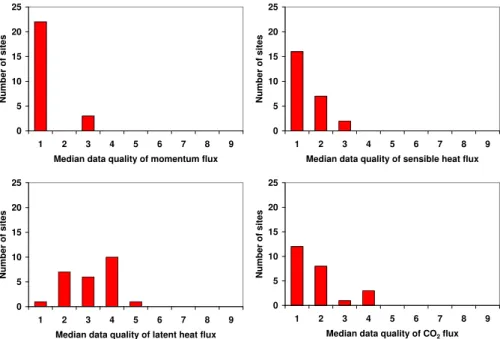
For a general overview of average data qualities assigned by the Foken et al. (2004) approach, Fig. 7 presents the frequency distributions of the median data quality found for the 25 sites involved in this study. The highest overall quality ratings were found for the momentum flux, with medians only in the excellent range between classes 1 and 3. Results for the sensible heat flux are almost as good as those for the momentum flux. 20
However, in this case the quality assessment only considered integral turbulence char-acteristics (ITC) for the horizontal and vertical wind components. For the temperature scalar, the ITC parameterization (Foken et al., 2004) is only valid for unstable stratifi-cation, while during neutral and stable stratification the normalization by the dynamic temperature tends to be zero (see also Rebmann et al., 2005; G ¨ockede et al., 2006). 25
For most sites, the latent heat flux is assigned a worse data quality than the CO2flux,
even though the scalar concentration fluctuations for both parameters are measured with the same IRGA instrument. For the latent heat flux, eleven sites have a median
BGD
4, 4025–4066, 2007 QAQC of CarboEurope flux data – footprints M. G ¨ockede et al. Title Page Abstract Introduction Conclusions References Tables Figures ◭ ◮ ◭ ◮ Back CloseFull Screen / Esc
Printer-friendly Version Interactive Discussion
EGU
data quality flag below or equal to 4, while for the CO2flux only three sites are within this range. Due to software related problems, the CO2 flux for the site ES-LMa could
not be evaluated in the context of this study, so only 24 sites are considered for the distributions of median data quality for CO2in Fig. 7.
The momentum flux is the parameter analyzed in the context of this study which 5
shows the highest overall quality ratings. For most of the spatial maps of the averaged data quality, the quality ratings were in the excellent range between classes 1 and 3, indicating no significant disturbance effects on the measurements. For all 25 sites included in this survey, no significant reduction of the data quality was observed during unstable and neutral stratification, meaning for none of the sectors the average quality 10
was below class 6. We found isolated effects during stable stratification for three of the sites (DE-Wet, FI-Sod, PT-Mi1), and multidirectional reduction of overall data quality during stable stratification for three more sites (ES-LMa, FI-Hyy, FR-Pue).
The number of sites with a reduced data quality identified for the sensible heat flux is much higher than for the momentum flux, mainly due to a failed stationarity test for the 15
temperature measurements. For 13 sites (BE-Bra, DE-Hai, DE-Wet, ES-LMa, FR-Hes, FR-LBr, FR-Pue, IT-Ren, IT-Ro1, IT-SRo, NL-Loo, PT-Mi1, UK-Gri), isolated effects were observed that occurred during one or two stability regimes. These isolated effects are distributed over all stability regimes for the whole CarboEurope network, indicating that they are likely to be caused by individual terrain effects specific to each of the 20
measurement sites, instead of systematic errors such as induced by the measurement setup, the flux processing or the quality flag assignment. Obviously, the data quality of the sensible heat flux is especially sensitive to heat sources in the surrounding terrain that significantly deviate in their source strength from their environment. Three more sites experienced a multidirectional reduction of the sensible heat flux data quality, two 25
of those during stable stratification (FI-Hyy, IT-Col), and one (CH-Lae) during neutral stratification.
For the latent heat flux, we found the worst overall quality ratings of the parameters analyzed in this study, with the overall data quality often only moderate (classes 3
BGD
4, 4025–4066, 2007 QAQC of CarboEurope flux data – footprints M. G ¨ockede et al. Title Page Abstract Introduction Conclusions References Tables Figures ◭ ◮ ◭ ◮ Back CloseFull Screen / Esc
Printer-friendly Version Interactive Discussion
EGU
to 6) even when no significant disturbance effects were found. For four sites, isolated disturbances were observed (DE-Wet, ES-LMa, FI-Sod, IT-SRo), most of those (except IT-SRo) restricted to a single stability class. We identified multidirectionally reduced data qualities for one or more stratification regimes at 11 sites (CH-Lae, CZ-BK1, DK-Sor, FI-Hyy, FR-LBr, FR-Pue, IT-Col, IT-Ren, IT-Ro1, PT-Mi1, UK-Gri). For two of these 5
sites, the data quality was significantly reduced for all stratification regimes: CH-Lae, which is situated on a mountain slope, and UK-Gri for which wintertime data were analyzed. For most of the remaining sites, the disturbances of the measurements are restricted to stable stratification. This finding suggests that reduced data quality of the latent heat flux can be attributed to a large extent to measurement problems such as 10
water in the tubing systems of closed-path IRGAs, or open-path analyzers with liquid precipitating on the windows of the measurement path during rain or fog events, while terrain effects only play a minor role. A reduction of tubing length and regular cleaning of the tubing can help to improve the quality for closed-path systems.
The overall data quality of the CO2flux was often found to be significantly better than
15
for the latent heat flux, although both are measured with the same set of sensors. For most of the sites, data were rated good to very good (classes 1 to 3), with no significant quality reduction found in the maps. For five sites (DE-Wet, FR-Hes, FR-LBr, IT-SRo, UK-Gri), isolated effects were detected that reduced the data quality in one or two stratification regimes. Multidirectional problems were found at three sites (CH-Lae, FI-20
Hyy, PT-Mi1). Possible explanations for the reduced data quality in these cases include steep topography and channeled flow (CH-Lae) or high frequency of occurrence of low turbulence intensities (FI-Hyy). As for the sensible heat flux, data quality of the CO2 flux seems to be influenced mostly by characteristics of the surrounding terrain with a limited spatial extent, while sensor problems play a minor role.
25
Instrumental effects on the spatial structures of data quality were only observed for the two sites that used METEK USA1 sonic anemometers, FI-Sod and IT-Ro1 (all other sites installed Gill instruments: 9x Gill R2, 10x Gill R3, 4x Gill HS). In the case of FI-Sod, all quality maps were clearly structured into 3 sectors with 120 degrees each
BGD
4, 4025–4066, 2007 QAQC of CarboEurope flux data – footprints M. G ¨ockede et al. Title Page Abstract Introduction Conclusions References Tables Figures ◭ ◮ ◭ ◮ Back CloseFull Screen / Esc
Printer-friendly Version Interactive Discussion
EGU
during stable stratification (see Fig. 1 for details), with a stronger distinction between the sectors for latent heat flux and CO2flux than for momentum flux and sensible heat flux. At the IT-Ro1 site, the influence of the sonic structures could clearly be observed in the spatial structures of the averaged vertical wind component after applying the Planar-Fit coordinate rotation method. Again, areas with positive or negative, respectively, 5
residues of the mean vertical wind velocity were arranged in sectors of 120 degrees. Both results indicate that the geometry of the METEK USA1 sensor head influences the wind field, which may have an effect on the data quality under certain conditions. The problem may be caused by an ineffective head correction (Mauder et al., 2007b).
To facilitate a site intercomparison and overall network evaluation, the results for the 10
four different fluxes and the instrumental effects listed above can be integrated into four major categories (Table 3).
4.3 Results of the Planar-Fit coordinate rotation method
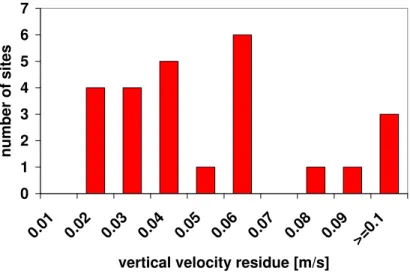
The frequency distribution of the maximum value of the remaining residues after per-forming the rotation is displayed in Fig. 8. The results demonstrate that the application 15
of the Planar-Fit coordinate rotation method was successful in the vast majority of the cases in the context of this study. For 20 of the 25 sites, the maximum of the residue of the mean vertical wind velocity did not exceed the threshold of 0.06 m/s. As for most of those cases the area with the maximum residue was restricted to a very small part of the terrain covered by the accumulated source weight function, the total effect of these 20
deviations from the ideal value of zero should be insignificant for the flux processing. For three of the sites analyzed, Planar-Fit could not provide a rotated flow field with residues low enough to be considered insignificant (vertical velocity residue >=0.10 m s−1, CH-Lae, FR-LBr, IT-Ren), and two more sites (DE-Tha, PT-Mi1) were
close to that threshold. In all cases, the distortion of the streamlines of the averaged 25
flow cannot be removed with a single set of coordinate angles. For two of those sites (CH-Lae, IT-Ren), this is a consequence of complex mountainous terrain, and also for DE-Tha the curved streamlines in a narrow wind sector to the east of the tower can
BGD
4, 4025–4066, 2007 QAQC of CarboEurope flux data – footprints M. G ¨ockede et al. Title Page Abstract Introduction Conclusions References Tables Figures ◭ ◮ ◭ ◮ Back CloseFull Screen / Esc
Printer-friendly Version Interactive Discussion
EGU
be attributed to the hilly topography. For FR-LBr, the distorted streamlines are caused by steep gradients in surface roughness due to a significant step change in vegetation height such as a forest edge close to the tower position. In the case of the PT-Mi1 site which is situated in rather open savanna forest, possible explanations include a distortion of the wind field by individual trees close to the tower, or a flow distortion by 5
the inlet tube of the IRGA system which partly obstructs the sonic anemometer in the disturbed wind sectors.
5 Discussion
Interpretation of the results has to consider that G ¨ockede et al. (2006) developed their site evaluation approach as a practical and easy-to-use tool that allows to conduct 10
extensive network studies as presented in this study. With an average of close to 4000 Lagrangian Stochastic footprints to be calculated for each of the 25 participating sites, generalizations like the use of pre-calculated source weight functions had to be adopted to reduce processing time. Consequently, adapting the flow statistics for the footprint computation to specific characteristics of the individual sites was not possi-15
ble in the context of this study. Since any footprint model can only be as good as the description of the underlying turbulent flow conditions, this simplification introduces ad-ditional scatter into the results (e.g. G ¨ockede et al., 2007). The performance of footprint models is further compromised by complex topographical conditions and step changes in surface properties (e.g. Schmid and Oke, 1988; Klaassen et al., 2002; Leclerc et 20
al., 2003; Foken and Leclerc, 2004), which alter the atmospheric flow conditions. Con-sequently, the applied method may introduce additional uncertainty especially at sites with fine scale heterogeneities in land cover structure, and frequent transitions from e.g. arable land to tall forest. Overall, the uncertainty introduced by the footprint mod-eling basically affects quantitative results like the percentage flux contributions from 25
different types of land cover. Effects of footprint uncertainty on the predicted flux con-tributions depend on the relative position of heterogeneities to the tower location and
BGD
4, 4025–4066, 2007 QAQC of CarboEurope flux data – footprints M. G ¨ockede et al. Title Page Abstract Introduction Conclusions References Tables Figures ◭ ◮ ◭ ◮ Back CloseFull Screen / Esc
Printer-friendly Version Interactive Discussion
EGU
on the local wind climatology, so that it is not possible to provide a general error es-timate. However, since particles were released close to the ground in the setup of the Lagrangian stochastic footprint model, the modeled source areas are conservative estimates, i.e. they tend to overestimate the fetch rather than underestimate. Since for most sites the fraction of the target land cover decreases with increasing fetch dis-5
tance, this implies that also the results for target area representativeness tend to be conservative. Effects on qualitative findings are expected to be insignificant, since the spatial maps of data quality are mainly determined by the Foken et al. (2004) quality flags for fluxes and the meteorological boundary conditions. See G ¨ockede et al. (2006) for a more detailed discussion.
10
Even though this study invested a lot of effort to assure a uniform processing of the eddy-covariance raw data of each participating site, still a site intercomparison is compromised by differences in the provided data material. We decided to rely on the experience of the cooperating research groups to pick a data set that best represents the local conditions and avoid large data gaps and/or periods with sensor malfunctions. 15
Consequently, the provided datasets vary in length and season covered. All data were considered for this study to optimize the results for each individual site, but for site in-tercomparison the increased representativeness of results based on a larger dataset or the higher abundance of stable stratification cases with lower data quality during wintertime have to be considered. Also, interpretation of data quality maps such as 20
e.g. shown in Fig. 2 must take into account that weighting according to the wind clima-tology is considered only for the accumulated source weight function (white lines), but not for the colored background indicating the median data quality. This implies that a sector with reduced data quality may vary in significance for the overall site evaluation, depending on whether it falls within the main wind direction or within a less frequented 25
wind sector.
This study did not apply any kind of data filtering like use of a friction velocity thresh-old (u∗filter) to exclude situations with low turbulence intensities at nighttime, as is the normal procedure for the selection of data uploaded to the CarboEurope-IP database.
BGD
4, 4025–4066, 2007 QAQC of CarboEurope flux data – footprints M. G ¨ockede et al. Title Page Abstract Introduction Conclusions References Tables Figures ◭ ◮ ◭ ◮ Back CloseFull Screen / Esc
Printer-friendly Version Interactive Discussion
EGU
Therefore, results presented herein may vary for the individual sites if the analysis was only based on submitted data, depending on the amount of data excluded byu∗ fil-tering. Since low data qualities are usually correlated with low turbulence intensities, application of au∗-filter when uploading the data into the database has the potential to solve many of the data quality problems during stable stratification that are identified 5
by the approach presented herein. However, for 17 out of the 25 sites analyzed here, the fraction of data flagged “bad” (flags in the range 7 to 9) was reduced by only 30 percent or less after application of au∗-filter with a threshold as recommended by the CarboEurope database. For these sites, application of au∗-filter would have no or very limited impact on the findings presented. Significantly better results in the maps show-10
ing spatial effects on average data quality would probably be obtained for 2 sites within this list, FI-Hyy and FR-Pue, where the fraction of bad data was reduced by more than 70 percent after application of theu∗-filter.
The quality of the map describing the land cover structure may introduce significant bias into the analysis of land cover type representativeness, depending on the charac-15
teristics of the surrounding terrain (see also Sect. 2). For the PT-Mi1 site, we ran two site analyses to highlight this aspect: The original model run was based on the land cover map with a horizontal resolution of 100 m, which had been read out manually from topographical maps. The updated site analysis (Siebicke, 2007) used a map with 10 m resolution, which had been produced based on an intensive on-site vegetation survey 20
and aerial photographs. Comparison of the maps demonstrated that, in a landscape characterized by small scale heterogeneities, a coarse resolution may significantly dis-tort the coverage relationships between land cover types by the implicit majority filter, e.g. turning a small creek into a 100 m wide stream. In addition, the more realistic rep-resentation of the landscape in the high resolution map may also influence the choice 25
of the target land cover type. In the case of PT-Mi1, the 10 m resolution map showed a large number of individual trees and tree groups interspersed by grass-covered areas (open savanna, or Montado), while the coarser map suggested patches of closed for-est and large clearings. Regarding the Montado as the “true” target area, and use of
BGD
4, 4025–4066, 2007 QAQC of CarboEurope flux data – footprints M. G ¨ockede et al. Title Page Abstract Introduction Conclusions References Tables Figures ◭ ◮ ◭ ◮ Back CloseFull Screen / Esc
Printer-friendly Version Interactive Discussion
EGU
the updated land cover map, raised the average flux contribution from the target area from 71% to 99%, and consequently altered the overall site evaluation from “serious fetch problems” to “perfect fetch conditions”. This example emphasizes that choice of the target area and quality of the underlying vegetation map have significant influence on the results presented by the footprint-based quality evaluation procedure presented 5
herein, which has to be considered especially for site intercomparisons. Moreover, the approach presented only distinguishes between target area and other land cover types when assessing the representativeness of the measurements, without taking into ac-count ecophysiological differences between the different land cover types. In practice, however, it will play a role if e.g. measurements intended to monitor mature forest are 10
influenced to a certain degree by a neighboring lake or by an adjacent patch of younger forest, but the interpretation of the impact of such differences on fluxes at the individual sites is beyond the scope of this study.
Due to the sources for scatter or systematic bias listed above, the results presented herein should not be used to rank the sites of the network, or label them as suit-15
able or unsuitable for providing valuable data for CarboEurope-IP. This study focuses on quality aspects of micrometeorological measurements, while ecological importance and available infrastructure also play a major role for site selection in a network. At sites receiving a low quality rating in one or more of the categories tested, the specific situations when data quality is significantly reduced should be closely examined, as 20
e.g. performed by Nagy et al. (2006) at the BE-Bra site. Our findings highlight effects reducing data quality at individual sites as well as network-wide patterns, distinguishing between sensor related quality reductions that can be improved for and effects induced by characteristics of the surrounding terrain that have to be flagged and filtered out in the database.
25
Results computed with the footprint based quality assessment approach presented herein could be used to establish a network wide quality flagging procedure for eddy-covariance measurements that is consistent for all sites. Uniform QA/QC flags based on objective and transparent criteria would significantly improve database reliability for
BGD
4, 4025–4066, 2007 QAQC of CarboEurope flux data – footprints M. G ¨ockede et al. Title Page Abstract Introduction Conclusions References Tables Figures ◭ ◮ ◭ ◮ Back CloseFull Screen / Esc
Printer-friendly Version Interactive Discussion
EGU
a growing user community, as they allow filtering the data by criteria like momentum flux data quality or the percentage flux contribution of the specified target land cover type. Since establishment of a uniform flagging procedure is complicated due to the use of a variety of flux processing software tools in the CarboEurope-IP network, this approach could provide an alternative in the form of lookup tables which would be part of the post-5
processing once data got uploaded into the database. To obtain lookup tables as such, the results obtained with the approach presented would have to be binned into classes of e.g. wind direction and stability of stratification, with the number and definition of the binning parameters as well as their class definitions open to the database manager. For each combination of classes, an averaged flux contribution of the target area and a 10
list of parameters describing expected flux data quality (e.g. median flag, or percentage of low quality measurements) can be computed. Linking those tables to the database would allow assigning additional information on data quality to each individual 30min averaged flux, allowing for users to assure the data meet the requirements for their specific studies.
15
6 Summary
This study applied the site evaluation approach by G ¨ockede et al. (2006), which com-bines Lagrangian Stochastic footprint modelling with a quality assessment approach for eddy-covariance data (Foken et al., 2004) to 25 forested sites of the CarboEurope-IP network. The analysis focused on the representativeness of the datasets for the 20
specified target land cover type, spatial patterns in the data quality of momentum flux, sensible and latent heat flux and CO2flux, the performance of the Planar-Fit coordinate
rotation method (Wilczak et al., 2001), and instrumentation effects on data quality. We did not find systematic differences in overall data quality depending on the three different types of infrared gas analyzers and four different types of sonic anemome-25
ter installed at the analyzed sites, but METEK USA1 anemometers seem to introduce spatial patterns in the data quality due to the geometry of the sensor, which may be
BGD
4, 4025–4066, 2007 QAQC of CarboEurope flux data – footprints M. G ¨ockede et al. Title Page Abstract Introduction Conclusions References Tables Figures ◭ ◮ ◭ ◮ Back CloseFull Screen / Esc
Printer-friendly Version Interactive Discussion
EGU
attributed to an ineffective head correction. Although most of the sites represented their specified target land cover type very well, ten of the 25 analyzed sites (40%) are situated in almost homogeneous terrain, while for two sites measurements are signifi-cantly compromised by a heterogeneous land cover structure. A footprint filter is rec-ommended as additional information in the CarboEurope-IP database to indicate level 5
of representativeness of each stored flux measurement. 12 of the 25 sites (48%, Ta-ble 2) experienced a significant reduction in eddy-covariance data quality under certain conditions, mostly constricted to a small wind sector and a specific flux and/or atmo-spheric stability. Data quality was highest for momentum flux and CO2flux. Our results
indicate that the quality of the sensible heat flux was reduced mostly by terrain effects, 10
such as small-scale heat sources that deviate significantly from their environment in terms of source strength, while instrumentation effects did not seem to be important for this parameter. For the latent heat flux, on the other hand, data quality reductions occurred due to general instrumentation-related problem instead of effects induced by the characteristics of the surrounding terrain. The Planar-Fit coordinate rotation could 15
be applied successfully at 20 sites, while for the remaining five sites complex mountain-ous terrain or significant changes in vegetation height induced a distortion of the flow field that could not be corrected for. For those sites, the use of a coordinate rotation for each averaging interval may be a more appropriate method to adapt the wind field for eddy-covariance data processing.
20
Overall, our quality evaluation results for the CarboEurope-IP network demonstrated a high average data quality, and good representativeness of the measurement data for the specified target land cover types. The study demonstrates that the site eval-uation approach by G ¨ockede et al. (2006), or application of footprint approaches in general, provides a valuable tool to identify measurement problems connected to ter-25
rain characteristics and instrumental setup that reduce data quality. The reliability of eddy-covariance databases for the user community can be significantly strengthened by using these results as part of the database, allowing to filter out and to flag data that do not meet the required standards.
BGD
4, 4025–4066, 2007 QAQC of CarboEurope flux data – footprints M. G ¨ockede et al. Title Page Abstract Introduction Conclusions References Tables Figures ◭ ◮ ◭ ◮ Back CloseFull Screen / Esc
Printer-friendly Version Interactive Discussion
EGU
Acknowledgements. This study was embedded within the framework of the European Union funded projects CARBOEUROFLUX and CARBOEUROPE-IP. Further support came from the Office of Science (BER), U.S. Department of Energy, Grant No. DE-FG02-04ER63911 (Ameri-Flux Measurement Network: Science Team Research).
References
5
Amiro, B. D.: Footprint climatologies for evapotranspiration in a boreal catchment, Agr. Forest Meteorol., 90, 195–201, 1998.
Aubinet, M., Grelle, A., Ibrom, A., Rannik, ¨U., Moncrieff, J., Foken, T., Kowalski, A. S., Martin, P. H., Berbigier, P., Bernhofer, C., Clement, R., Elbers, J., Granier, A., Gr ¨unwald, T., Morgen-stern, K., Pilegaard, K., Rebmann, C., Snijders, W., Valentini, R., and Vesala, T.: Estimates
10
of the annual net carbon and water exchange of forests: The EUROFLUX methodology, Adv. Ecol. Res., 30, 113–175, 2000.
Baldocchi, D., Falge, E., Gu, L. H., Olson, R., Hollinger, D., Running, S., Anthoni, P., Bernhofer, C., Davis, K., Evans, R., Fuentes, J., Goldstein, A., Katul, G., Law, B., Lee, X. H., Malhi, Y., Meyers, T., Munger, W., Oechel, W., Paw U, K. T., Pilegaard, K., Schmid, H. P., Valentini,
15
R., Verma, S., Vesala, T., Wilson, K., and Wofsy, S.: FLUXNET: A new tool to study the temporal and spatial variability of ecosystem-scale carbon dioxide, water vapor, and energy flux densities, B. Am. Meteorol. Soc., 82, 2415–2434, 2001.
Baldocchi, D. D., Finnigan, J. J., Wilson, K., Paw, U. K. T., and Falge, E.: On measuring net ecosystem carbon exchange over tall vegetation on complex terrain, Bound.-Lay. Meteorol.,
20
96, 257–291, 2000.
Ciais, P., Reichstein, M., Viovy, N., Granier, A., Ogee, J., Allard, V., Aubinet, M., Buchmann, N., Bernhofer, C., Carrara, A., Chevallier, F., De Noblet, N., Friend, A. D., Friedlingstein, P., Gr ¨unwald, T., Heinesch, B., Keronen, P., Knohl, A., Krinner, G., Loustau, D., Manca, G., Matteucci, G., Miglietta, F., Ourcival, J. M., Papale, D., Pilegaard, K., Rambal, S., Seufert,
25
G., Soussana, J. F., Sanz, M. J., Schulze, E. D., Vesala, T., and Valentini, R.: Europe-wide reduction in primary productivity caused by the heat and drought in 2003, Nature, 437, 529– 533, 2005.
Dellwik, E. and Jensen, N. O.: Internal equilibrium layer growth over forest, Theor. Appl. Clima-tol., 66, 173–184, 2000.
BGD
4, 4025–4066, 2007 QAQC of CarboEurope flux data – footprints M. G ¨ockede et al. Title Page Abstract Introduction Conclusions References Tables Figures ◭ ◮ ◭ ◮ Back CloseFull Screen / Esc
Printer-friendly Version Interactive Discussion
EGU Dellwik, E. and Jensen, N. O.: Flux-profile relationships over a fetch limited beech forest,
Bound.-Lay. Meteorol., 115, 179–204, 2005.
Finnigan, J. J., Clement, R., Malhi, Y., Leuning, R., and Cleugh, H. A.: A re-evaluation of long-term flux measurement techniques – part I: Averaging and coordinate rotation, Bound.-Lay. Meteorol., 107, 1–48, 2003.
5
Foken, T. and Wichura, B.: Tools for quality assessment of surface-based flux measurements, Agr. Forest Meteorol., 78, 83–105, 1996.
Foken, T., G ¨ockede, M., Mauder, M., Mahrt, L., Amiro, B. D., and Munger, J. W.: Post-field data quality control, in: Handbook of Micrometeorology: A guide for surface flux measurements, edited by: Lee, X., Massman, W. J., and Law, B. E., Kluwer Academic Publishers, Dordrecht,
10
181–208, 2004.
Foken, T. and Leclerc, M. Y.: Methods and limitations in validation of footprint models, Agr. For. Meteorol., 127, 223–234, 2004.
Foken, T.: Angewandte Meteorologie, Mikrometeorologische Methoden, (2. ¨Uberarb. u. erw. Aufl.), Springer, Berlin, Heidelberg, New York, 326 pp., 2006.
15
Gerbig, C., Lin, J. C., Wofsy, S. C., Daube, B. C., Andrews, A. E., Stephens, B. B., Bakwin, P. S., and Grainger, C. A.: Toward constraining regional-scale fluxes of CO2with atmospheric observations over a continent: 2. Analysis of COBRA data using a receptor-oriented frame-work, J. Geophys. Res.-Atmos., 108, 4757, doi:4710.1029/2003JD003770, 2003.
G ¨ockede, M., Rebmann, C., and Foken, T.: A combination of quality assessment tools for eddy
20
covariance measurements with footprint modelling for the characterisation of complex sites, Agr. For. Meteorol., 127, 175–188, 2004.
G ¨ockede, M., Markkanen, T., Hasager, C. B., and Foken, T.: Update of a footprint-based ap-proach for the characterisation of complex measurement sites, Bound.-Lay. Meteorol., 118, 63–655, 2006.
25
G ¨ockede, M., Thomas, C., Markkanen, T., Mauder, M., Ruppert, J., and Foken, T.: Sensitivity of Lagrangian Stochastic footprints to turbulence statistics, Tellus B, 59, 577–586, 2007. Hasager, C. B. and Jensen, N. O.: Surface-flux aggregation in heterogeneous terrain, Q. J.
Roy. Meteor. Soc., 125, 2075–2102, 1999.
Hibbard, K. A., Law, B. E., Reichstein, M., and Sulzman, J.: An analysis of soil respiration
30
across northern hemisphere temperate ecosystems, Biogeochemistry, 73, 29–70, 2005. Horst, T. W. and Weil, J. C.: How far is far enough – the fetch requirements for
BGD
4, 4025–4066, 2007 QAQC of CarboEurope flux data – footprints M. G ¨ockede et al. Title Page Abstract Introduction Conclusions References Tables Figures ◭ ◮ ◭ ◮ Back CloseFull Screen / Esc
Printer-friendly Version Interactive Discussion
EGU Jegede, O. O., and Foken, T.: A study of the internal boundary layer due to a roughness change
in neutral conditions observed during the linex field campaigns, Theor. Appl. Climatol., 62, 31–41, 1999.
Kaimal, J. C. and Finnigan, J. J.: Atmospheric boundary layer flows: Their structure and mea-surement, Oxford University Press, New York, 289 pp., 1994.
5
Klaassen, W., van Breugel, P. B., Moors, E. J., and Nieveen, J. P.: Increased heat fluxes near a forest edge, Theor. Appl. Climatol., 72, 231–243, 2002.
Kljun, N., Rotach, M. W., and Schmid, H. P.: A three-dimensional backward Lagrangian footprint model for a wide range of boundary-layer stratifications, Bound.-Lay. Meteorol., 103, 205– 226, 2002.
10
Law, B. E., Falge, E., Gu, L., Baldocchi, D. D., Bakwin, P., Berbigier, P., Davis, K., Dolman, A. J., Falk, M., Fuentes, J. D., Goldstein, A., Granier, A., Grelle, A., Hollinger, D., Janssens, I. A., Jarvis, P., Jensen, N. O., Katul, G., Mahli, Y., Matteucci, G., Meyers, T., Monson, R., Munger, W., Oechel, W., Olson, R., Pilegaard, K., Paw U, K. T., Thorgeirsson, H., Valentini, R., Verma, S., Vesala, T., Wilson, K., and Wofsy, S.: Environmental controls over carbon
15
dioxide and water vapor exchange of terrestrial vegetation, Agr. For. Meteorol., 113, 97–120, 2002.
Law, B. E.: Carbon dynamics in response to climate and disturbance: Recent progress from multiscale measurements and modeling in Ameriflux, in: Plant responses to air pollution and global change, edited by: Omasa, K., Nouchi, I., and De Kok, L. J., Springer, Tokyo,
20
205–213, 2005.
Leclerc, M. Y., Shen, S., and Lamb, B.: Observations and large-eddy simulation modeling of footprints in the lower convective boundary layer, J. Geophys. Res., 102, 9323–9334, 1997. Leclerc, M. Y., Karipot, A., Prabha, T., Allwine, G., Lamb, B., and Gholz, H. L.: Impact of
non-local advection on flux footprints over a tall forest canopy: A tracer flux experiment, Agr. For.
25
Meteorol., 115, 19–30, 2003.
Lee, X., Yu, Q., Sun, X., Liu, J., Min, Q., Liu, Y., and Zhang, X.: Micrometeorological fluxes under the influence of regional and local advection: A revisit, Agr. For. Meteorol., 122, 111– 124, 2004.
Liu, H. P., Peters, G., and Foken, T.: New equations for sonic temperature variance and
buoy-30
ancy heat flux with an omnidirectional sonic anemometer, Bound.-Lay. Meteorol., 100, 459– 468, 2001.