A Comparison of Taxonomy Generation Techniques
Using Bibliometric Methods:
Applied to Research Strategy Formulation
by
Steven L. Camifia
S.B., E.E.C.S. M.I.T., 2009
Submitted to the Department of Electrical Engineering and Computer Science
in Partial Fulfillment of the Requirements for the Degree of
Master of Engineering in Electrical Engineering and Computer Science
at the Massachusetts Institute of Technology
July 2010
Copyright 2010 Steven L. Camifia. All rights reserved.
ARCHIVES
MASSACHUSETTS INSTITUTE
OF TECHOLOYN
DEC 16 2010
LIBRARI
ES
The author hereby grants to M.I.T. permission to reproduce and
to distribute publicly paper and electronic copies of this thesis document in whole and in
part in any medium now known or hereafter created.
Author
Defa ent of Electrical Engineering and Computer Science
July 23, 2010
Certified by
1
i bStuart Madnick
John Norris Maguire Professor of Information Technologies and Professor of Engineering Systems, Massachusetts Institute of Technology
1\ I Thesis Co-Supervisor
Certified by L1-I
Wei Lee Woon Assistant Professor, Masdar Institute of Science and Technology Thesis Co-Supervisor
Accepted by
\ U Dr. Christopher J. Terman
A Comparison of Taxonomy Generation Techniques
Using Bibliometric Methods:
Applied To Research Strategy Formulation
by
Steven L. Camifa
Submitted to the
Department of Electrical Engineering and Computer Science
July 23, 2010
In Partial Fulfillment of the Requirements for the Degree of
Master of Engineering in Electrical Engineering and Computer Science
ABSTRACT
This paper investigates the modeling of research landscapes through the automatic
generation of hierarchical structures (taxonomies) comprised of terms related to a given
research field. Several different taxonomy generation algorithms are discussed and
analyzed within this paper, each based on the analysis of a data set of bibliometric
information obtained from a credible online publication database. Taxonomy generation
algorithms considered include the Dijsktra-Jamik-Prim's (DJP) algorithm, Kruskal's
algorithm, Edmond's algorithm, Heymann algorithm, and the Genetic algorithm.
Evaluative experiments are run that attempt to determine which taxonomy generation
algorithm would most likely output a taxonomy that is a valid representation of the
underlying research landscape.
Thesis Co-Supervisor: Stuart Madnick
Title: John Norris Maguire Professor of Information Technologies and Professor of
Engineering Systems, Massachusetts Institute of Technology
Thesis Co-Supervisor: Wei Lee Woon
Table of Contents
CHAPTER 1: Introduction...8
1.1 Motivations...8
1.1.1 Experts and the Decision Making Process...8
1.1.2 R esearch Landscapes... 8
1.1.3 Analysis of Publication Databases...9
1.2 Technology Forecasting Using Data Mining and Semantics ... 9
1.3 Project O bjectives ... 11
1.4 O verview ... 12
CHAPTER 2: Literature Review ... 13
2.1 Technology Forecasting ... 13
2.2 Taxonomy Generation ... 14
2.3 B ibliom etric A nalysis ... 14
CHAPTER 3: Taxonomy Generation Process ... 17
3.1 C hapter O verview ... 17
3.2 Extracting Bibliometric Information ... ... 18
3.2.1 Engineering V illage... 19
3.2 .2 S copus ... 23
3.3 Quantifying Term Similarity ... 25
3.3.1 C osine Sim ilarity... 25
3.3.2 Symmetric Normalized Google Distance Similarity ... 26
3.3.3 Asymmetric Normalized Google Distance Similarity... 27
3.4 Populating the Term Similarity Matrix ... .... 28
3.5 Choosing a Root Node ... 31
3.5.1 Betweenness Centrality ... .... ... 31
3.5.2 C loseness C entrality ... ... ... 32
3.6 Taxonomy Generation Algorithms... ... 33
3.6.1 Dijsktra-Jarnik-Prim Algorithm...33
3.6.2 Kruskal's Algorithm...35
3.6.3 Edm ond's A lgorithm ... ... ... ... 37
3.6.4 The Heymann Algorithm... ... 39
3.6.5 The Genetic Algorithm...43
3.7 Viewing Taxonomies ... 47
3.8 Taxonomy Generation Process Summary...49
CHAPTER 4: Taxonomy Evaluation Methodology ... ... 51
4.2 Taxonomy Evaluation Criteria... 52
4.3 Evaluating the Consistency of Taxonomy Generation Algorithms...54
4.4 Evaluating Individual Taxonomies ... ... ... ... ... 56
4.5 Synthetic Data Generation ... 58
C H A PT E R 5: R esults...61
5 .1 Introduction ... 6 1 5.2 Evaluating the Consistency of Taxonomy Generation Algorithms ... 64
5.2.1 Backend Data Set Consistency ... 64
5.2.2 T erm C onsistency ... 66
5.2.3 Consistency Test Summary ... 67
5.3 Evaluating Individual Taxonomies ... 68
5.3.1 Using the top 100 terms... 69
5.3.2 Using the top 250 terms...70
5.3.3 Using the top 500 terms... 71
5.3.4 Evaluating Individual Taxonomies Analysis ... 72
5.4 Synthetic Data Generation...74
5.4.1 Estimating the Optimal Bibliometric Data Set Size ... 74
5.4.2 Measuring Algorithm Variant Consistency Using Synthetic Data...78
5.5 A nalysis of R esults...79
CHAPTER 6: Conclusion...84
6.1 R ecom m endations ... 84
6.2 Summary of Accomplishments ... 84
6.3 Limitations and Suggestions for Further Research ... 85
R E FE R E N C E S ... 86
A P P E N D IX ... 88
Appendix A: Most Frequently Occurring Terms in Scopus "renewable energy" database ... 88
Appendix B: Masdar Initiative ... ... ... 94
Appendix C: Description of Code...95
Appendix D: The Graphic User Interface ... 98
List of Figures
Figure 1: Technology Forecasting Using Data Mining and Semantics Project Framework...10
Figure 2: Generating a Taxonomy from a Technological Field Landscape ... 11
Figure 3: Home page of Engineering Village ... 20
Figure 4: Typical Search Results page for Engineering Village. ... 21
Figure 5: Detailed Abstract Page for Each Article... 22
Figure 6: Illustration of Undirected Edge... 27
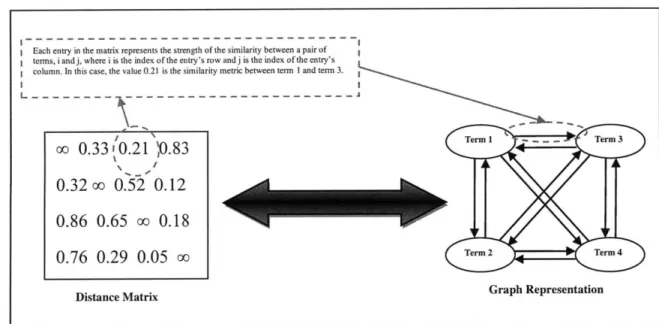
Figure 7: Illustration of Directed Edges ... 28
Figure 8: Representations of a Distance M atrix... 29
Figure 9: Transformation of Graph Representation of Term Similarity Relationships into Final T axonom y ... 3 1 Figure 10: Illustration of DJP Algorithm for Taxonomy Generation...34
Figure 11: Illustration of Kruskal's algorithm for Taxonomy Generation ... 36
Figure 12: Cycle Fixing Process in Edmond's Algorithm...38
Figure 13: Illustration of Edmond's Algorithm for Taxonomy Generation ... 39
Figure 14: Example of a Tag Cloud ... 39
Figure 15: Heymann algorithm pseudocode taken from [Heymann 2006] ... 40
Figure 16: Illustration of the Heymann Algorithm for Taxonomy Generation ... 43
Figure 17: Mutation and Crossover Process in the Genetic Algorithm...45
Figure 18: A cross-section of the visual representation of the 500-term "renewable energy" taxonomy using the Heymann algorithm, cosine similarity, closeness centrality...47
Figure 19: The ZGRViewer Interface ... 48
Figure 20: Diagram of the User Decision Path for Taxonomy Generation ... 50
Figure 21: The underlying model behind the taxonomy generation process ... 52
Figure 22: Simplifying a Larger Taxonomy ... 55
Figure 23: Example of Using Scoring Metrics to Score a Taxonomy... 57
Figure 24: Assigning probability distributions for each of the terms in a taxonomy ... 59
Figure 25: Synthetic Data Generation Process Example ... 60
Figure 26: Visual Representation of HCC-Generated Taxonomy ... ... ... 82
List of Tables
Table 1: List of terms in Scopus "renewable energy" data set that have more than 2,500
occurrences in the data set...6 1
Table 2: List of Taxonomy Generation Variants ... 62
Table 3: Backend Data Set Consistency Test Results ... 65
Table 4: Term Consistency Test Results ... 66
Table 5: Consistency Test Sum m ary... 67
Table 6: Different Scoring Metrics used on Cosine Similarity based Taxonomy Generation A lgorithm V ariants ... 69
Table 7: Different Scoring Metrics used on Symmetric NGD Similarity based Taxonomy G eneration A lgorithm V ariants...69
Table 8: Different Scoring Metrics used on Asymmetric NGD Similarity based Taxonomy Generation A lgorithm Variants... 70
Table 9: Different Scoring Metrics used on Cosine Similarity based Taxonomy Generation A lgorithm V ariants ... 70
Table 10: Different Scoring Metrics used on Symmetric NGD Similarity based Taxonomy Generation Algorithm Variants... 71
Table 11: Different Scoring Metrics used on Asymmetric NGD Similarity based Taxonomy Generation A lgorithm Variants... 71
Table 12: Different Scoring Metrics used on Cosine Similarity based Taxonomy Generation A lgorithm V ariants ... 7 1 Table 13: Different Scoring Metrics used on Symmetric NGD Similarity based Taxonomy G eneration A lgorithm V ariants... ... 72
Table 14: Different Scoring Metrics used on Asymmetric NGD Similarity based Taxonomy G eneration A lgorithm V ariants... ... 72
Table 15: Consistently Top Scoring Algorithm Variants ... 73
Table 16: Accuracy of Taxonomy Generation Algorithms Using Betweenness Centrality's Outputs for Replicating Underlying Synthetically Generated Taxonomies ... ... 75
Table 17: Accuracy of Taxonomy Generation Algorithms Using Closeness Centrality's Outputs for Replicating Underlying Synthetically Generated Taxonomies ... ... ... 76
Table 18: Average of Closeness Centrality Algorithms Accuracy Results ... 77
Table 19: Accuracy of Taxonomy Generation Algorithms for Replicating Underlying Synthetically Generated Taxonomies with 50 Terms with Varying Noise ... 78
CHAPTER 1: Introduction
1.1 Motivations
1.1.1 Experts and the Decision Making Process
Decision making is a cognitive process resulting in the selection of a course of action among several alternatives, usually relying on the opinions of qualified authorities and led by subject-matter experts whose experience and internalized knowledge allow for effective decisions to be made. Experts usually work within a given research field and are deeply immersed in their
subject of expertise. This allows them to give credible advice to researchers. However, in the end, one expert cannot possibly know all the information that exists relating to their field at all times. An expert may not have complete information about a field of technology or research, since the landscape is constantly changing. Everyday, new technologies are invented, outdated research methodologies scrapped, and research strategies altered and improved. It is difficult for an expert to constantly keep track of all of these developments.
Experts are also human, hence decisions made by them will be partially based on their own personal perspectives and unique experiences in the field. As a result, expert advice is still somewhat subjective in nature.
Expert input is extremely valuable to the decision-making process. With this in mind, one issue that motivated the work in this thesis was aiding the decision-making process by helping experts acquire a more complete understanding of their area of expertise.
1.1.2 Research Landscapes
Every research field is composed of a set of interrelated concepts / ideas. For example, within the research field of "renewable energy", there are several interrelated concepts such as "solar power", "hydroelectric power" and "electricity". Going a level deeper, within "solar power", there are also several interrelated concepts such as "photovoltaics" and "thermovoltaic". We collectively refer to the set of interrelated concepts within a given research field as its
research landscape.
In technology-intensive sectors, decision-makers and researchers are always looking for new, better ways to understand their field. A clear understanding of a research landscape will help give their research direction, purpose, and can also help justify its need to investors who, at the end of the day, provide the monetary incentive for continuing research.
A research landscape is not static, but rather changes constantly as new technologies and
concepts emerge, almost on a daily basis. Another issue that motivated the work in this thesis was to accurately generate a robust visualization of a research landscape that provides useful
1.1.3 Analysis of Publication Databases
Text data mining refers to the process of gathering information from text through searching for patterns / trends. Typically, the text to be analyzed is first parsed, structured, and cleaned up, then the output is evaluated using various statistical techniques. Text data mining is frequently applied to publication databases. A publication database refers to an organized set of data composed of documents, articles, and entries gathered from journals, magazines, conference proceedings, blogs, and other publicly released collections. Several publication databases exist, many of which are readily available online. Ever since the Internet became mainstream, the volume of useful information available online has increased exponentially. Online publication databases have been developed to help manage the vast amounts of information, yet even with these it is still hard to decipher which bits of information are worth examining and which are just
a waste of time.
There are several academic online publication databases that specifically review technologically-related journals, such as Compendex and Inspec (collective called Engineering Village), Scirus, Scopus and Web of Science. These databases contain an extraordinary amount of
information for any individual to read, comprehend and process.
Another issue that motivated the work in this thesis was methodologically extracting all the information in these publication databases without the need of manual inspection and presenting the information to end-users in a simple, easily-understandable medium.
1.2 Technology Forecasting Using Data Mining and Semantics
With all these motivations in mind, our team at MIT, in cooperation with a team in the Masdar Institute of Science and Technology (MIST), have been developing an automated method
of helping technologically oriented decision makers make more informed decisions. The idea was to solve the three problems mentioned in the previous section: aiding experts in giving credible
advice, visualizing research landscapes, and sifting through information in publication databases, all with one tool.
MIT and Masdar have been collaborating these past two years on a project that aims to mine science and technology databases for patterns and trends which can facilitate the formation of research strategies [Woon et al. 2009(1)]. Examples of the types of information sources are academic journals, patents, blogs and news articles. The proposed outputs of the project were:
1. A detailed case study of the renewable energy domain, including tentative forecasts of
2. An improved understanding of the underlying research landscape, represented in a suitable form, like a taxonomy
3. Scholarly publications in respected and peer-reviewed journals and conferences relating to the research
4. Software tools to automated the developed techniques.
The high-level aim of the project is to create improved methods for conducting technology
mining using bibliometric techniques. Technology mining refers to the process of gathering
information from publication databases of technological literature. Bibliometrics refers to the statistical analysis of a document without the actual extraction of each document's fulltext.
The basic framework of the entire project is shown in Figure 1.
Figure 1: Technology Forecasting Using Data Mining and Semantics Project Framework Notice that the figure is composed of several distinct blocks. Each block represents a separate phase in the system. Block (a) represents data collection / aggregation and term
extraction. In this phase, bibliometric information is extracted from a publication database and a list of key terms is collected on which the technology forecasting efforts will be focused. Block
(b) represents the identification of early growth technologies. There are two steps to this phase.
The first is to find a suitable measure for the 'prevalence' of a given technology as a function of time, and the second is to locate technologies that, based on this measure, appear to be
Data Collection/ Aggregation Acrtablinsgt Taxonormy G, rowth Gieneration Actionable inisights (b)
technologies in the "early growth" phase of their development. Finally, Block (c) represents the phase where terms are visualized using a predictive taxonomy, described later.
1.3 Project Objectives
The work presented here is a subset of the work described in the previous section. Specifically, the work here focuses on the second goal of the broad project mentioned previously: an improved understanding of the underlying research landscape, represented in a suitable form, like a taxonomy.
The underlying assumption to our work is that a research field can be divided into distinct, yet interrelated terms, which are words / word phrases that embody a specific concept. These terms make up the research landscape, as described earlier. We believe that we can find these terms and determine their relation to each other by parsing the information contained in an online publication database. In the succeeding chapters, we describe a process for automatically gathering key terms related to a technological field from a publication database and organizing these terms into a structure called a taxonomy, which is a hierarchical organization of terms relevant to a particular domain of research, where the growth indicators of terms lower down in the taxonomy contribute to the overall growth potential of higher-up "concepts" or categories. The ordering of the terms in the taxonomy should reflect the inter-relationships between the terms in the context of the research field being examined.
A taxonomy is an acyclic graph where each node has exactly one incoming edge but can
have multiple outgoing edges. For the purposes of research landscape taxonomy generation, each node in the taxonomy is a term / concept in the research field. An example of a taxonomy generated from a hypothetical research landscape of "renewable energy" is shown in Figure 2.
Renwabe Eerg FildRenewable Energy Taxonomy Photovoltaic Renewable Energy FieldCel
Power Solar Power_
Power
Can be
Solar Power transformed
Hydroelectricino. Power Hydroelectric Wind PowerPoe Thermal Plants Photovoltaic Cells
Figure 2: Generating a Taxonomy from a Technological Field Landscape
The box on the right of Figure 2 shows a taxonomy based on the technological field shown in the box on the left. It can be seen that there is only one unique path between each
technological concept / term. We believe that a taxonomy is a very effective representation for visualizing research landscapes because:
1. The unique paths that can be traced between pairs of terms show clear conceptual links
amongst terms.
2. Automatically generated taxonomies reflect the information contained in thousands of published academic papers, reflecting the opinions of many well-respected authors who have published papers in the field.
In this thesis, we evaluated methods based on mathematically-grounded algorithms that utilize the vast amount of information found in scientific and technological academic publication databases to generate a sensible taxonomy representing a research field. Motivated by the issues stated in Chapter 1.1, the overall goals of this thesis are:
1. To develop automated, publication database-independent methods.
2. To compare several taxonomy generation algorithms and evaluate the usefulness of each.
3. To generate ways of visually representing taxonomies in a manner that is easily
understandable for viewers.
4. To run a case study on "renewable energy".
1.4 Overview
The rest is structured as follows:
Chapter 2 will review the academic literature relating to taxonomy generation.
Chapter 3 will go in depth regarding the steps involved in the taxonomy generation process Chapter 4 will discuss the methodology for evaluating taxonomy generation algorithms.
Chapter 5 will present the results of running the analyses described in Chapter 4.
CHAPTER 2: Literature Review
2.1 Technology Forecasting
Technology forecasting is of particular importance to the research presented in this thesis because our work in research landscape visualization facilitates technology forecasting. Many
academics in the field have also investigated problems relating to tech forecasting and have tried to address them. In proof, there is already a significant body of related research on the subject. This rest of this subsection first presents related literature to technology forecasting, then discusses how our work complements the existing body of research.
[Porter 1991] discussed general issues related to forecasting and management, and introduced some basic tools for quantitative technological trend extrapolation. The book
elaborated on the planning, operation, analysis and control of complex technological systems and new technology. The book covers the basics for long term planning, new product development and production, and shows the factors that must come together for new technologies to be developed and new complex products to be produced. Using exhibits, and case studies, [Porter
1991] discusses the methods for dealing with significant issues in managing technological
development.
Another book from the same author, [Porter 2005] focused specifically on the process of technology mining, which is the process of extracting usable information from patents, business information and research publications for the purpose of aiding the management of technology (MOT) process which has thusfar largely been intuition-driven. Technological sources of information are treated as the data that will eventually be "mined" in order to aid the MOT process and generate conclusions about the field of interest. The tech mining analysis described in [Porter 2005] looked at when was the research done, where was it patented, who were the major organizations involved, what were the technological areas of focus, who were the leaders of the companies involved, and what is the current state of the tech industry. It then created matrices showing co-occurrences between these fields in the data, then looked at the change in the data over time to finally generate some conclusions about the technological field.
[Martino 1993] is one of the most widely cited texts in technology forecasting literature. It defined a technological forecast as a prediction of future characteristics of machines,
procedures or techniques. It then presented technological forecasting as an aid to decision-making
by presenting a comprehensive overview of forecasting methods, using numerous real-world
examples and illustrations.
The works presented in this subsection show that technology forecasting as a body of research is indeed promising and a lot of utility can be derived from any tool or methodology that could move this body of research forward. However, in none of the works reviewed and
presented here could we find any attempt to use technology mining methods provide a clear, concrete set of actions for decision-makers and researchers. We believe that this is a critical gap worth investigating and the research in this thesis seeks to address this issue. We know this is a
challenging task, but we believe that one such way to help accomplish this is the visualization of a research landscape, which we do in the form of a taxonomy. The other research featured in this section either simply define tech mining as a research field or present tech mining techniques for managing technological development. None of them actually present any tech mining methods whose outputs can be of immediate actionable impact. For researchers and decision-makers that view the taxonomies we generate, it is immediately clear what concepts they should be focusing on within a given technological field, which we believe could give them insights on what actions to take especially in the early stages of decision-making, where the researchers usually have a lesser understanding of the technological field as a whole.
2.2
Taxonomy Generation
There have been several previous studies on taxonomy creation for various purposes. [Blaschke 2002] proposed a method that automatically generated classifications of gene-product functions using bibliometric information, which is then compared to the well accepted GO ontology. [Krishnapuram 2003] talked about the issues and possibilities concerning automated taxonomy generation. In particular, the paper reviewed several taxonomy generation approaches
and provided insight into the issues involved. [Sanchez 2004] presented a methodology to extract information from the internet and build a taxonomy of terms and web resources for a given domain. [Schwarzkopf et al. 2007] proposed an approach for using data from a social tagging application, like del.icio.us as a basis for user adaptation, then mining taxonomies of tags from tag spaces. The mined taxonomy can then be used to determine how to adapt a system to a user given the user's personal tag space. [Chuang et al. 2002] discussed automatic query clustering, specifically, organizing query terms into a hierarchical structure, producing a query taxonomy.
We believe that the research concept proposed in this thesis is novel because unlike any other study, we use taxonomy generation for the specific purpose of generating output that helps facilitate decision-makers and researchers, which has not been done in any of the works of literature mentioned in the last paragraph. In this thesis, we devise methods for automatically generating solid, reliable taxonomies.
2.3 Bibliometric Analysis
There has been lots of work dealing with bibliometric analysis, presented in this subchapter.
[Kostoff 2000] showcased database tomography, a bibliometric database analysis system that extracts multi-word phrase frequencies and proximities in order to augment analysis from experts in a research field. [Kostoff 2001] then followed up by describing an approach for identifying pathways through which research can impact other research, technology development
/ applications, and technical / infrastructure characteristics of the user population using citation
[Okubo 1997] presented the essential elements of bibliometrics and its application to the analysis of research systems. It started by describing the advent of bibliometrics, continuing with the presentation of the main bibliometric databases that existed back when the paper was written, the bibliometric indicators, and the ways to apply these indicators.
[Small 2006] looked at using co-citation clusters to track the growth and emergence of research areas in science. It defined a research area as a set of documents that define a research topic and an associated group of researchers who share an interest in the topic. Then, it talked about the methodologies of co-citation clustering, mapping, and string formation, and defined a measure of cluster relativity based on the change in average age of highly cited papers.
In addition to the work mentioned above, there have been other works such as [van Raan
1996], [Daim 2006], [Verbeek 2002], and [Narin 1996] relating to bibliometric research.
Moreover, there is some research that talks about the need for standards in bibliometric research [Glanzel 1996], and methods to mine text using keyword distributions [Feldman 1998]. Within this large body of literature however, none of the works deals directly with using bibliometric analysis in order to output something that could be used in technology forecasting and decision-making facilitation, much like how we use bibliometric analysis to output a taxonomy that experts can directly gather information from.
The work in [Ziegler 2009] uses bibliometric analysis intensively and served as the springboard for the work in this thesis. Here, automated methods for bibliometric analysis using information from online publication search engines were developed. The work in [Ziegler 2009] took as input a word or phrase representing a research field, which is called a seed term, and attempted to:
1. Discover related technologies / keywords to the seed term
2. Calculate a numerical value for the growth rate of a certain technology within the research field encapsulated by the seed term, in hopes of flagging fast-growing technologies, which could then be relayed to experts
3. Determine the relationships among technologies within the research field encapsulated by the seed term by grouping them into "concept" clusters
4. Identify new, upcoming technologies within the research field encapsulated by the seed
term
The first stage of [Ziegler 2009]'s analysis is keyword extraction. Given an initial seed
term, online publication databases such as Compendex and Inspec' and Scirus2 were scanned and some/all of the keywords that come up as "related terms" were extracted. Each online publication database presents its information in different ways, and hence unique "wrapper code" was developed for each website. The choice of databases to query is based on two important criteria:
1 Available via www.engineeringvillage.com
first, the database must index a large number of articles related to the technological field of interest, and second, each database must present its results in a consistently formatted way in order to allow keywords to be scraped in an automated fashion.
[Ziegler 2009] also attempted to refine the keywords extracted from the Scirus database
by using back-pointing and eigenvector centrality. The concepts of back-pointing and eigenvector
centrality help in ensuring that the "related terms" produced after a search are actually relevant. Relevance fitting by back-pointing works by imposing a restriction on the terms extracted: they must all "point back" to the original seed term. In other words, after a number of nested searches of listed related keywords, the original seed term must be reached. If this condition is not satisfied, then it is assumed that the term is not really related to the seed term. There are a few variants to the back-pointing algorithm that will not be discussed within this paper. Relevance fitting using eigenvector centrality simply means viewing all the terms in Scirus as a densely connected network, where a link exists between terms that are related to each other. Given this, the eigenvector centrality, which is a measure of importance / connectivity, can be calculated for
each term. The terms that have a lower centrality value are then disregarded.
[Ziegler 20091 then extracted hit counts from each online database, which represents the number of articles related to a seed term for each year. These hit counts are then extracted and
saved, and later used to calculate the growth rates for each of the terms. The growth rates are used to rank the list of terms. Terms with high growth rates and a relatively small number of current hit counts are considered as potentially "high growth" terms that could well be part of mainstream research in the future.
Finally, [Ziegler 2009] used Latent Semantic Analysis (LSA) in order to cluster terms into manageable "concepts". Often, the output of a search produced keywords that were very closely related, such that they could regarded as synonyms. Based on the co-occurrence of terms in documents, the LSA algorithm produces a set of "concepts", each of which is a weighted combination of every term in the field. LSA is based on a well-known and commonly-used technique in linear algebra called Principal Component Analysis. An additional use of LSA is to aid in term cleaning, where terms that do not have a strong weighting within any of the concepts generated by LSA are discarded.
The work in this thesis is largely a continuation of the work in [Ziegler 20091. In [Ziegler
2009], bibliometric analysis and technology mining techniques were used to generate and filter
terms. The work in this thesis takes things a step further. While [Ziegler 2009] stopped at term collection and concept creation, the work presented here takes the terms generated using the technology presented in [Ziegler 2009] and organizes them into a taxonomy, which we believe could be used to aid decision-makers and researchers. The work developed and presented in this thesis both developed taxonomy generation methods and evaluated each taxonomy generation algorithm's usefulness.
CHAPTER 3: Taxonomy Generation Process
The previous two chapters described the goals and aims of this research project. In particular, the chapters discussed the overall goal of the MIT / MIST research group and this thesis which is the automated creation of accurate, reliable taxonomies. However, this goal is still quite broad and hence the specific focus of this thesis is evaluating algorithms used for taxonomy generation. This chapter will explain the entire taxonomy generation process we have developed and present each of the algorithms in detail.
Before the actual taxonomy generation algorithm can be run, each of the taxonomy generation algorithms needs to be given inputs of a specific form, which in turn are based on bibliometric information contained in a publication database. For the purposes of this thesis, we collect the bibliometric information from an online publication database, but in theory the same
information can be collected from one that is not online.
Each taxonomy generated is centered around a particular technological concept,
summarized in a term or phrase or group of phrases called seed terms. The initial choice of initial seed terms is necessarily made by the user. As a case study within this thesis, we used seed terms related to "renewable energy", but these are not the only terms that can be used.
Using bibliometric information collected from online publication databases as a basis, the taxonomy generation algorithms we developed determine which terms to logically link together in the final taxonomy.
The choice of a suitable publications database to gather information from is critical, as each different publication database contains a collection of articles from several different sources,
which may or may not be within the scope of the research area we are investigating. For instance, a database like CHEMnetbase3 that contains articles from journals relating only to "chemistry"4 is not going to be a very good resource when searching for articles related to "renewable energy".
3.1 Chapter Overview
The general procedure for taxonomy generation will be discussed in the succeeding sections. As mentioned previously, the taxonomy generation algorithms we've developed take a certain type of input which is derived from publication databases. As such, this chapter will first discuss how this input is generated before tackling the specifics of each taxonomy generation algorithm.
The steps necessary before the taxonomy generation algorithms can be run are:
3 Available via www.chemnetbase.com
1. Bibliometric information is extracted from an publication database, which in the case of
this thesis is found online, and stored locally for quick processing.
2. From the bibliometric data, a set of terms are chosen amongst the article keywords that are to be included in the taxonomy.
3. A similarity measure is used to compare chosen terms to be included in the taxonomy by
quantifying each pair of terms' relationship strength, collectively represented by a distance matrix.
Once the distance matrix has been generated, taxonomy generation algorithms can be run. In particular the taxonomy generation algorithms that we've developed and will be discussed in the succeeding sections are:
1. Dijsktra-Jarnik-Prim's (DJP) Algorithm
2. Kruskal's Algorithm
3. Edmond's Algorithm
4. Heymann Algorithm
5. The Genetic Algorithm
Finally, the outputted taxonomy must be presented in an aesthetically pleasing manner. As such, the way in which we visualize taxonomies is discussed at the end of the chapter.
3.2 Extracting Bibliometric Information
The first key step in taxonomy generation is the extraction of bibliometric information from publication databases via their respective search interfaces. Bibliometric information refers to the data pertaining to the low level statistical properties of an article, as opposed to the actual contents; note, that the extraction of this information may still require that the text of entire documents be parsed - however, this will only be to extract these statistics and not, for example,
to conduct higher level analyses such as natural language processing. Specifically, the
bibliometric information we analyzed were the 'title', 'abstract', and 'keywords' of an article. To gather information from an online publication search engine, the seed term(s) of choice were first entered into the database's search interface (this can either be done manually, or via some automated procedure or API). Information regarding matching documents was then retrieved, allowing the extraction of the relevant bibliometric information.
While it is unlikely that a single publication database would be able to cover all relevant academic journals, we have found several that we believe cover topics that most closely relate to the research landscape that we are exploring in this project, "renewable energy". While we cannot
be certain if the databases we found are necessarily the best databases for our specific purpose, we know that these databases are very highly regarded, cover a wide scope of topics relating to technology, and are readily available without additional cost within MIT / MIST.
3.2.1 Engineering Village
In MIT, the database of choice is Engineering Village5. Engineering Village is a
combination of three online databases: Compendex, Inspec and NTIS. Compedex and Inspec are both significantly larger in scope compared to NTIS (National Technical Information Service). The latter is a database of government reports and information covering several product
categories ranging from administration/management to earth sciences. Because of NTIS's limited scope compared to Compendex and Inspec, we focused our data gathering efforts on Compendex and Inspec. Compendex and Inspec cover publications from 1884 up to the present and are available free of charge to members of the MIT community, allowing our research group to query the online publication database as often as we wanted without any overhead.
Compendex is a comprehensive bibliographic database of scientific and technical engineering research, covering all engineering disciplines. It includes millions of bibliographic citations and abstracts from thousands of engineering journals and conference proceedings. Compendex covers well over 120 years of core engineering literature. Specifically, Compendex includes over 5 million summaries of journal articles and conference proceedings and 220,000 new additions every year. Over 5,000 engineering journals and conferences are indexed and the database is updated weekly. Coverage of Compendex includes: Mechanical Engineering, Civil Engineering, Electrical Engineering and Electronics, Chemical Engineering and Aeronautical Engineering. Compendex is produced by Elsevier Engineering Information Inc.
Inspec includes bibliographic citations and indexed abstracts from publications in the fields of physics, electrical and electronic engineering, communications, computer science, control engineering, information technology, manufacturing and mechanical engineering, operations research, material science, oceanography, engineering mathematics, nuclear engineering, environmental science, geophysics, nanotechnology, biomedical technology and biophysics. Inspec contains over eight million bibliographic records taken from 3,000 scientific and technical journals and 2,000 conference proceedings. Over 400,000 new records are added to the database annually. Online coverage is from 1969 to the present, and records are updated weekly. Inspec is produced by the Institution of Engineering and Technology (IET).
Compendex and Inspec are similar in a few ways. First, although they mostly cover a different set of topics, they do have around a 20% overlap of journals between them. Also, since they are both contained in the Engineering Village website, they both display "controlled terms" and "uncontrolled terms" for each article. "Controlled terms" come from the controlled
vocabulary found in the El Thesaurus, which is used to index records in Compendex. El refers to 5 Available via www.engineeringvillage.com
6
Engineering Information, which is a business unit of Elsevier , which is one of the leaders in providing online information, knowledge and support to engineering researchers. The 4h edition
of the El Thesaurus contains 18,000 terms and EI's controlled vocabulary is a list of subject terms used to describe the content of a document in the most specific and consistent way possible. "Uncontrolled terms" are author imposed keywords for the article. The number of "controlled terms" and "uncontrolled terms" for each article ranges, but typically each article has around 5
controlled terms and anywhere between 5 to 20 uncontrolled terms.
Collecting Terms from Engineering Village
Given an initial seed term, Engineering Village is queried via its online interface and the bibliometric information of all the articles produced in the search results is stored in a locally stored database file.
The initial page in Engineering Village is shown in Figure 3. To query the database, the search term is typed into the designated text box enclosed in double quotes to ensure that the seed term is treated as a single phrase rather than a set of disjoint words. For example, we would type in ["renewable energy"] as opposed to [renewable energy]. The correct checkbox is also selected to indicate which database among Compendex, Inspec will be used.
E
Engineering VillageCCEneBSE Use humalion )
lms stanard comput*retums
Scirus
Le! ei New use wildcard . .. . .(?) to
i
Figure 3: Home page of Engineering Village
After the search is run, the results appear in a new browser page similar to the one shown in Figure 4.
6 Elsevier provides information research tools specifically focused on the content and intelligence that engineering researchers need to stay informed and step ahead of the competition. Elsevier is a world-leading publisher of scientific, technical and medical information products and services. Working in partnership with the global science and health communities, Elsevier's 7,000 employees in over 70 offices worldwide publish more than 2,000 journals and 2,200 new books per year, in addition to offering a suite of innovative electronic products, such as ScienceDirect, MD Consult, Scopus, bibliographic databases, and online reference works. (taken from http://www.elseyier.con/wps/find/intro.cwshome/ataglance)
WOm nfrV-s
Terms -arButom3a rnanagemeit ret
o search for words that begin with the same letters. computer, computers, computerice, coamputerization
o teued to replace any number Gf charadtef5 intemnall*.
replace a single character. WI-Man of woman
fic3ly stemmied, except in the author field. Unless the 'Aurtostemmg of"' feature is chaeke
0 Engineering Village* ***
Sema nrae - se Rcin rag l Ca l none- oal eeri
Choeot- Car Abst3 Detaserco 4cle.reedrecord.nee-a Total NumberofResuIts (Sea hRe
2 Se(s
243 cods .C CIVendex Wo 168u-20119 B S -sa - D iAwMt - EM ar twa
S .State renewable energy electricity policie An empirical evaluaton of effeltness
C ai S v ~.Ae1mer of Pb Policy Cr' for SuSlr.ot E7e-gy Evrnm nd0-.1 Ec0er7 c Deveopment. Umversty of North Car. Chapene Ce03'35. Chapef N. K 27599, Urded Stas) So ur E-erg P cy. v,370 Y
8. p 301-3MI1 A.gus 2004
Mao- 77.037'2,
esta - Detaa. - Link to article's abstract Ur E
2 Renewabre energy pokcy ad elect market reforms In China
Cthen: J-Wn A (C&etfo, Errer--netl Pobky. Database:. imp-ni Ceoege, Lcde. SW 7 2Z. U m -Iets .oco ore rg isyy3 .pM1-69 uy20
CompCde
Aistrac - Delsi~ed . 2"
FY 3. Renewable eeg Systems: How can space help?
02
x5225297
209175 h78C.- 14 71 C 9 IC-106 24-12-.M AA570 oy, C W V104 00.p
040 . 'Olooux . o.02. 5o5or-tiebs;0s
Syios-~neg
Cener Naioa
Apsta - eaivRerO~ Pwable WergLabarslery 563
Renewable~atina hsy ennewrbl wCscptal Energy, Laborahe
VoIrN-52 r (Tarq* ois- T o at on . c- C e: a 7 th nen n Astr oe ka o n - L30I048n5.3074 7.000700757547
Database:~~Cload Compende Of Sndi Nain 0aortrs9)
4 Renewableo eegy co.9 uns. barriers:00 c onetalssues 1C0'0ra570schoo o 0 7777 (s
-~~~~I Che-ca And IeNce Center
0 nNana Renewab Enerp Laboratory
0" . energy market coedilis and barriers in Tarttey Ei 7 p0128-1436. Augus&September20529 7 Renewable EnergyResrs (552)
529720 250.770 - ""s-09uA09.95 27420)'o70 7.
Abstrad- Detaled -** ~ " Poce"g of 7he keeroty Energy
S21 HOW EAcIl renewable energy is realy consumed? vesinEn32 rgCofrec
M-vsFe Eeg frae.AmsrtoAS eateto nryNw:e
~e
Source:EXecinc l-sEns. rn e I Con*-etc. EUECWt 205tasA-WlJoint EA, DOE, EW, E rCnt-cem Qer Renesbl And Sustaabl EergyGaba5 Cm" Cha5 a R.*e& g 206 2006. Scri es En0wena Cor00c E00EC 200 8t ANAoW EPA. DE M EPRW Core Air Qiy. G C00te chae9 and Rne'& Enery (ZT>
nOeftub . . CefeeceReodN-rW
"0009.oohk SP..kft C0.000 Absta -Dretailed - setam n
A-72520 Of~7 Sol -T, W,0 E32 Ac22 eingf tagets for renewabbe energy market penetlraon- Opiobns and tools for pokcy makers estimating Te impacts of renewable energy
tavdet. J-4r, Y (iCF ConsAngx ivarmar- K, eRai Soorce BElosm M~s EmoietlC Arnc, V EC 2005: Mu Amwal Jomt* EPA, DOE, E& EPMi Cossrenc on Ak 01a4it Gkov Cime C0-Wg and Ri weeble.. O v~g Energ 0270 200 2 0.20 cc0i0soooir C..nac rr seE7EC 2M 00f 4A- m ER. PAD 'OE .E.EPR C-onfre -n ' Qa0yGf Chaar C hang" nRanabie.W ergv 72
Database: Co'gendex e fW
PO .rrnAOedig Of Spe- T(e ntrnlina
-<AST EnergyLi (25 )
Re f ect AM(23 Er Ct
C '23 Role0ofsaOle~e orreewable enebgygeneration technologies in erbjo regionald Oban s0tJ5gs 70s7er.A
Astrad - Detaid -144)
; - 24. Environmret and employment based optimisabon model for renewable energy elann in Indian energy scene
DAas e: Com Snd550)
n Link to "Next 25" Resultser 53
An-Iff f.-M
AD~rad-3e-ale--
"-25 areeaenr neultas aperearthoghutte gihk li Nkxto th5"t"2 atesultsottomerightyo fc anhe
wheasim ore icheeEery 6 cnt -ains the rpi e'stitlauhor absracAprw rdsandcitti nses(48
treeo Com*,e S"My 44
Clicne o ne e t oe -sat" b t
aoer
Sehmarcle olinks eto a pg s lareo Ar n re tet on shonf iFi gre- 5. -hAgott
a
Vea
PinktY
Teexs ;5 atrbdri to hpage. Each relevant article has a link that redirects the user to another page that shows its abstract, which contains the article's title, author, abstract, keywords and citations.
Clicking on the "Abstract" button for each article links to a page similar to the one shown in Figure 5.
E
Engineering Vilage - - r3l33 - M, AI4Ccheo rdn to.d tl Seleced R-cs
a8. Rem al nrydevelopment policies the German onmewatrie enegri source act
li
-Hm itz? So.rce Proceedings ofrme EneEn/20J Cofrne.Eeg E - eromm 44 13, 2003 ISBI40: SBO 1328BED
noli-renc - rceed-g of rer '21D Conferenc: Erergv A Emircmet 11-14 Oct 20831, Chanigsba, Cina
Author affmatiom:
iept, & EnvIren. Pmtectio. Gem.,n Tec, .opera.1-n, Chine
Abstract The utilization of renwable energy resources has become 3 priority sildvwide. The reasons for lhis are e.g. energy supply security consider ations, energy divertsification. concemns of local
and egional air pollution from primarliy coal-tired power plants or concerns abiout glozal warming and imeeting greenhocuse gas reduction targets. China, despite a counitry abundantly endowed with '2;dia ediij tus renS energy resources like hydro, wind. solar. bipomsss. gEothermal. etc. still lacks a well-defined renewaWe enrergy policy atiming at In facilitate, support and Stimulate the greater utiliisstlon of
renew,"able enrgyil resources. Or, an international level, iLe. in developed arid developing countries various renewable energy development policies have deen adopted and imrplemEnted. This paper
pf0Vd"5 a ofiel -J..ie over tire VariUs implemesnted policies with a Special ocus on the German rene~wahie elergy source act1i4 refs) tispec c otol terms: : :its- crn~ e s sir.-rmg na ts rg
Unicontr-ledl 1erm5: .erewale enrydaanr emarnwble ln ee y it !--n energ stork Sa w -e.em- ersl &el. iae rdie we ei yea; a
Classmeiation Code: P:S2 EnErgy resCccS
Database:In.Spec
Abo~ blE. eaei;Vc - Feedback - Prm-cv Poliy TermSonC-itn It 209 svir c.Ai! rkNsa resrved.
Figure 5: Detailed Abstract Page for Each Article.
This page contains more detailed information about a specific article, including its Title, Author(s),-Publication Source, Author(s),-Publication Date, Abstract, Controlled Terms, Uncontrolled Terms, and
Classification Code
To extract all the relevant information, the database is first queried with the seed term, which is equivalent to typing in this lengthy URL:
http://www.engineeringvillage.com/controller/servlet/Controller?CID=quickSearchCitationForma t&database= <database number: 1 for Compdendex, 2 for Inspec>
&searchWord1= <seed term/phrase separated by "+" signs instead of spaces"> sectionlI=NO-LIMIT&boolean
1=AND&searchWord2=§ion2=NO- LIMITboolean2=AND&searchWord3=§ion3=NO-LIMIT&doctype=NO- LIMITtreatmentType=NO-LIMIT&disciplinetype=NO-LIMIT&language=NO-LIMITsort=relevance&yearselect=yearrange
&startYear= <start year to search for Publications> &endYear= <end year to search for publications>
stringYear=CSY 18 84CST 18 84ISY1 896IST1I896NS Y1I899NST1I899updatesNo= 1&search. x=23
&search.y=1I2&search=Search
Searching for patterns, or "regular expressions", within the convoluted source code of the results page, the URLs for the abstracts of each article are extracted. Then, each abstract UJRL is read individually, and the "title", "abstract", "controlled terms", and "uncontrolled terms" of each article are captured by searching for more regular expression patterns throughout the page.
After all the data from the abstracts within a specific results page are gathered, the URL of the next page containing the next 25 articles is gathered and the process is repeated for the articles / results within that page.
The data extraction process does not make many queries to the actual Engineering Village website. From the website's perspective, the data collection operation functions exactly like regular searches, where the "Next Page" button is clicked on multiple times. This is in
contrast to an earlier approach where data was gathered individually for each search term by continually querying the site and gathering the total number of results or "hit counts" produced by each search [Ziegler 2009]. This approach resulted in the generation of a very large number of requests to the remote website, which meant that we not only ran the risk of having our IP address blocked, we also could only run the taxonomy generation algorithm while connected to the
internet and from within the MIT network. The current approach downloads and collects the relevant data from the remote website in one quick sweep, permitting all subsequent
computations to be performed offline.
The use of Python's regular expression and URLLib packages allowed for the easy extraction of online data. There was one slight complication to the data gathering process, which was that Engineering Village only provided up to 4,025 articles per query, despite listing much more in its article count estimate at the top of the webpage. This meant that visiting the URL for the page after the 4,025h article would display an error. To get around this, the whole database was collected by conducting several incremental queries where the results of each were limited by altering the "start year" and "end year" parameters to extract only a subset of data each time, and then all the incremental search results were aggregated to produce one massive database. This allowed for the collection of bibliometric information from hundreds of thousands of articles.
All the bibliometric data taken from Compendex / Inspec was then stored in a local
SQLite3 database, chosen for its lightweight and easily transferrable properties. The database has the following schema:
" TITLE
* ABSTRACT
" CONTROLLED TERMS
* UNCONTROLLED TERMS
. JOINT TERMS
o representing the union of the controlled and uncontrolled terms
The core terms that will be used to populate the final taxonomy are gathered from either the CONTROLLEDTERMS, UNCONTROLLEDTERMS, or JOINTTERMS.
3.2.2 Scopus
In Masdar (MIST), the database of choice is Scopus. Scopus is the largest abstract and citation database of peer-reviewed literature and quality web sources. Updated daily, Scopus offers nearly 18,000 titles from more than 5,000 international publishers, including coverage of
conference papers. Scopus contains over 40 million records going back as far as 1823. Scopus covers topics in science, technology, medicine, and social science. 80% of all Scopus records have an abstract.
Scopus has a convenient feature where all the bibliometric information contained in the search results can be downloaded with a few simple clicks. As such, the data gathering process from Scopus was much simpler than the process for the Engineering Village databases. The bibliometric information downloaded from Scopus comprised of the following information for each relevant article produced by querying the site:
e AUTHORS . ABSTRACT e TITLE e YEAR " AUTHORKEYWORDS * INDEXKEYWORDS e SOURCE_TITLE . CORRESPONDENCEADDRESS 0 VOLUME e ISSUE * ARTICLENUMBER * PAGESTART * PAGEEND " EDITORS * PUBLISHER * ISSN " ISBN e CODEN 0 PAGECOUNT e CITEDBY " LANGUAGEOFDOCUMENT * ABBREVSOURCETITLE e
LINK
0 AFFILIATIONS * DOCUMENTTYPE 0 AUTHORSWITHAFFILIATION 0 SOURCEThe data gathered was then stored in an SQLite3 database, similar to Engineering Village. The core terms that are then used to populate the final taxonomy are gathered either from the AUTHORKEYWORDS or INDEXKEYWORDS. AUTHORKEYWORDS are similar to the "uncontrolled terms" in Compendex / Inspec, while INDEXKEYWORDS are similar to the "controlled terms".
For this thesis, bibliometric information pertaining to "renewable energy technologies was collected from Scopus and stored in a local SQLite3 database. This local database, which we refer to in all succeeding parts as the backend data set compiled for a given seed term is not fed into the taxonomy generation algorithms just yet. An additional transformation needs to be done to the information first. The process of converting the raw database information into a workable form is discussed in the succeeding sections.
3.3 Quantifying Term Similarity
In order to process the data, concepts from graph theory were used. In computer science, graphs are mathematical structures used to model pairwise relations between objects in a given set. A graph contains a collection of 'vertices' or 'nodes' (used interchangeably in this paper) and a collection of 'edges' or 'links' (also used interchangeably in this paper) connecting pairs of nodes. A graph may be undirected, which means there is no distinction between the two nodes
associated with each edge, or directed, in which case each edge specifies a path from one node to another. Several of the taxonomy generation algorithms developed and used in this paper are based on existing graph theory algorithms.
The first step in processing the data from the data set is to convert it into a workable graph. This graph is called a term similarity graph, where the nodes of the graph represent
individual terms and the edges between the nodes represent the strengths of their relationship with each other. A key intuition behind our approach is that the relationship between terms in the taxonomy can be quantified based on the frequency that these terms occur simultaneously in academic literature. Simply put, we assume that the repeated appearance of a specific keyword pair in several different articles implies a close relation between the terms. Building on this premise, we calculate the 'relationship strength' between each pair of nodes based on a similarity metric that took as primary input the frequency in which pairs of terms co-occurred within the bibliometric information of each article in the database. A co-occurrence between a pair of terms
is defined as the co-existence of two terms within a particular article's title, abstract, or keywords. Based on literature on the subject, we decided to use these forms of similarity: cosine similarity, symmetric and asymmetric normalized google distance (NGD) similarity. Cosine similarity and symmetric NGD produce a metric that is undirected between terms, whereas the asymmetric NGD metric produces a directed term strength metric.
3.3.1 Cosine Similarity
Cosine similarity is a measure of similarity between two vectors based on the cosine of the angle between them. This method is often used to compare documents in text mining, and connectedness within clusters in data mining. Given two vectors A and B, cosine similarity is
. A -B (Eq. 1)
cosine similarity =
A
-B(.
Applied to taxonomy generation, this can be rewritten as:
cosine similarity = n_'y (Eq. 2)
where nx and ny represent the number of articles that contain terms x and y respectively, and nx,y represents the number of articles that contain both x and y. An article is said to 'contain' a term if the term occurs within its title, abstract, or list of keywords.
Application of the formula in Eq. 2 results in a cosine similarity value of between 0 and
1, where 0 means independent, and 1 means exactly similar. Also, note that the cosine similarity
between two terms is symmetric. This means that the similarity of term a to term b is the same as the similarity of term b to term a. Because of this, when applied to taxonomy generation, the cosine similarity of a pair of terms does not give a clear indication regarding which of the terms in the pair will be the child of the other in the final generated taxonomy.
3.3.2 Symmetric Normalized Google Distance Similarity
The symmetric normalized Google7 distance (NGD) similarity between terms is based on [Cilibrasi & Vitanyi 2007]. In their work, they described Google Distance as a method that uses term co-occurrence frequencies to indicate how close terms are related to each other. The closed form expression of the Normalized Google Distance is:
maxtlog n, log ny} - log n,,y (Eq. 3)
log N - minflog nx, log ny}
where nx and ny are the number of results returned by a search in an online database (e.g. Google) for each individual term, N is a large number representing the total number of possible results, and nx,y is the number of results returned by a joint search for both terms. The main thrust the research in [Cilibrasi & Vitanyi 2007] was to develop a new theory of semantic distance between a pair of objects based on a backend derived from a set of documents.
Graphically, cosine similarity and symmetric NGD can be imagined as creating undirected edges between nodes, as shown in Figure 6, thus creating an undirected graph. 7 Although the word "Google" is used, the "Google" database is not actually used in our version of the similarity metric. The use of "Google" in the similarity metric's name is used because the original authors of the paper where the algorithm was initially presented [Cilibrasi & Vitanyi 2007] used Google in their analysis and accordingly named the distance metric they created.
Dijsktra-Jarnik-Prim's (DJP) algorithm, Kruskals algorithm and Heymann algorithm are all algorithms that use undirected graphs as initial input.
Node Edge weight Node
1 2
Figure 6: Illustration of Undirected Edge
3.3.3 Asymmetric Normalized Google Distance Similarity
The asymmetric NGD metric was developed in [Woon & Madnick 2008] by analyzing the symmetric NGD metric and noticing that the original closed form equation as seen in Eq. 3 uses the "max" and "min" functions and ultimately derives a symmetric relationship between two terms. The use of these functions hides some information. The idea was to create a similarity metric between a pair of terms that clearly indicates the parent-child relationship between them. As such, an asymmetric metric was needed. It was noticed that the symmetric NGD metric could
be easily turned into an asymmetric measure by removing the "max" and "min" operators. In Eq. 3, the first term in the numerator and the last term in the denominator are picking the max and
min of the terms nx and ny respectively. Since the max and min are mutually exclusive, what this equation really is doing is placing one of n, or ny in the numerator and the other in the
denominator, leading to two possible interpretations of the formula:
log nx - log nx,y (Eq. 4)
aNGD(?, ?)= = oN on
log N - log ny
log ny - log nx,y (Eq. 5)
aNGD(?, ?) = lg on
log N - log nx
To see which of the two equations above refers to term x being a child of term y, a simple test case was run. Using Engineering Village, we ran a query for "power" and "hydroelectric power". Intuitively, "hydroelectric power" should be a subset of "power", and hence should be its child.
Running a query for ["hydroelectric power"] in Engineering Village produces 30,918 results. Running a query for ["power"] produces 2,616,414 results. Running a query for ["power"
AND "hydroelectric power"] displays 30,918 results. N was chosen to 1010, an arbitrarily large
number. From this:
aNGD(?,?) = "I "'hydroelectric power" -log nboth = 0 (Eq. 6) log N - log npower