5838
Genetic diversity in Egyptian and Saudi goat breeds
using microsatellite markers
Karima F. Mahrous1*, Saleha Y. M. Alakilli2, Lamiaa M. Salem1&2, Sekena H. Abd El-Aziem1 , Amr A.
El-Hanafy2&3
1Cell Biology Department, National Research Centre, Dokki, Giza, Egypt.
2Department of Biological Sciences, Faculty of Science, King Abdul-Aziz University, Jeddah, Saudi Arabia.
3Department of Nucleic Acid Research, Genetic Engineering and Biotechnology Research Institute, City for Scientific
Researches and Technology Application, Borg EL-Arab, Alexandria, Egypt.
*Corresponding author. E-mail: [email protected] . Tel: +202-3669978. Fax: +202-3370931.
Original submitted in on 25th September 2013 Published online at www.m.elewa.org on 30th December 2013.
ABSTRACT
Objective: The genetic polymorphism within and among three indigenous goat breeds found in Egypt (Barki and Zaraibi) and in Saudi Arabia (Ardi) was detected by twelve microsatellites.
Methodology and results: A total of 95 blood samples were collected from the Egyptian and Saudi goat breeds. Genomic DNA was extracted from whole blood of each sample and microsatellites techniques were used for analysis of DNA. The results showed that, the total number of detected alleles varied from 2 (MMP9) to 16 (DRB2). The mean numbers of alleles per locus are 4.8, 4.3 and 6.2 in Barki, Ardi and Zaraibi, respectively. The mean of expected heterozygosity of the breeds ranged from 0.696 to 0.725. After corrections for multiple significance tests, deviations from Hardy-Weinberg equilibrium were statistically significant over all populations and loci, reflecting the deficiencies of heterozygotes (global FIS=0.053). Based on pairwise FST and Nm between different breeds, there was a great genetic differentiation between Ardi goat and the other two Egyptian breeds, UPGMA dendrogram based on Nei’s genetic distance grouped the investigated goat breeds genotypes into two clusters. The first cluster includes Egyptian breeds (Barki and Zaraibi) where as the second cluster includes Saudi breed (Ardi) which appeared to be most distant from the other breeds.
Conclusions and application of findings. In conclusion, these results can be useful for the development of a rational breeding strategy for genetic improvement of goats in Egypt and Saudi Arabia. The studied Mediterranean breeds sampled from African and Asian populations seem to have differentiated from each other with only little genetic exchange between the geographically isolated populations.
Key words: Microsatellites, Goats, Genetic diversity, Genotype. INTRODUCTION
The goat was the first animal domesticated production by humankind. Goats are the most widely spread domestic species in the world and play an important economical role in developing countries (Adriana et al., 2010). Goats have been important for food and economic securities for countless years and their contributions to
economic returns in developed countries has been rising as well (Sahlu et al., 2005).
In Egypt, goats are an important source of meat. They are distributed across the country, especially dense in the Nile valley and delta region (Galal et al. 2005). Most of the livestock breeds in Egypt lack molecular characterization required for establishing
Journal of Applied Biosciences 72:5838– 5845
5839 adequate utilization of genetic variation in developing animal production. Goats are spread over a wide range of habitats with a substantial concentration in the tropics and dry zones in developing countries (Galal 2005; FAOSTAT 2006). Therefore, they are expected to show a large amount of genetic diversity in adapting to the varying ecosystems. So far, the goat diversity studies based on microsatellites have been because of their high degree of polymorphism, random distribution across the genome and neutrality with respect to selection. Many bovine microsatellite markers have been used for genetic analysis in sheep and goats (Bruford & Wayne 1993). The Egyptian goats are classified into several breeds differing in colour, size and other morphological features, such as Zaraibi, Baladi, Sinawi or Bedouin, Barki and Saidi. However, in Saudi Arabia where the climate is suitable for goat, the number of goats is believed to exceed 7.5 million mainly of the Masri and Ardiin breeds. The Ardi goats are more adapted to the arid region than the Masri the region (Salah et al., 1989). The Ardi goats are more adapted to the arid region than Masri. Although, the latter produces more milk (Al Saidy et al., 2007), while the first produces milk steadily and therefore, is greatly appreciated by desert dwellers, where it is widely spread. The contribution of goat
meat to the total meat income of Saudi Arabia is about 30%. Although, goats have a large and substantial contribution to the total meat income of Saudi Arabia, this species remain neglected and rearing is exclusively in the hand of the nomadic people. Little information is available about the phylogeny and genetic relations between Saudi Arabia goat breeds. In addition, few studies were conducted for genotyping of most important economic traits of Saudi Arabia goats and few steps were taken in the area of genetic improvement of these local adaptive genetic resources. Microsatellite markers are widely accepted as a choice marker for genetic characterization of populations as they are highly polymorphic single locus DNA sequences scattered throughout the genome and are readily adaptable to Polymerase Chain Reaction (PCR). Many authors have used microsatellites for molecular genetics characterization of goat (Ramljak et al., 2011). However, the genetic characterization for Egyptian and Saudi goat breeds has not been assessed and the present work will become the first study of the kind.
The aim of this study is attempt to identify the genetic variations within and between Barki, Zaraibi Egyptian goats and Ardi Saudi goats based on microsatellite analysis.
MATERIALS AND METHODS
Animal Material: Ninety Five (95) blood samples were collected from the three goat breeds, Where, Barki breed samples (n.35) obtained from the research farm of the Department of Animal Production, Faculty of Agriculture, Cairo University, while, Zaraibi breed samples (n.35) from the Agriculture research station (El-Serow, Domiatta) of the Animal Production Research Institute, Agriculture Research Center, Ministry of Agriculture. Meanwhile, the sample of Saudi (25) Ardi breed was collected from different Farms of Faculty of Science, King-Abd El-Aziz University. The samples were collected from unrelated animals.
DNA extraction: Genomic DNA extraction was extracted from blood samples using a standard phenol: chloroform extraction method (Sambrook et al., 1989). Twelve microsatellite markers were studied: OarFCB128, TGLA53, D5S2, BP33, MAF65, DRB2, OarFCB20, INRA49, CSRD247, INRA172, MMP9, and BP28. Microsatellites amplification was carried out using
fluorescent-labelled primers. The amplified products were analysed with a DNA capillary sequencer ABI Prism® 310 Genetic Analyzer (Applied Biosystems).
Statistical analysis: POPGENE software package (Yeh et al., 1999) was used to calculate allele frequencies, observed number of alleles, effective number of alleles (Kimura and Crow, 1964), observed (Ho) and expected (He) heterozygosity at each locus in the six populations under study. Polymorphism information content (PIC) value for each locus was calculated by using the method described by Bostein et al. (1980). Pair-wise allele sharing was calculated manually from the raw data. Using the variance-base method of Weir and Cockerham (1984), population differentiation by F-statistics was computed using FSTAT version 2.9.3.2 computer program (Goudet, 2002). Mean standard deviations of the F-statistics program that are analogue to Wright's (1951, 1978). FIS and FST were obtained across breeds by the Jackknifing procedure over loci (Weir, 1990). The extent
5840 of global inbreeding was further studied with the same software by estimated FIS value. The effects of migration and gene flow on the genetic structure of the analyzed populations were estimated between pairs of populations
according to an island model under neutrality and negligible mutation (Slatkin, 1985). Genetic distances among populations were estimated using (Ds) standard genetic distance of Nei (1972).
RESULTS AND DISCUSSION:
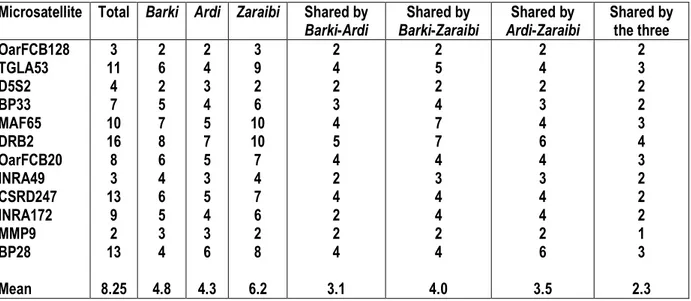
The result showed that all 12 markers successfully amplified in Egyptian and Saudi goat microsatellite loci. All marker microsatellite loci examined were polymorphic in all tested breeds. The number of alleles for each of the twelve microsatellite loci in each of the three breeds. The total number of detected alleles varied from 2 (MMP9) to 16 (DRB2). The mean numbers of alleles per locus are 4.8, 4.3 and 6.2 in Barki, Ardi and Zaraibi, respectively. The mean number of alleles shared between Barki and Ardi is 3.1, between Barki and Zaraibi is 4.0 and between Ardi and
Zaraibi is 3.5, whereas the mean number of the alleles shared by the three breeds is 2.3. The most noticeable difference is found at MMP9 locus, where only 1 allele, out of a total of 13 alleles, is shared by the three breeds. On the other hand, 2 alleles, out of the total of 3 alleles, are shared by the three breeds at OarFCB128 and INRA49 loci. It is also noticed that all alleles representing the OarFCB128 and MMP9 loci are present in Zaraibi breed, while allele of the INRA49 Loci is present in Ardi breed (Table 1).
Table 1: Number of alleles at each microsatellite locus in the three breeds and the number of alleles shared between breeds.
Microsatellite Total Barki Ardi Zaraibi Shared by Barki-Ardi Shared by Barki-Zaraibi Shared by Ardi-Zaraibi Shared by the three OarFCB128 TGLA53 D5S2 BP33 MAF65 DRB2 OarFCB20 INRA49 CSRD247 INRA172 MMP9 BP28 Mean 3 11 4 7 10 16 8 3 13 9 2 13 8.25 2 6 2 5 7 8 6 4 6 5 3 4 4.8 2 4 3 4 5 7 5 3 5 4 3 6 4.3 3 9 2 6 10 10 7 4 7 6 2 8 6.2 2 4 2 3 4 5 4 2 4 2 2 4 3.1 2 5 2 4 7 7 4 3 4 4 2 4 4.0 2 4 2 3 4 6 4 3 4 4 2 6 3.5 2 3 2 2 3 4 3 2 2 2 1 3 2.3 The mean number of alleles identified in this study is
8.25 and this value similar to the values obtained for the Croatian spotted goat and the Markhoz goat, which number of alleles of 8.1 (Ramljak et al., 2011; Mahmoudi et al., 2009), for Barbari goats from India was 6.3 (Ramamoorthi et al., 2009), Raeini goat from Iran was 7.8 (Sadeghi et al., 2010) and for Egyptian and Italian goat breeds was 6.5 (Agha et al., 2008). The average Observed and expected heterozygosity (Ho and He) are shown in Table 2 the highest observed heterozygosity (0.671) was shown in Ardi breed, while the lowest (0.611) was shown in Barki breed. The observed heterozygosity showed high genetic
variability. This might be due to low selection pressure, large population size and immigration of new genetic materials. Average value of Ho of the three goat breeds were higher than some breeds such as Gohilwari (Ho=0.51; Kumar et al., 2009), Sirohi (Ho=0.50; Verma et al., 2007), Sub-Saharan breeds (Ho=0.56; Muema et al., 2009) Korian goat (Ho=0.36; Kim et al., 2002), Jamunapari of India (Ho=0.42; Gour et al., 2006) and Gohilwadi breed (Ho=0.63; Fatima et al., 2008), but lower than Spanish Guadarrama (Ho=0.78; Serrano et al., 2009) and Croatian spotted breed (Ho=0.76; Jelena et al., 2011).
5841
Table 2: Number of animals (n), mean observed number (na) (and SD) of alleles, mean (and SE) of observed (Hobs) and expected heterozygosity (Hexp) and the exact test for Hardy-Weinberg equilibrium (HWE) in Egyptian and Saudi goat breeds
Breed n na Hobs Hexp HWE test1
Barki Ardi Zaraibi 35 25 35 4.8 (2.3) 4.3 (1.98) 6.2 (2.89) 0.611 (0.069) 0.671 (0.035) 0.628 (0.072) 0. 725 (0.083) 0.711 (0.033) 0.696 (0.089) 0.0566 0.1170 0.1246
Another measure of genetic variability is expected heterozygosity where, maximum expected heterozygosity (0.725) was showed in Barki goat and the minimum (0.696) was shown in Zaraibi goat. This study results indicate the three tested goat breeds have substantial amount of genetic diversity, when compared to some other goat breeds around the world where, Sri Lanka South (He=0.48), Sri Lanka N-Central (He=0.49) and Australian goat (He=0.45; Barker et al., 2001), some Indian goat breeds such as, Jamunapari (He=0.54), Marwari (He=0.63), Zalawadi (He=0.58), Gohilwadi (He=0.67), and Surti (He=0.64) (Fatima et al., 2008; Kumar et al., 2005; Gour et al., 2006), Swiss goat breeds (He=0.66; Glowatzki-Mullis et al., 2008), Canary Island goats (He=0.62; Martínez et al., 2004), Kalahari Red goats (He=0.63; Kotze et al., 2004), Sub-Saharan breeds (He=0.54; Muema et al., 2009) and some Korean goats (He=0.38; Kim et al., 2002). On the other hand, the goat breeds tested in our study showed less genetic diversity when compared to some Indian goat breeds such as, Kutchi (He=0.80), Sirohi (He=0.79) and Chegu (He=0.81), some Iranian goat breeds (He=0.74-0.80), Sardinian goat breed of Italy
(He=0.74), Spanish Guadrrama (He=0.81), Croatian spotted breed (He=0.77) and Chinese goat breeds (He=0.78-82) (Behl et al., 2003; Dixit et al., 2008; Guo-hong et al., 2010; Jelena et al., 2011; Mahmoudi et al., 2010; Sechi et al., 2005; Serrano et al., 2009; Verma et al., 2007). While, the value of Observed and expected heterozygosity was similar to those reported for Portuguese goat breeds (HO=0.636, HE=0.702) (Bruno et al., 2011), meanwhile Croatian spotted goat with means for expected gene diversity of 0.771 and observed heterozygosity of 0.759 (Ramljak et al, 2011). Mean observed allele for all loci found to be 4.8, 4.3 and 6.2 in Barki, Ardi and Zaraibi respectively, which explains variation level of polymorphism of the studied microsatellites. The average values was lower than observed numbers of alleles were reported for Barbari goat from India (na=6.33; Ramamoorthi et al., 2009), Italian goat breeds (na=6.5; Agha et al., 2008) and Taleshi from Iran (na=6.7 Mahmoudi and Babayev,
2009). However, the Croatian spotted breed (na=8.1;
Jelena et al., 2011) and the average value of seven Indian goat breeds (na=8.1-9.7; Rout et al., 2008).
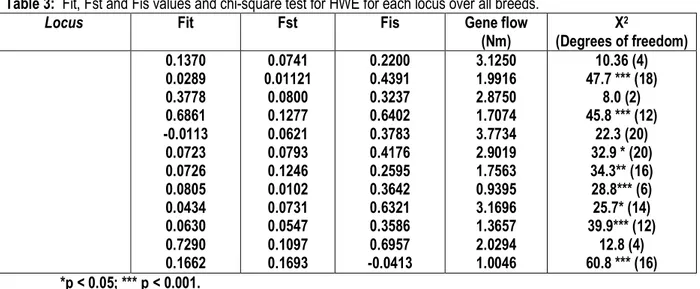
Table 3: Fit, Fst and Fis values and chi-square test for HWE for each locus over all breeds.
Locus Fit Fst Fis Gene flow
(Nm) X2 (Degrees of freedom) 0.1370 0.0289 0.3778 0.6861 -0.0113 0.0723 0.0726 0.0805 0.0434 0.0630 0.7290 0.1662 0.0741 0.01121 0.0800 0.1277 0.0621 0.0793 0.1246 0.0102 0.0731 0.0547 0.1097 0.1693 0.2200 0.4391 0.3237 0.6402 0.3783 0.4176 0.2595 0.3642 0.6321 0.3586 0.6957 -0.0413 3.1250 1.9916 2.8750 1.7074 3.7734 2.9019 1.7563 0.9395 3.1696 1.3657 2.0294 1.0046 10.36 (4) 47.7 *** (18) 8.0 (2) 45.8 *** (12) 22.3 (20) 32.9 * (20) 34.3** (16) 28.8*** (6) 25.7* (14) 39.9*** (12) 12.8 (4) 60.8 *** (16) *p < 0.05; *** p < 0.001.
5842 The mean number of alleles and expected heterozygosities were very accurate indicators of the genetic polymorphism within the breed. Normally the average number of alleles depends on sample size and generally, number of observed alleles tends to increase with increase in population size. Tests of genotype frequencies for deviation from HWE, at each locus overall breeds, reveal significant departure from HWE (P>0.05 and P>0.001) (Table 3).The tested microsatellite markers showed significant inbreeding coefficients Fis were positive for 11 loci and negative for BP28 of the studied loci which ranged from 0.041 showed by BP28 locus to 0.696 showed by MMP9 locus.This level of inbreeding may be a result of high levels of mating between closely related individuals under field conditions. On the other hand inbreeding values in comparison with Mehsana (Fis=0.16; Aggarwal et al., 2007) and Jamunapari (Fis=0.19; Gour et al., 2006) breeds of India, Low inbreeding values were also reported within 45 rare breeds of 15 European and Middle Eastern countries (Caňón et al., 2006). Meanwhile some of the Indian breeds showed significant inbreeding such as Marwari (Fis=0.26; Kumar et al., 2005) and Kutchi (Fis=0.23; Dixit et al., 2008) breeds. Genetic differentiations quantified by Fst estimates ranged from 0.0102 showed by locus INRA49 to 0.169 showed by locus BP28 with an
average of 0.12 showed in table 4. According to Hartl (1980), per pair FST value equals to 0.05 is indicative for moderate differentiation between populations. The pair FST values reported in the present investigation in all tested loci varied than 0.05, which may indicate a high differentiation between populations under investigation. The global Fit is 0.333 while, in this study Fit ranged from 0.0113 showed by MAF65 locus to 0.7290 showed by MMP9, which, indicated different degrees of genetic differentiation. This may be due to the high geographic distance between the areas in Egyptian and Saudi countries. Migration has a great effect on the reduction of genetic differentiation between populations (Laval et al., 2000). A great genetic differentiation between Saudi and the other two Egyptian goat breeds was found. From indirect estimates (Nm) of gene flow, where, the lowest Nm value was 0.9395 for the locus INRA49, while the highest value was 3.7734 for the locus MAF65. The standard genetic distance and the UPGMA dendrogram of the populations are shown in Table 4 and in Figure 1, respectively. The highest genetic distance was found between Barki and Ardi breeds (0. 3825). The lowest value for genetic distance was found between Zaraibi and Ardi (0.2075) (Table4). High values for genetic identity means low values for genetic distance and vice versa.
Table 4: Genetic Identity and Genetic Distance (Nei 1972) for all loci and all breeds. Nei’s genetic identity (above diagonal) and genetic distance (below diagonal)
pop Barki Ardi Zaraibi
Barki Ardi Zaraibi **** 0.3825 0.2075 0.6821 **** 0.1887 0.8126 0.8280 ****
Fig 1. UPGMA dendogram generated from Nei, s genetic distances of the three goat breeds
This study revealed the genetic distance matrix of the Egyptian Barki and Zaraibi goats is near or close areas while Ardi goats so far geographically (Saudi) from the Egyptian region Finally, the genetic relationship
dendrogram showed that the Barki and Zaraibi goats are from a common ancestor (the same cluster) while the Ardi came from another ancestor or cluster. In addition, the cluster analysis obtained from Nei's
5843 dendogram confirmed the closeness of Zaraibi and Barki; both clustered independently from Ardi breed at
0.62 of genetic distance.
CONCLUSION
This work has demonstrated that 12 microsatellite markers used in the present study were shown to be polymorphic. The Ardi goat showed high levels of genetic diversity from the Egyptian goats (Barki, Zaraibi). The markers used in this study are useful for the molecular characterization of Egyptian and Saudi goats. The information elucidated through the present study would be useful for the formulation of effective conservation strategies. This study is the first report using microsatellite analysis to understand the genetic
diversity of the Saudi and Egyptian goat and different between them, this information is very important for meeting the demands of future breeding programs as well as for formulating effective conservation strategies for genetic diversity within breeds. Although we have used only three representative goat breeds to understand the genetic backgrounds of domestic goats in the two countries the present study contributes to the knowledge and genetic characterization of Egyptian and Saudi goat breeds.
REFERENCES:
Adriana, M.A. De, S.E.F. Guimarães, C.S. Pereira, P.S. Lopes, M.T. Rodrigues and T.M.M. Machado, 2010. Paternity in Brazilian goats with DNA microsatellites. R. Bras. Zootec., 5: 1011-1014. Aggarwal RAK, Dixit SP, Verma NK, Ahlawat SP, Kumar Y, Kumar S, Chander R, Singh KP (2007). Population Genetics Analysis of Mehsana Goat based on Microsatellite Markers. Curr. Sci. 92:1133-1137.
Agha, S.H.; Pilla, F.; Galal, S.; Shaat, I.; D’Andrea, M.; Reale, S.; Abdelsalam, A.Z.A. and Li, M.H. (2008): Genetic diversity in Egyptian and Italian goat breeds measured with microsatellite polymorphism. J. Anim. Breed. Genet., 125: 194–200.
Al Saidy MY, AL Shaikh MA, Mogawer HH, AL Mufarrej SI, Kraidess MS(2007). Effect of feeding different levels of Fenugreek seeds ( Trigonella foenum. graecum L) on milk yield, milk fat and some blood hematology and chemistry of Ardi goat. J.Saudi Soc. For. agric. Sci. 2: 62-65. B.S. Weir, Genetic Data Analysis, Sinauer, Sunderland,
MA, 1990
Barker J. S. F ,. Ta S. G, Moore S. S., Mukherjee T. K.,. Matheson J.-L and Selvaraj O. S. (2001). Genetic variation within and relationships among populations of Asian goats (Capra hircus). J. Anim. Breed. Genet. 118, 213±233
Behl R, Sheoran N, Behl J, Vijh RK, Tantia MS (2003). Analysis of 22 heterologous microsatellite markers for genetic variability in Indian goats. Anim. Biotechnol. 14:167-175.
Bostein, D.; White, R.L.; Skolnick, M. and Davis, R.W. (1980): Construction of genetic linkage maps in
man using restriction fragment length polymorphism. Am. J. Hum. Genet. 32: 314–331 Boyazoglu, J., I. Hatziminaoglou and P. Morand-Fer, 2005. The role of the goat in society: past, present and perspectives for the future. Small Rum. Res., 60: 13-23.
Bruford M.W., Wayne R.K. (1993) Microsatellites and their application to population genetic studies. Curr. Opin. Genet. Dev., 3, 939–943.
Bruno-de-Sousa, C., A.M. Martinez, C. Ginja, F. Santos-Silva, M.I. Carolino and J.V. Delgado, 2011. Genetic diversity and population structure in Portuguese goat breeds, Livest Sci., 135: 131-9. Caňón J, Garcia D, Garcia-Atance MA, Obexer-Ruff G, Lenstra JA, Ajmone-Marsan P, Dunner S, The ECONOGENE Consortium (2006). Geographical partitioning of goat diversity in Europe and the Middle East. Anim. Genet. 37:327-334.
Dixit SP, Verma NK, Ahlawat SPS, Aggarwal RAK, Kumar S, Chander R, Singh KP (2008). Molecular genetic characterization of Kutchi breed of goat. Curr. Sci. 95(7):946-952. FAOSTAT (2006) CD-ROM. Food and Agriculture
Organization of the United Nations, Rome, Italy. Fatima S, Bhong CD, Rank DN, Joshi CG (2008). Genetic variability and bottleneck studies in Zalawadi, Gohilwadi and Surti goat breeds of Gujarat (India) using microsatellites. Small Rum. Res. 77(1):58-64.
Galal S. (2005) Biodiversity in goats. Small Rumin. Res., 60, 75–81.
Galal S., Abdel-Rasoul F., Anous M.R., Shaat I. (2005) On-station characterization of small ruminant breeds in Egypt. In: L. In˜ iguez (ed.),
5844 Characterization of Small Ruminant Breeds in West Asia and North Africa, Vol. 2. ICARDA, Aleppo, Syria, pp.141–193
Glowatzki-Mullis ML, Muntwyler J, Bäumle E, Gaillard C (2008). Genetic diversity measures of Swiss goat breeds as decision-making support for conservation policy. Small Rum. Res. 74(1-3):202-211.
Goudet J. (2002) FSTAT (version 2.9.3.2): a program to Estimate and Test gene Diversities and Fixation
Indices. Available from
http://www.unil.ch/izea/software/ fstat.html. Updated from Goudet (1995).
Gour DS, Malik G, Ahlawat SPS, Pandey AK, Sharma R, Gupta N, Gupta SC, Bisen PS, Kumar D (2006). Analysis of genetic structure of Jamunapari goats by microsatellite markers. Small Rum. Res. 66:140-149.
Guo-hong L, Xiang C. Cheng-song J, Wen-shi Z, Hong W (2010). Study on genetic polymorphisms of seven goat breeds by using microsatellite marker. China Anim. Husb. Vet. Med. 37:127-130.
Hartl D (1980). Principles of population Genetics. Sinauer Associates Inc, Sunderland Massachussets, USA.
Jelena R, Mioc B, Curkovic M, Pavic V, Ivankovic A, Medugorac I (2011) Genetic diversity measures of the Croatian spotted goat. Acta Vet (Beograd). 61:373-382.
Kim KS, Yeo JS, Lee JW, Kim JW, Choi CB (2002). Genetic diversity of goats from Korea and China using microsatellite analysis. Asian-Aust. J. Anim. Sci. 15:461-465.
Kimura,,M. Crow, J.F. (1964). Genetics, 68: 47. Kotze A, Swart H, Grobler JP, Nemaangani A (2004). A
genetic profile of Kalahari goat breed from South Africa. S. Afr. J. Anim. Sci. 34(1):10-12. Kumar S, Dixit SP, Sharma R, Pande AK, Sirohi G, Patel
AK, Aggarwal NK, Gour DS, Ahlawat SPS (2005). Population structure, genetic variation and management of Marwari goats. Small Rum. Res. 59:41-48.
Kumar S, Dixit SP, Verma NK, Singh DK, Pande A, Kumar S, Chander R, Singh LB (2009). Genetic Diversity Analysis of the Gohilwari Breed of Indian Goat (Capra hircus) Using Microsatellite Markers. Am. J. Anim. Vet. Sci. 4(3):49-57. Laval G, Iannuccelli N, Legault C, Milan D, Groenen
MAM, Giuffra E, Andersson L, Nissen PH, Jorgensen CB, Beeckmann P, Geldermann H,
Foulley JL, Chevalet C, Ollivier L (2000). Genetic diversity of eleven European pig breeds. Genet. Select. Evolut. 32: 187-203 Mahmoudi B, Babayev M. (2009). The investigation of
genetic variation in Taleshi goat using microsatellite markers. Res. J. Biol. Sci. 4:644-646.
Mahmoudi B, Bayat M, Sadeghi R, Babayev M, Abdollahi H (2010). Genetic Diversity among Three Goat Populations Assessed by Microsatellite DNA Markers in Iran. Glob. Vet. 4(2):118-
Mahmoudi, B., M. Daliri, M. Sh. Babayev and R. Sadeghi, 2009. Genetic analysis of Markhoz goat based on microsatellite markers, J. Anim. Vet. Adv., 8: 1815-8.
Martínez AM, Carrera MP, Acosta JM, Rodríguez-Gallarda PP, Cabello A, Camacho E, Delgado JV (2004). Genetic characterization of the Blanca Andaluza goat based on microsatellite markers. S. Afr. J. Anim. Sci. 34(1):17-19. Muema EK, Wakhungu JW, Hanotte O, Jianlin H (2009).
Genetic diversity and relationship of indigenous goats of Sub-Saharan Africa using microsatellite DNA markers. Livestock Research for Rural Development. 21. Article No.28.
Nei, M. (1972): Genetic distance between populations. Am. Nat., 106: 283–292.
Nei, M.; Tajima, F. and Tateno, Y. (1983): Accuracy of estimated phylogenetic trees from molecular data. J. Mol. Evol. 19: 153–170.
Ramamoorthi, J., K. Thilagam, S.N. Sivaselvam and S.M.K. Karthickeyan, 2009. Genetic characterization of Barbari goats using microsatellite markers, J. Vet. Sci., 10: 73-6. Ramljak, J., B. Mioc, M. Urkovic, V. Pavic A. Ivankovic
and I. Medugorac, 2011. genetic diversity measures of the Croatioan spotted goat. Acta Veterinaria, 61: 373-382.
Rout KP, Joshi MB, Mandal A, Laloe D, Singh L, Thangaraj K (2008). Microsatellite-based phylogeny of Indian domestic goats. BMC Genet. 9(11):1-11.
Sadeghi, R., B. Mahmoud, M. Bayat. A. Jafarzade, S. Gh. Montazeri and S. Seyyedsafavi, 2010. Genetic diversity of Raeini goat population based on microsatellite, J. Anim. Vet. Adv., 9: 661-5.
Sahlu, T. and A.L. Goetsch, 2005. A foresight on goat research. Small Rum. Res., 60: 7-12.
Salah MS, Bakkar MN, Mogawer HH (1989). Body weight of Aradi goat kids in Saudi Arabia at different
5845 ages and affecting factors. J. King Saudi Univ. Agric. Sci. 1(1, 2):17-24.
Sambrook J., Fritsch E.F., Maniatis T. (1989) Molecular Cloning: A Laboratory Manual. Cold Spring Harbor Laboratory Press, Cold Spring Harbor, New York, USA
Sechi T, Usai MG, Casu S, Carta A (2005). Genetic Diversity of Sardinian goat population based on microsatellites. Ital. J. Anim. Sci. 4(2):58-60. Serrano M, Calvo JH, Martínez M, Marcos-Carcavilla A,
Cuevas J, González C, Jurado JJ, de Tejada PD (2009). Microsatellite based genetic diversity and population structure of the endangered Spanish Guadarrama goat breed. BMC Genet. 10: 61.
Slatkin, M. (1985): Gene flow in natural populations. Ann. Rev. Ecol. Syst., 16: 393-430.
Verma N K, Dixit SP, Aggarwal RAK, Chander R, Kumar S, Ahlawat SPS (2007). Genetic analysis of the Sirohi breed of Indian goat (Capra hircus). Korean J. Genetics. 29:129-136.
Weir, B.S., Cockerham, C.C. (1984). Evolution 38:1358– 1370.
Wright, S. (1978): Evolution and the genetics of population. Variability Within and Among Natural Population, vol. 4. University of Chicago Press, Chicago, IL.
Wright, S.(1951): The genetic structure of populations. Ann. Eugen.15:323–354.
Yeh F.C., Yang R.C., Boyle T. (1999) POPGENE (version 1.31): A Microsoft Windows-based Freeware for Population Genetic Analysis. University of Alberta and the Centre for International Forestry Research, Edmonton, Canada.