O R I G I N A L A R T I C L E
Molecular characterization and differentiation of five horse breeds raised in Algeria using polymorphic microsatellite markers
N. Berber
1, S. Gaouar
2, G. Leroy
3,4, S. Kdidi
5,6, N. Tabet Aouel
7& N. Sa € ıdi Mehtar
11 Laboratoire de Genetique Moleculaire et cellulaire, Universite des sciences et de la technologie d’Oran–mohamed Boudiaf- USTOMB, BP 1505 El M’naouer, Oran, Algeria
2 Departement de biologie, Universite de Tlemcen, Telemcen, Algeria 3 AgroParisTech, UMR1236 Genetique et Diversite Animales, Paris, France 4 INRA, UMR1236 Genetique et Diversite Animales, Jouy-en-Josas, France 5 Livestock & Wildlife Laboratory, Arid Lands Institute, Medenine, Tunisia
6 Laboratory of Genetics, Immunology and Human Pathology, Faculty of Sciences, Tunis-El Manar University, Tunisia, Tunisia 7 Departement de biotechnologie, Universite d’Oran Es-senia, Oran, Algeria
Keywords
Barb; Arab-Barb; genetic distances; factorial correspondence analysis; structure analysis.
Correspondence
N. Berber, Laboratoire de Genetique Moleculaire et cellulaire, Universite des sciences et de la technologie d’Oran– mohamed Boudiaf- USTOMB, BP 1505 El M’naouer, Oran, Algeria.
Tel: +213 64 60 15 24;
E-mail: [email protected] Received: 7 February 2014;
accepted: 16 April 2014
Summary
In this study, genetic analyses of diversity and differentiation were per- formed on five horse breeds raised in Algeria (Barb, Arab-Barb, Arabian, Thoroughbred and French Trotter). All microsatellite markers were highly polymorphic in all the breeds. A total of 123 alleles from 14 microsatellite loci were detected in 201 horses. The average number of alleles per locus was the highest in the Arab-Barb horses (7.86) and lowest in the thor- oughbred breed (5.71), whereas the observed and expected heterozygosi- ties per breed ranged from 0.71 (Thoroughbred) to 0.752 (Barb) and 0.71 (Thoroughbred) to 0.77 (Arab-Barb), respectively. The genetic differentia- tion between the breeds was significant (p < 0.01) based on the infinitesi- mal model (F
ST). Three different approaches for evaluating the genetic relationships were applied. Genetic distances, the factorial correspondence analysis and structure analysis showed that a significant amount of genetic variation is maintained in the native horse populations and the other breeds. The Barb and Arab-Barb breeds seem to be the most genetically related and support the decision to consider the breeds as same population.
Introduction
In Algeria, the horse occupies an important space in the history, the culture and tradition of the society.
Horses also represent an important market, with nearly 100 000 horses according to the data of the Algerian Ministry of Agriculture, Fisheries and Food (Rahal 2005). The great majority of these horses are commonly identified as Barb and Arab-Barb. These two breeds are from the coastal regions of North Africa. They are generally used in the fantasia (tradi- tional exhibition of horsemanship in the Maghreb
performed during cultural festivals), as well as in the equestrian sports. There are an approximately of 10 000 heads belonging to the Barb breed and 80 000 Arab-Barb (Kadri 2006).
In 1886, the first Algerian studbook of the Barb
horse has been established. The Tunisian and Moroc-
can studbooks have followed in 1896 and 1914,
respectively (Kadri 2006). Currently, there is an inter-
national commitment to promote and preserve the
Barb breed. As well, Algeria created the World Orga-
nization of the Barb Horse OMCB in June 1987. This
organization counts today eight countries that are, in
addition to the countries of origin (Algeria, Morocco and Tunisia), France, Belgium, Germany, Switzerland and Luxembourg (Kadri 2006). The Arab-Barb is the predominant breed in Algeria. This breed is the crea- tion of Tiaret broodmares in 1877, by crossing between Barb and Arabian horses (Rahal 2005). The breed is raised to combine the hardiness, the endur- ance and the stamina of the Barb, to the elegance and the speed of the Arabian.
In addition to these two autochthonous breeds, we also distinguish Arabian breed, Thoroughbred and the French trotters, mainly used in equestrian sporting events of dressage and show jumping. For several dec- ades, these imported breeds distributed unevenly on the Algerian territory and they adapt the most in mountainous regions and arid territories of North Africa (Kadri 2006).
In animal breeding, genetic characterization is the first step in breed conservation and may have implica- tions for future breeding strategies and management plans. Among molecular markers, microsatellites are considered suitable for biodiversity evaluation, owing to their ubiquitous presence throughout the mamma- lian genome, codominant inheritance and high degree of polymorphism, and these markers have been suc- cessfully used in parentage and relatedness tests in horses (Bowling et al. 1997).
Genetic diversity within and among horse breeds around the world has been analysed by microsatellites, including the Spanish Celtic breeds (Ca~ non et al.
2000), Polish breeds (Zabek et al. 2005), Brazilian breeds (Lippi & Mortari 2003), Portuguese breeds (Lu ıs
et al. 2007), French breeds (Leroy et al. 2009) and Indian horse breeds (Behl et al. 2007). However, the genetic relationships of horse populations in Algeria have not been investigated using microsatellites.
This research is the first applying molecular markers to characterize the horse breeds in Algeria. The aim of this study was to (i) analyse the genetic diversity of five horse breeds raised in Algeria using a set of micro- satellite markers, (ii) determinate their genetic rela- tionship and (iii) characterize geographical and genetic differentiation between Barb and Arab-Barb breeds at different spatial sites in Algeria.
Materials and methods
Population samples and DNA isolation
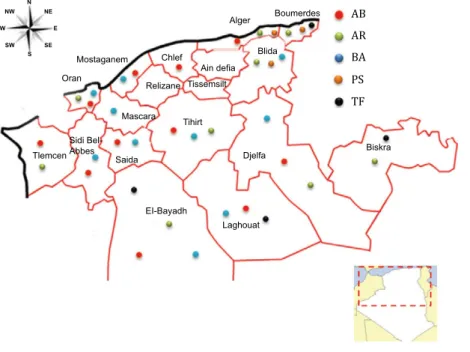
Blood samples from 201 animals were collected from five domesticated horse breeds from their respective areas of distribution (Figure 1). The breeds involved and their sample sizes were as follows: Arab-Barb (AB, N = 55), Arabian (AR, N = 57), Barb (BA, N = 41), Thoroughbred (PS, N = 22) and French Trot- ter (TF, N = 26). The individuals chosen were regis- tered in the breed’s studbook, and we avoided closely related animals. Approximately 10 ml of blood per animal was collected aseptically into EDTA (0.5 m
M, pH 8.0) coated vacutainers, and genomic DNA was extracted from whole blood following the salting out procedure (Miller et al. 1988). DNA samples of these animals were provided by the laboratory of genetics molecular and cellular, Oran, Algeria.
AB AR BA PS TF
Biskra
Laghouat Djelfa Tihirt
EI-Bayadh Saida
Mascara
Oran Relizane Tissemsilt
Chlef Mostaganem
N
E W
NW NE
SE SW
S
Ain defia Blida Alger Boumerdes
Tlemcen Sidi Bel- Abbes
Figure 1Geographical location of five horse breeds sampled in this study. Population abbreviations are found in Table 1.
Microsatellite markers
Fourteen microsatellite markers were selected for this study. These microsatellite markers have been recom- mended for individual identification and parentage verification of equines by the International Society for Animal Genetics (ISAG). The genotyping assays of mi- crosatellites were performed in LABOGENA Labora- tory, Paris, France.
Multiplex PCR conditions
In our study, we amplified fourteen microsatellites in two multiplex using fluorescently labelled primers.
The first multiplex MP1 included microsatellites AHT4, AHT5, ASB2, HMS1, HMS3, HMS6, HMS7, HTG4, and HTG6, HTG10, VHL20. And the second MP2 was composed of ASB17, ASB23, HMS2 and HTG10. The thermocycling conditions included an initial denatur- ation at 95 ° C for 15 min, followed by 30 cycles of 30 s at 94 ° C, 90 s at 58 ° C annealing temperature and 1 min at 72 ° C. A final elongation step was carried out at 60 ° C for 30 min. The amplified products were denatured with formamide, and PCR products were detected by capillary electrophoresis using an ABI Prism 3730 DNA Genetic Analyzer (Applied Biosys- tems, USA). Size analyses of DNA fragments separated were performed with
GENOTYPEsoftware Ver.3.7 (Applied Biosystems). The internal size standard GENESCAN-LIZ 500 (Applied Biosystems) was used for sizing alleles.
Computation and statistical analysis
Allelic frequencies and number of alleles per locus observed heterozygosity (H
O) and unbiased expected heterozygosity (H
e) were calculated across loci and populations using the
GENETIXsoftware version 4.04 (Belkhir et al. 2001). Representation of the genetic relationships among tested populations was per- formed using FCA approach (Lebart et al. 1984) as implemented by the same software. Wright F-statistics (F
IT, F
STand F
IS) and allelic richness (R
t) were calcu- lated for each locus and across the genome using
FSTAT2.9.3 (Goudet 2001). A hierarchical analysis of vari- ance was carried out using an analysis of molecular variance (
AMOVA) approach implemented in the soft- ware A
RLEQUINversion 3.01 package (Excoffier et al.
2005).
The Hardy – Weinberg equilibrium test (HWE) was performed with the
GENEPOP4.0 software (Raymond &
Rousset 1995) using exact tests and sequential Bon- ferroni correction. The gene flow value (N
m) was also
computed using the same software.
PHYLIP3.5 statisti- cal package (Felsenstein 1989) was used to calculate genetic distances and to obtain bootstrap procedures and trees. Bootstraps’ values were computed more than 1000 replicates, and S
PLITSTREE4.0 software (Huson & Bryant 2006) was used to visualize the dia- grams.
The genetic structure of the populations was analy- sed by Bayesian clustering methods developed by Prit- chard using the software
STRUCTURE2.1 (Pritchard et al.
2000). An admixture model and correlated allele fre- quency model were used to analyse the dataset with- out prior population information for K ranging from 2 to 10. The program was run 20 times independently, and each run consisted of 1 000 000 Markov chain Monte Carlo (MCMC) iterations, after a burnin period of 100 000 steps. Subsequently, an ad hoc quantity based on the second-order rate of change in the likeli- hood function with respect to K (K) was used for esti- mating the number of clusters from structure analysis (Evanno et al. 2005). S
TRUCTUREH
ARVESTERv.0.6.1 (Earl
& VonHoldt 2011) was used to process the structure result files, and a graphical bar plot of membership coefficients for populations and individuals was gen- erated using the D
ISTRUCTprogram (Rosenberg 2004).
To investigate an eventual spatial structure related to genetic differentiation considering, Barb, Arab- Barb and both breeds together, a principal component analysis (PCA) was performed on allele frequencies averaged by regions (see Figure 1). On the basis of value for axis 1 of the PCA, results were then interpo- lated spatially, directly and using a Kriging approach, using the R procedure described by Franc ßois (http://
membres-timc.imag.fr/Olivier.Francois/admix_display.
html). Overall spatial correlation of PCA axis 1 was quantified and tested using Moran’s I coefficient (Mo- ran 1950), connecting regions with a Gabriel neigh- bouring graph.
Results
Microsatellite markers
All the equine microsatellites loci reported in this study have been amplified successfully in all breeds.
A total number of 123 different alleles were detected
across the 14 loci analysed. The number of alleles per
locus (A
t) varied between 6 (HTG4) and 14 (ASB17)
with a mean of 8.78 alleles (see Table S1). Moreover,
the lower and higher values of allelic richness overall
samples per locus (R
t) were showed in HTG6 (4.47)
and ASB17 (9.72) loci, respectively, with a mean of
6.86.
The expected heterozygosity across the breeds var- ied from 0.669 (HMS1) to 0.853 (VLH20), while the observed heterozygosity across the breeds ranged from 0.568 (HTG6) to 0.839 (HTG10).
Values for the Wright’s F-statistics were determined after 10 000 permutations (see Table S1), and mul- tilocus F
STvalues indicate that around 5% of the total genetic variation was attributed to significant differ- ences between the horse breeds, with the remaining 95% corresponding to differences between individu- als. Genetic differentiation among breeds was highly significant (p < 0.01) for all loci. A significant excess of homozygotes across all breeds (p < 0.05) was found for HTG4 and ASB2 loci. On average, breeds had a 2.1% (p < 0.05) deficit of heterozygotes, whereas the total population had a 7% (p < 0.01) deficit of hetero- zygotes.
Genetic diversity within breeds
Parameters characterizing the polymorphism of all the horse breeds tested are listed in Table 1. The observed and expected heterozygosities per breed ranged from 0.72 (PS) to 0.752 (BA) and 0.71 (PS) to 0.77 (AB), respectively. The mean number of alleles MNA was the highest in the Arab-Barb horses (7.86) and lowest in the Thoroughbred breed (5.71). F
ISvalue within populations varied between 0.002 in the Barb and 0.057 in the Arab-Barb, although F
ISwas statistically significant only for Arab-Barb and Arabian breeds due to a deficiency of heterozygosity.
A total of 12 private alleles were identified in the present work, and most of the private alleles (eight) were at very low frequencies of below 2%. Three alleles unique to Barb horses and one to a Thorough- bred horse showed a frequency that exceeded 2%.
The HWE was tested for all breed-locus combina- tions. Significant (p < 0.05) deviations from a HWE were observed for 6 (8.6%) of 70 breed-locus
combinations. However, heterozygote deficiency analysis revealed that all the five populations exhib- ited significant deviation from HWE (p < 0.05) at many loci, The Arab-Barb horse showed the maxi- mum number of loci in disequilibrium (5 loci), fol- lowed by Thoroughbred (three loci).
Genetic variation and the relationship between Breeds
The
AMOVAtest revealed that the higher variation (92.99%) is within the individual, 2% among individ- uals within populations and 5% among populations.
All F
STvalues calculated by pairwise breed combi- nations using
FSTATand after 5000 permutations were significantly different from zero (p < 0.05). The high- est level of differentiation was observed between Ara- bian and French Trotter breeds (F
ST= 0.086) and the lowest one between Arab-Barb and Barb breeds (F
ST= 0.001) (Table 2). N
mrepresents the number of effective migrants exchanged per generation, Table 2 shows that the N
mvalues for pairs of breeds varied from 2.67 to 253.02 for the AR-TF pair and the AB- BA pair, respectively. However, the effective number of migrants per generation (N
m= 253.02) between the Barb-Arab-Barb pair was very high in comparison with the values for the other pairs of breeds.
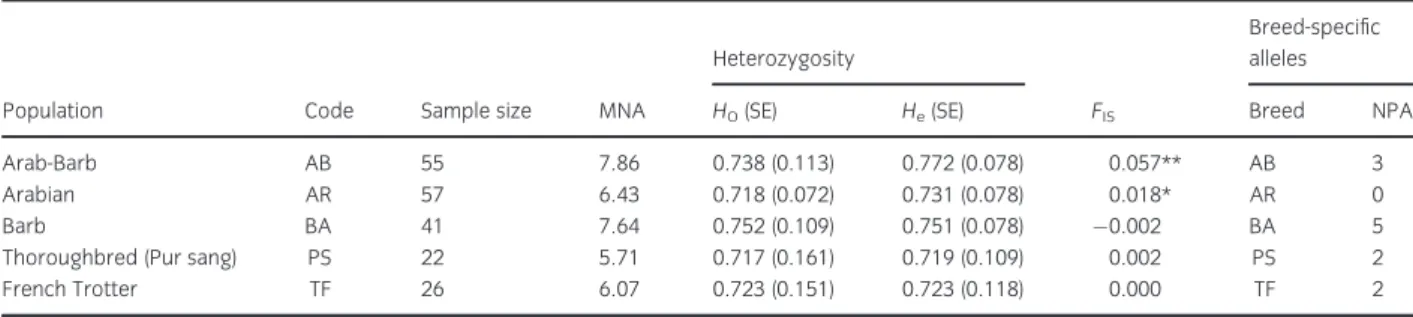
A neighbour-joining NJ tree was constructed on the basis of the D
Rgenetic distances with relatively high bootstrap values (Figure 2). The tree showed a clear subdivision of the breeds and two groups can be dis- tinguished. The first consisted of the AB and the BA identified with a high bootstrap value (98.8%), and the second identified with a bootstrap value of 91.8%
and was formed by PS and TF. The AR breed was identified between these two groups.
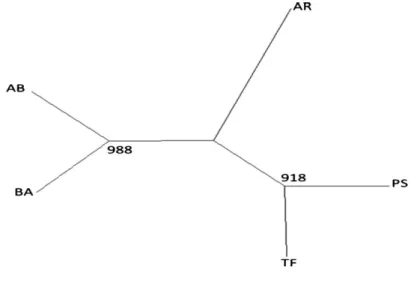
The factorial correspondence analysis FCA strongly confirmed the genetic distinctiveness of the five horse breeds. Results of the three-dimensional plot factorial correspondence analysis (Figure 3) clearly separated
Table 1Basic information and values for parameter of polymorphism observed for each breed on the five populations studied
Population Code Sample size MNA
Heterozygosity
FIS
Breed-specific alleles
HO(SE) He(SE) Breed NPA
Arab-Barb AB 55 7.86 0.738 (0.113) 0.772 (0.078) 0.057** AB 3
Arabian AR 57 6.43 0.718 (0.072) 0.731 (0.078) 0.018* AR 0
Barb BA 41 7.64 0.752 (0.109) 0.751 (0.078) 0.002 BA 5
Thoroughbred (Pur sang) PS 22 5.71 0.717 (0.161) 0.719 (0.109) 0.002 PS 2
French Trotter TF 26 6.07 0.723 (0.151) 0.723 (0.118) 0.000 TF 2
Ho, observed heterozygosity;He, expected heterozygosity; MNA, mean number of allele;FIS, heterozygote deficiency coefficient; NPA, number of private alleles; *p<0.05, **p<0.01.
the native populations from the other breeds. Simul- taneously, the Barb and Arab-Barb were clustered together.
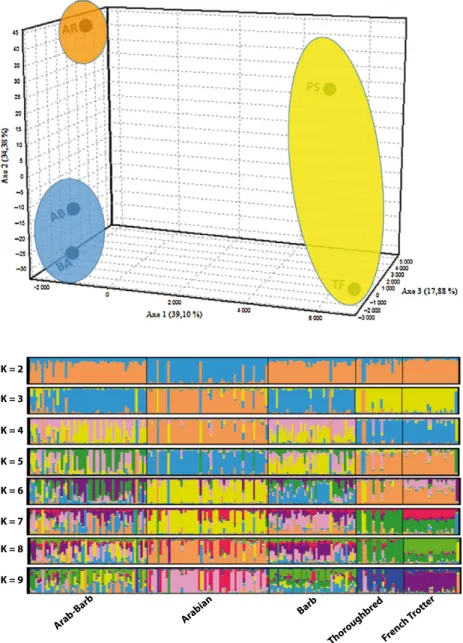
Bayesian clustering methods have proven to be powerful analytical tools for identifying genetic struc- ture in data sets, Evanno et al. (2005) method, which is based on the second-order rate of change in the likelihood function with respect to K (DK), showed a clear peak at K = 3. The Arabian (AR) breed was sepa- rated from the other populations after the first calcu- lation clusters (K = 2). The Arab-Barb (AB) and Barb (BA) breeds as well as the Thoroughbred (PS) and French Trotter (TF) breeds clustered together at K = 3, when considering larger K values, all breeds were separated into their own clusters (Figure 4), except for Barb and Arab-Barb.
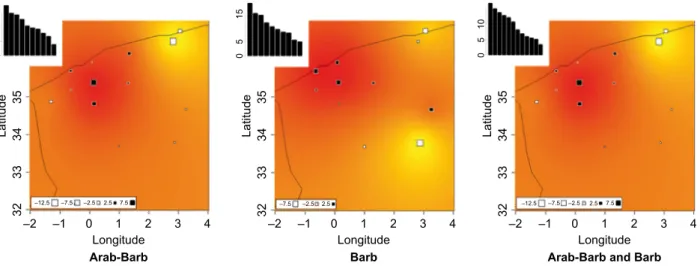
PCA and spatial interpolation of the results
First axis of PCA performed on allele frequencies explained 17.8%, 18.7% and 16.7% of total inertia when considering Arab-Barb, Barb and both breeds grouped, respectively. Results of spatial interpolation
based on first axis results are shown in Figure 5, indi- cating relative similarities between horses sampled Mascara, Saida and Tiaret (Tihirt). Note, however, that when computing spatial autocorrelation, Moran’s I index was found significantly different from 0 only when considering both breed together (p = 0.01), with a value of 0.34.
Discussion
In this paper, we carried out the first study applying molecular markers to characterize genetic variability of five horse breeds raised in Algeria. In addition, we resolved their genetic relationships, especially between autochthonous horse breeds Barb and Arab- Barb.
All loci evaluated in the present work considered highly informative. The heterozygosities for all loci analysed were lower than expected (exception HMS6), which could be attributed to within-popula- tion inbreeding or by population subdivision (Wahl- und’s effects) (Arora & Bhatia 2004). Rare alleles, with frequencies below 5%, were found in all the breeds, exception the Arabian (Table 2). We have also observed a relatively large number of breed- specific alleles in Barb and Arab-Barb breeds. It was interesting to observe that while in Barb breed, F
ISvalue was found non-significantly different from zero, in Arab-Barb breed, F
ISwas found significantly positive, which could be related to different breed- ing management methods in both breeds. Indeed, while in Barb breed, most of the stalions used are raised in one place (Haras national Tiaret), in Arab- Barb breed, mating is managed independently by breeders all over the country, which could have led to some Wahlund’s effects.
Table 2FSTestimates (below the diagonal) as a measure of genetic dis- tance between horse breeds and the number of effective migrants per generationNm(above the diagonal)
Breed AB AR BA PS TF
AB – 6.92 253.02 3.61 3.85
AR 0.035 – 4.89 3.23 2.67
BA 0.001 0.048 – 2.93 3.88
PS 0.065 0.072 0.078 – 4.08
TF 0.060 0.086 0.060 0.057 –
AB, Arab-Barb; AR, Arabian; BA, Barb; PS, Thoroughbred (Pur sang); TF, French Trotter.
Figure 2Neighbour-joining tree obtained from theDRdistance between the studied pop- ulations (1000 bootstrap).
Our results showed genetic differentiation for all but Barb/Arab-Barb pairs of breeds. The level of dif- ferences explained 5% of the total genetic variation, and all loci contribute to this differentiation with F
STvalues being moderately low and similar for all sys- tems studied, but very significant (p < 0.001). Our overall F
STvalue was similar to but slightly lower than the 6.5% reported by Behl et al. (2007) for five Indian horse breeds (Marwari, Spiti, Bhutia, Manipuri and Zanskari). However, it was smaller than those previ- ously found in Polish breeds (F
ST= 10%, Zabek et al.
2005), Brazilian breeds (F
ST= 11.7%, Lippi & Mortari 2003) and Norwegian breeds (F
ST= 12%, Bjørnstad et al. 2000). The difference here is probably related to the fact that those studies investigated breeds from
different origins (race/riding horse, heavy horses, ponies . . . ), while here, all breeds analysed were all race horses explaining the lower F
STvalue.
All five populations (Arab-Barb, Arabian, Barb, Thoroughbred and French Trotter) had high heterozy- gosity values (0.77, 0.73, 0.75, 0.71 and 0.72, respec- tively). These values are among the highest heterozygosity values reported for other horse popu- lations (Lu ıs et al. 2007; Leroy et al. 2009; Khanshour et al. 2013), although these values are not directly comparable with these studies because of differences in the microsatellite sets used.
The divergence between the studied horse breeds was evaluated using different approaches (genetic dis- tances, factorial correspondence analysis FCA and
Figure 3Factorial correspondence analysis of the 14 microsatellite loci analysed in the five horse breeds. Each individual was plotted into three-dimensional plot. Axis 1 accounts for 39.10% of the variation.
K = 2 K = 3 K = 4 K = 5 K = 6 K = 7 K = 8 K = 9
Arab-Barb Barb
Thor oughbr
ed
French T rotter
Arabian Figure 4Proportion of membership 201 indi-
viduals from Arab-Barb, Arabian, Barb, Thor- oughbred and French Trotter horses.
clustering methods). All these three classical estimates based on genetic relationships gave similar results.
There is a genetic differentiation between Algerian autochthonous horses and other breeds.
The neighbour-joining tree (D
R) showed a clear subdivision of the breeds, and Arab-Barb horse was more closely related to Barb Breed than the Arabian (Figure 2). Thoroughbred and French trotter breeds are clearly separated from the autochthonous breeds, and the Arabian horses assumed an intermediate posi- tion. This result could be explained by some influence from Arabian breed in the original breed formation in more recent years. The genetic proximity of both autochthonous breeds BA and AB was also demon- strated using the FCA and the Bayesian clustering approach, which gives more precise information on breed relationships. However, our estimates for the native breeds (BA and AB) are similar to this reported by Ouragh et al. (1994), pointed out using biochemi- cal polymorphisms.
Spatial interpolation may indicate some genetic dif- ferentiation related with geographical origins, even if those results should be taken with caution, as (i) Mo- ran’s index was found significantly different from 0, only when considering Barb and Arab-Barb together, and (ii) first PCA’s axis explained only <20% of total inertia. A larger sampling considering the number of horses and markers used could provide more precise data on this question.
Conclusion
Summarizing the information above, we can conclude the genetic differentiation between Algerian autoch-
thonous horses and other breeds. The BA and AB breeds appeared to be genetically related and consid- ered as the same population. If these two breeds do not seem to show real differentiation based on micro- satellite markers, which can be related to continuous gene flows between both populations, the different in genetic structure within both breeds may be eventu- ally related to contrasted management methods. The data and information found here represent a preli- minary to accomplish the genetic characterization of Algerian horse breeds.
Acknowledgements
We would like to thank the partners who have pro- vided samples: the Haras National CHAOUCHAOUA of Tiaret and the National Office of the Development of Equine and Camel Livestock (ONDEEC), and we thank Mr. Benabdelmoumene S., Dr. Rahal K, Dr.
Bouziane Z., Dr. K ebali A., Pr. Aumassip Kadri G. for their kind collaboration. We further acknowledge the staff of Labogena laboratory INRA – Jouy en Josas for their expert help in the genetic typing of horses.
References
Arora R., Bhatia S. (2004) Genetic structure of Muzzafarn- agri sheep based on microsatellite analysis. Small Rumin.
Res.,
54, 227
–230.
Behl R., Behl J., Gupta N., Gupta S.C. (2007) Genetic rela- tionships of five Indian horse breeds using microsatellite markers. Animal,
1, 483
–488.
Belkhir K., Borsa P., Chikhi L., Raufaste N., Bonhomme F.
(2001) GENETIX 4.04, Logiciel sous Windows TM pour
32–2 –1 0 1 2 3 4 –2 –1 0 1 2 3 4 –2
–12.5 –7.5 –2.5 2.5 7.5
–1 0 1 2 3 4
333435
0515 0515 0510
Latitude
Longitude
Arab-Barb Barb Arab-Barb and Barb
Longitude Longitude
32333435Latitude 32333435Latitude
–7.5 –2.5 2.5 –12.5 –7.5 –2.5 2.5 7.5
Figure 5Geographical interpolation of principal component analysis (PCA) results for axis 1, considering Arab-Barb and Barb breeds independently or grouped (for each graph, eigenvalues for the 10 first axis are indicated).