Contents lists available atScienceDirect
Small Ruminant Research
journal homepage:www.elsevier.com/locate/smallrumres
Genetic characterization of four Algerian goat breeds assessed by
microsatellite markers
Hakim Te
fiel
a,b,⁎, Nezih Ata
c, Mohamed Chahbar
d, Mohamed Benyarou
e, Khaled Fantazi
f,
Onur Yilmaz
c, Ibrahim Cemal
c, Orhan Karaca
c, Dalila Boudouma
d, Semir Bechir Suheil Gaouar
eaNational High School of Veterinary, Oued Smar, Algiers, Algeria
bDepartment of Agronomic Sciences, Institute of Exact Sciences and Sciences of Nature and Life, University Centre Ahmed Zabana, Relizane, Algeria cDepartment of Animal Science, Faculty of Agriculture, Adnan Menderes University, Aydın, Turkey
dNational High School of Agronomie, EL Harrach, Algiers, Algeria ePpBioNut Laboratory, University Abou Bekr Bélkaid, Tlemcen, Algeria
fNational Institute of Agronomic Research, Animal Productions Division, INRA Algeria, BP200 Hassen Badi, El-Harrach 16200, Algiers, Algeria
A R T I C L E I N F O
Keywords: Genetic diversity
Native Algerian goats breeds Microsatellites
Population genetic structure
A B S T R A C T
Genetic characterization and diversity of local goat breeds (Naine de Kabylie, Arbia, Mekatia, and M’zabite) raised in Algeria (n = 224) were investigated by eighteen microsatellite markers recommended by FAO (2011). A total of 450 alleles were detected in this study. The mean values of polymorphic information content, observed heterozygosity and expected heterozygosity were 0.93, 0.84, 0.94, respectively. The mean number of alleles per population ranged from 12.94 (M’zabite) to 16.39 (Arbia). The highest values of FIS, FST and FIT known as Wright F-statistics were 0.179, 0.087 and 0.219, respectively. Although a total of 118 private alleles was ob-served in this study, only frequency of six allele in M’zabite goat breed was greater than 5%. Mekatia and Arbia goat populations were genetically closest to each other according to dendrogram. Obtained GST value from the present study indicated that 4.00% of total genetic variation resulted from the differences between the breeds. This study indicates that the four studied Algerian native goat breeds are classified into distinct breeds with a good level of genetic diversity. Indeed, our results showed that the used microsatellite markers were adequately polymorphic and that they can be successfully used to investigate genetic diversity in Algerian goat populations.
1. Introduction
As in most countries of the Mediterranean region, the Goat (Capra hircus) is considered the most prolific ruminant among all domesticated ruminants especially under harsh climatic conditions. This is due to their ability of adapting to different environmental conditions, nutri-tionalfluctuations, disease resistance and capacity to survive under low input systems (Serrano et al., 2009).
In Algeria native goat breeds, play a major role in using resources available under extensive production systems and marginal areas and thus contributing for environmental and socio-economic stability. In Algeria, there are approximately 4 million goats that are a source of income for about 800.000 small farmers. Goats are in second place with 13 percent of which does comprise half. Algeria located in north-west of African continent has a significant traditional background for goat breeding. Average annual milk production during the past decade has been about a billion liters of which 60% are from cows, 26% from ewes and 13% from goats (Nedjraoui, 2006). Arbia (AR), Mekatia (ME),
M'zabite (MO) and Naine de kabylie (NK) which are native goat breeds of Algeria are important for milk quality and meat yield (Table 1). In-digenous breeds, which are the basic elements of animal breeding, have adapted very well to the ecological, sociological and economic condi-tions of different geographies. Culture breeds or crosses replace native breeds due to changing consumer habits, economic expectations of farmers and desire to work with highly productive animals that can respond to the demands of the growing population (Criscione et al., 2016). Variation, which is a fundamental characteristic of biological systems, is significantly reduce due to many factors such as species, breed or gene loss. The conservation of animal genetic resources is becoming an increasingly important issue in the world.
The inbreeding levels, genetic diversity and admixture in popula-tions should be clearly addressed in conservation and breeding pro-grams to be constructed. Microsatellites markers are very important and efficient tools for genetic diversity analysis because of their high degree of polymorphism, random distribution across the genome, co-dom-inance, possibility of automated scoring of genotypes and neutrality
https://doi.org/10.1016/j.smallrumres.2018.01.021
Received 31 May 2017; Received in revised form 28 December 2017; Accepted 29 January 2018
⁎Corresponding author at: Department of Agronomic Sciences, Institute of Exact Sciences and Sciences of Nature and Life, University Centre Ahmed Zabana, Relizane, Algeria.
E-mail addresses:h.tefiel@ensv.dz,hakimtefiel@yahoo.fr(H. Tefiel).
Available online 31 January 2018
0921-4488/ © 2018 Elsevier B.V. All rights reserved.
with the selection (Ligda et al., 2009). Due to the fact that there is an increasing interest in the genetic characterization by microsatellites markers, several studies are conducted in Algerian farm animals such as sheep (Gaouar et al., 2005;Gaouar et al., 2012;Gaouar et al., 2014; Gaouar et al., 2015a,b;Gaouar et al., 2017;Djaout et al., 2017;Ayachi et al., 2017;Ameur Ameur et al., 2017), camels (Cherifi et al., 2013; Harek et al., 2015; Cherifi et al., 2017; Holl et al., 2017), chickens (Mahammi et al., 2014; Mahammi et al., 2016) and horses (Berber et al., 2014). But until today genetic diversity studies have not been conducted on the Algerian goat populations.
It could be considered that the introduction of foreign goat breeds such as Saanen, Alpine and Chami goat breeds into the country in re-cent years may lead to the loss of some important characteristics of Algerian native goat breeds. Identification of the genetic diversity po-pulation is the most fundamental step in conserving and using biolo-gical diversity (Iamartino et al., 2005). Because of the absence of stu-dies that demonstrate genetic diversity in the goats, the realization of this study has met an important information need. The aim of presented study is investigate genetic diversity and population structure of four goat breeds from Algeria by using 18 microsatellite markers.
2. Materials and methods
2.1. Breeds, sampling strategy and DNA extraction
Animal material for the study consisted of a total of 224 animals belonging to four local goat breeds raised in Algeria (Table 1). Samples from the breeds were collected from unrelated animals and different regions (Fig. 1). Blood samples were collected from the jugular veins of the animal material using vacutainer tube containing K3EDTA. Genomic DNA was extracted from blood samples according to the salting out protocol (Miller et al., 1988). Afterward, quantification and qualification of DNA were controlled using NanoDrop 2000 (Thermo
Scientific, USA).
2.2. PCR and fragment analysis
Eighteen microsatellites markers were used according to re-commendation ofFAO (2011). Three multiplex groups were created according to fragment length of microsatellites (Table 2). Polymerase chain reaction (PCR) amplifications were carried out in 25-μL total volumes, containing 0.10μM of primers (forward and reverse), 0.20 mM dNTPs, 2.0 mM MgCl2, 1X PCR buffer, 1U of Taq DNA poly-merase, and∼50 ng of DNA. Touchdown PCR protocols was used for amplification of specific genomic regions (Table 3). Capillary electro-phoresis was used for the separation of the PCR fragments labeled with fluorescent dye in the Beckman Coulter GeXP genetic analyzer (Beckman Coulter, Inc., USA). Genome Lab™ DNA Size Standard Kit 400 was used for the determination of the fragment size.
2.3. Statistical analysis
Number of alleles per locus (Na), mean number of alleles (MNa), effective number of alleles (Ne), polymorphic information content (PIC), observed heterozygosity (Ho), expected heterozygosity (He), average heterozygosity (Ĥ), Hardy–Weinberg equilibrium, Wright’s F-statistics (FIT, FIS, FST) (Wright, 1931;Weir and Cockerham, 1984) and null allele frequencies were calculated using GenAlEx (Peakall and Smouse, 2006, 2012), POPGENE (Yeh et al., 1997) and CERVUS 3.0.3 (Marshall, 2006; Kalinowski et al., 2007). The genetic distance den-drogram for the breed was drawn with Population 1.2.31 (Langella, 1999) and FigTree 1.4.2. (Rambaut and Drummond, 2015) software according to Nei’s minimum genetic distance matrix (Nei, 1972), the bootstrap resampling methodology (1000 replicates) was performed to test the robustness of the dendrogram topology. Nei’s gene diversity (HT), diversity between breeds (DST), and coefficient of gene
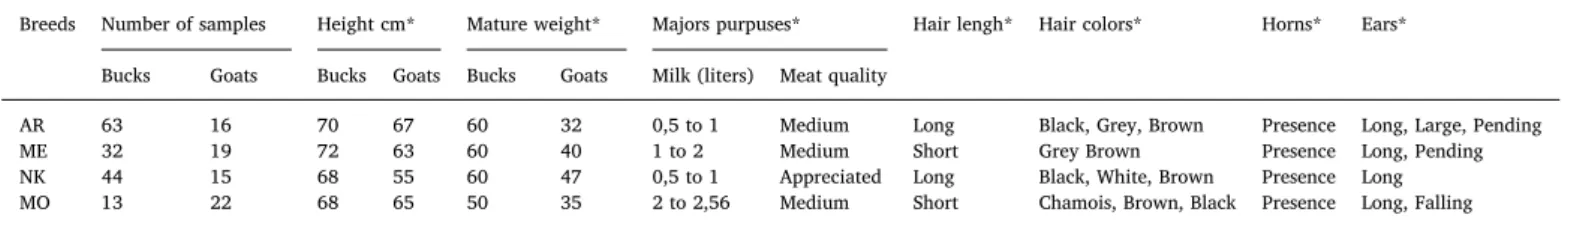
Table 1
Sample size and main characteristics (Kerba, 1995) of four goat breeds raised in Algeria.
Breeds Number of samples Height cm* Mature weight* Majors purpuses* Hair lengh* Hair colors* Horns* Ears* Bucks Goats Bucks Goats Bucks Goats Milk (liters) Meat quality
AR 63 16 70 67 60 32 0,5 to 1 Medium Long Black, Grey, Brown Presence Long, Large, Pending ME 32 19 72 63 60 40 1 to 2 Medium Short Grey Brown Presence Long, Pending NK 44 15 68 55 60 47 0,5 to 1 Appreciated Long Black, White, Brown Presence Long MO 13 22 68 65 50 35 2 to 2,56 Medium Short Chamois, Brown, Black Presence Long, Falling AR: Arbia, ME: Mekatia, NK: Naine de Kabylie, MO: M’zabite *Kerba (1995).
differentiation (GST) values were calculated with FSTAT 2.9.3 (Goudet, 2001). Factorial correspondence analysis was performed to test the possible admixtures that occurred between the populations using the “AFC populations” program of the GENETIX v 4.05 software (Belkhir et al., 2001). The population structures were analyzed by cluster techniques based on the Bayesian approach, using the STRUCTURE (Pritchard et al., 2000;Falush et al., 2003, 2007;Hubisz et al., 2009). Analysis was performed with a burn of 20.000 in length, followed by 100.000 Markov chain Monte Carlo iterations for each from K = 2–4, with 20 replicate runs for each K, using independent allele frequencies and an admixture model. Evanno’s method (Evanno et al., 2005) was used to identify the appropriate number of clusters usingΔK, based on the rate of change in the log probability of the data. The optimal K values were selected by means of STRUCTURE HARVESTER (Earl and Vonholdt, 2012).
3. Results
Molecular genetic polymorphism statistics were given inTable 4. A total of 450 alleles were detected across the eighteen loci investigated in the present study. The highest number of allele (Na), effective allele
(Ne) and polymorphic information content (PIC) were observed in INRA063 locus. Expected heterozygosity (He) value ranged between 0.91 (ILTS0087) to 0.96 (INRA063). Observed heterozygosity (Ho) values varied from 0.76 (BM1329) and 0.96 (INRA0023), respectively. PIC values were found to be between 0.91 (ILTS0087) and 0.96 (INRA063). All the markers used in the present study were highly in-formative with a high (0.93) PIC value. Global means of FIS, FIT and FST, which are important molecular genetic parameters, were 0.057, 0.102 and 0.048, respectively. The highest FIS, FIT and FST values were 0.179 (INRA063), to 0.219 (INRA063) and 0.087 (SRCSRP0023), re-spectively. The mean value of between-breed diversity value (DST), coefficient of gene diversity (GST) and Nei gene diversity (HT), were determined as 0.038, 0.040, and 0.941, respectively. Goat breeds stu-died showed a significant deviation from the Hardy- Weinberg equili-brium (HWE) for all eighteen loci. The null allele frequencies in the studied microsatellite loci were below 20%. Calculated geneflow (Nm, number of migrants per generation) value in the present study was considerably high (6.439).
Genetic diversityfindings according to breeds were given inTable 5. The highest and lowest number of allele were seen in AR (16.39) and MO (12.94) goat breeds. It has been determined that some of the
Table 2
Details of considered microsatellite loci. (FAO, 2011).
Multiplex Group Primer Name Label Primer sequence Chromosomal number Allelic range (bp)
M1 INRA0023 D3 GAGTAGAGCTACAAGATAAACTTC 195–225 TAACTACAGGGTGTTAGATGAACTC INRA0005 D3 CAATCTGCATGAAGTATAAATAT 10 135–149 CTTCAGGCATACCCTACACC OarFCB20 D2 AATGTGTTTAAGATTCCATACAGTG 2 93–112 GGAAAACCCCCATATATACCTATAC ILST0019 D2 AGGGACCTCATGTAGAAGC 144–158 ACTTTTGGACCCTGTAGTGC BM1818 D4 AGCTGGGAATATAACCAAAGG 20 248–278 AGTGCTTTCAAGGTCCATGC INRA0132 D4 AACATTTCAGCTGATGGTGGC 20 152–172 TTCTGTTTTGAGTGGTAAGCTG M2 CSRD0247 D3 GGACTTGCCAGAACTCTGCAAT 14 220–247 CACTGTGGTTTGTATTAGTCAGG McM0527 D3 GTCCATTGCCTCAAATCAATTC 5 165–187 AAACCACTTGACTACTCCCCAA SRCRSP0005 D4 GGACTCTACCAACTGAGCTACAAG 158–180 TGAAATGAAGCTAAAGCAATGC ILSTS0087 D4 AGCAGACATGATGACTCAGC 137–155 CTGCCTCTTTTCTTGAGAG SRCRSP0023 D4 TGAACGGGTAAAGATGTG 85–123 TGTTTTTAATGGCTGAGTAG HSC (OLADRB) D2 CTGCCAATGCAGAGACACAAGA 20 267–301 GTCTGTCTCCTGTCTTGTCATC BM1329 D2 TTGTTTAGGCAAGTCCAAAGTC 6 160–182 AACACCGCAGCTTCATCC M3 INRA063 D3 GACCACAAAGGGATTTGCACAAGC 14 164–186 AAACCACAGAAATGCTTGGAAG MAF0065 D4 AAGGCCAGAGTATGCAATTAGGAG 15 123–157 CCACTCCTCCTGAGAATATAACATG SRCRSP0008 D2 TGCGGTCTGGTTCTGATTTCAC 209–235 CCTGCATGAGAAAGTCGATGCTTAG SRCRSP0024 D2 AGCAAGAAGTGTCCACTGACAG 139–175 TCTAGGTCCATCTGTGTTATTGC BM1258 D2 GTATGTATTTTTCCCACCCTGC 20 100− 128 GAGTCAGACATGACTGAGCCTG Table 3
Touch down PCR protocol used in the study.
Multiplex Group First Denaturation Denaturation Annealing Extension Cycle Final Extention M1 95 °C (5 min) 95 °C (40 s) 60–50 °C (40 s) 72 °C (1 min) 30 72 °C (10 min) M2 95 °C (5 min) 95 °C (40 s) 60–50 °C (40 s) 72 °C (1 min) 30 72 °C (10 min) M3 95 °C (5 min) 95 °C (40 s) 63–50 °C (40 s) 72 °C (60 s) 30 72 °C (10 min)
studied loci in the ME (16), MO (5), AR (16) and NK (16) are not in the Hardy-Weinberg equilibrium. The FIS values, which are an important parameter in defining the population structure and indicating the loss of heterozygosity, varied from 0.023 (NK) to 0.085 (ME). Although a total of 118 private alleles have been identified in four goat breeds studied, only seventy-five of them have a frequency greater than 5%. The highest number of private alleles having a frequency greater than 5%, was observed in Naine de Kabylie (NK) goat breed. Unbiased Nei's genetic identity and genetic distance matrix and dendrogram obtained from present study was given inTable 6andFig. 2. The genetic identity
and distance matrix showed that the highest and lowest genetic identity were found between AR and MO breeds (0.587) and NK and ME breeds (0.378), respectively. Factorial correspondence analysis graphic (FCA) given inFig. 3. It seemed that these populations was separate from each other.
The number of subpopulations (K) in the overall of the analyzed Algerian goat breeds samples was assessed by Bayesian approach im-plemented by STRUCTURE software. These analyses were performed without using prior population information, byfixing prior values of K = 2–4, and comparing the Ln likelihood of the data. The results of the STRUCTURE analyze containing different numbers of clustering and performed to determine the population structure of the studied breeds are given inFig. 4. The suitable cluster number (K) in structure analysis results according to Evanno’s method (Evanno et al., 2005) were given inTable 7.
4. Discussion
In Algeria, information on goat resources is scarce, which does not contribute to the molecular genetic characterization of different local goat breeds. For this reason the molecular genetic identification of goat populations has become very important phenomena in Algeria.
Barker et al. (2001)reported that markers used in genetic diversity studies should have at least 4 alleles. In this context, it is seen that the allele numbers obtained from microsatellites are reasonably high. The total number of alleles were higher than previous research conducted in West African goat breeds (Missohou et al., 2011), Turkish goat breeds (Agaoglu and Ertugrul, 2012), Retinta Extremena goat (Parejo et al., 2015) and Gaddi goat breed of Western Himalayas (Singh et al., 2015). The observed high mean heterozygosity and the mean alleles per locus supported high genetic variability in Algerian goat populations studied. Obtained molecular genetic parameters such as mean number of allele, effective allele, polymorphic information content, observed and expected heterozygosity were higher than the previous studies (Ouafi et al., 2002;Fatima, 2004;Kumar et al., 2005;Gour et al., 2006;Afroz et al., 2010;Dixit et al., 2010;Dixit et al., 2011;Missohou et al., 2011; Agaoglu and Ertugrul, 2012;Dixit et al., 2012;Mahrous et al., 2013; Bosman et al., 2015;Radhika et al., 2015;Singh et al., 2015). The mean number of alleles and polymorphic information content is a reasonable indicator of genetic variation within populations (Botstein et al., 1980;
Table 4
Genetic polymorphism parameters of the eighteen investigated loci in NK, AR, ME and MO goat breeds.
Loci N Allelic range (bp) Na Ne PIC FIS* FIT* FST* Ho He Ĥ HWE F(Null) DST GST HT Nm
INRA0023 224 191–231 21 14.18 0.93 −0.061 −0.039 0.021 0.96 0.93 0.91 *** −0.0167 0.013 0.014 0.932 11.77 INRA005 223 120–186 33 18.51 0.94 0.065 0.112 0.050 0.85 0.95 0.90 *** 0.0515 0.041 0.043 0.952 4.71 OARFCB20 224 73–123 26 13.67 0.92 −0.042 −0.010 0.031 0.93 0.93 0.90 *** −0.0016 0.022 0.024 0.927 7.88 ILTS0019 223 124–170 21 13.09 0.92 0.014 0.039 0.026 0.89 0.92 0.90 *** 0.0165 0.017 0.019 0.923 9.26 BM1818 220 240–298 26 15.43 0.93 0.092 0.149 0.062 0.80 0.94 0.88 *** 0.0778 0.051 0.054 0.940 3.78 INRA0132 215 130–190 28 19.37 0.95 0.021 0.041 0.020 0.91 0.95 0.93 *** 0.0217 0.012 0.013 0.950 11.97 CSRD0247 215 96–138 22 16.38 0.94 0.098 0.173 0.083 0.79 0.94 0.86 *** 0.0887 0.071 0.075 0.941 2.76 McM0527 218 147–213 28 18.69 0.94 0.098 0.148 0.055 0.81 0.95 0.90 *** 0.0793 0.045 0.047 0.951 4.26 SRCSRP005 220 148–208 27 18.68 0.94 0.075 0.124 0.054 0.82 0.95 0.90 *** 0.0696 0.044 0.046 0.949 4.39 ILTS0087 220 127–159 17 11.60 0.91 0.031 0.065 0.034 0.87 0.91 0.88 *** 0.0257 0.025 0.027 0.914 7.01 SRCSRP0023 215 83–133 24 15.79 0.93 0.064 0.146 0.087 0.80 0.94 0.86 *** 0.0774 0.074 0.079 0.940 2.63 HSC 219 261–309 24 19.28 0.95 0.060 0.126 0.070 0.83 0.95 0.88 *** 0.0653 0.059 0.062 0.949 3.34 BM1329 222 148–188 20 13.84 0.92 0.123 0.187 0.073 0.76 0.93 0.86 *** 0.1009 0.060 0.065 0.930 3.19 INRA063 220 141–217 35 24.84 0.96 0.179 0.219 0.049 0.76 0.96 0.91 *** 0.1168 0.039 0.040 0.964 4.85 MAF0065 215 111–205 27 13.89 0.92 0.058 0.128 0.075 0.79 0.93 0.86 *** 0.0794 0.062 0.067 0.927 3.08 SRCRSP0008 214 201–259 24 17.67 0.94 0.056 0.073 0.018 0.88 0.94 0.93 *** 0.0354 0.009 0.010 0.946 13.66 SRCRSP0024 216 129–179 26 18.54 0.94 0.072 0.093 0.023 0.86 0.95 0.92 *** 0.0477 0.014 0.015 0.948 10.73 BM1258 211 94–134 21 17.72 0.94 0.023 0.058 0.036 0.88 0.94 0.91 *** 0.034 0.027 0.029 0.946 6.62 Mean 25 16.73 0.93 0.057 0.102 0.048 0.84 0.94 0.89 0.038 0.040 0.941 6.439 Na: number of alleles, Ne: effective number of alleles, PIC: polymorphic information content, FIT, FIS, FST: Wright’s F-statistics, *Wright's statistics according to Weir and
Cockerham.1984,Ho: observed heterozygosity, He: expected heterozygosity,Ĥ: average heterozygosity, HWE: Hardy-Weinberg Equilibrium * P < .05, ** P < .01, *** P < .001, F (Null): null allele frequency, DST: the diversity between breeds, GST: coefficient of gene differentiation, HT: Nei’s gene diversity, and Nm: gene flow estimated (Nm = 0.25(1- FST)/FST
(Nei. 1987)
Table 5
Genetic polymorphism parameters according to studied goat breeds across 18 loci. Breeds MNA Mean
Heterozigosity
FIS HWE NPA
Ho (SE) He (SE) Freq. ≥5% Freq. < %5 Total ME 14.00 0.82 (0.030) 0.89 (0.010) 0.085 16 17 9 26 MO 12.94 0.83 (0.022) 0.88 (0.008) 0.077 5 13 6 19 AR 16.39 0.83 (0.015) 0.90 (0.006) 0.082 16 13 17 30 NK 16.06 0.89 (0.013) 0.90 (0.006) 0.023 16 32 11 43
ME: Mekatia, NK: Naine de kabylie, AR: Arbia, MO: M’zabite, MNA: Mean number of alleles, Ho: mean observed heterozygosity, He: mean expected heterozygosity, FIS:
within-breed heterozygote deficiency, HWE: number of loci not in the Hardy- Weinberg equili-brium (P < .05), NPA: number of private alleles.
Table 6
Unbiased Nei's genetic identity (above diagonal) and genetic distance (below diagonal) matrix. Pop ME MO AR NK ME *** 0.465 0.507 0.378 MO 0.765 *** 0.587 0.464 AR 0.680 0.533 *** 0.463 NK 0.973 0.769 0.769 ***
Kumar et al., 2009).
The overall values of FIS, FIT and FST which known as Wright F statistics was considerably lower than the numerous goat breeds such as Jamunapari goat (Gour et al., 2006), Marwari goat breed (Kumar et al., 2005) and Egyptian and Saudi native goat breeds (Mahrous et al., 2013). The differences between the previous literature and the present study were mainly due to non-comparative aspects such as studied microsatellite and breed differences.
FIS is a measure of the deviation of genotypic frequencies from panmictic frequencies in terms of heterozygous deficiency or excess. Negative FIS values indicate heterozygote excess and positive values indicate heterozygote deficiency compared with Hardy-Weinberg equilibrium expectations (Hedrick, 2000). The heterozygous excess was observed in only two loci which have negative value even if they are close to zero in the present study. This value was higher than studies earlier (Glowatzki-Mullis et al., 2008; Agaoglu and Ertugrul, 2012; Bosman et al., 2015; Parejo et al., 2015). Obtained FIT values was higher than studies conducted on South African dairy goats (Bosman
et al., 2015), and Retinta Extremena goats (Parejo et al., 2015). It was reported byFrankham et al. (2002)that the values of FST between 0.05 and 0.3 are typical for differentiation of livestock breeds, even smaller values may be important. In general, it can be said that the values obtained for the FST are within reported range byFrankham et al. (2002). Obtained FST values were lower than Egyptian (Agha et al., 2008), Gudarrama (Serrano et al., 2009) and Malaysian (Amie Marini et al., 2014) goat breeds.
The global mean of the genetic diversity value (DST) indicated that the low diversity among population studied. Nei gene diversity values (HT) was considerably higher than the numerous studies (Kumar et al., 2005;Gour et al., 2006).
The average GST value obtained from overall loci pointed out that 4% of total genetic variation resulted from the differences between the populations. In all other respects, it can be said that 96% genetic var-iation is caused by the difference between individuals. All studied loci showed a significant deviation from the Hardy-Weinberg Equation. These results may have occurred as a result of some breeding activities
Fig. 2. Dendrogram based on Nei’s minimum genetic distances among four breeds (bootstrap resampling methodology (1000 replicates).
for many years to improve the populations studied. Null allele fre-quencies were lower than the reported value by Dakin and Avise (2004). These results indicated that the microsatellite markers studied may be safely used in genetic diversity studies in Algerian goat breeds. It was noticed that the gene flow value in the present study was considerably higher than the Chinese and Saanen goat breeds (Kim et al., 2002) whereas it was lower than reported value in Greek sheep (Ligda et al., 2009) and Kerala goats (Radhika et al., 2015).
Arbia (AR) and Naine de Kabylie (NK) goat breeds were the highest value in terms of expected heterozygosity values. Mean number of al-leles (MNA), observed (Ho) and expected (He) heterozygosity values according to breeds were higher than Iranian goat breeds (Mahmoudi et al., 2014), Gaddi goat (Singh et al., 2015), Bangladesh goat popu-lation (Afroz et al., 2010) and Saanen and Alpine (Iamartino et al., 2005). These results show that these microsatellites used in Algerian sheep breeds in the present study provide a very high level of in-formation.
The Hardy-Weinberg Equation (HWE) results may have occurred as a result of a management program such as controlled mating, some breeding activities for many years to improve the populations studied as reported byMekuriaw et al. (2016). On the other hand, since a high number of alleles obtained from present study lead to a large number of combinations of genotypes, the studied locus deviated from HWE.
FIS values obtained from the breeds was higher than the values reported in some Turkish goat breeds (Gurler and Bozkaya, 2013), Muzhake goat breed (Hykaj et al., 2012). FIS values obtained according to breeds studied indicated loss of heterozygosity. The differences be-tween the previous literature and the present study were mainly due to non-comparative aspects such as used marker and breed differences. Obtained number of private allele was reasonably higher than some of goat breeds such as Swiss Toggenburg (Glowatzki-Mullis et al., 2008), South African dairy goats (Bosman et al., 2015).
The genetic identity and distance matrix indicated that Arbia and M’zabite breeds were genetically close, but the Naine de kabylie and Mekatia breeds were more distant. The dendrogram, constructed
followingNei (1972) minimum distances and NJ (Neighbor Joining) method in the present study, indicated that the Mekatia and Arbia breeds were grouped in the same cluster, but the M’zabite and Naine de Kabylie goat population were located in a separate cluster. M’zabite and Arbian goat breeds are raised in close regions each other, whereas Naine de Kabylie goat breed are raised in relatively remote areas from these breeds. When Factorial correspondence analysis graphic (FCA) (Fig. 3) has been examined, it’s mentioned that the individuals in ME, MO, AR and NK goat populations constitute a group between each other.
The STRUCTURE results obtained from structure analysis have been similar to the dendrogram given inFig. 2.ΔK value indicated that the most suitable group number was 4 (K = 4) in the four breeds of Al-gerian goat breeds studied. The obtained results from population structure analysis revealed that breeds studied are completely separated and shown no genetic admixture. It seen that population structure analysis and factorial correspondence analysis (FCA) results were in agreement with dendrogram.
5. Conclusion
African continent especially Algeria has a significant traditional background for goat breeding. Goats are in second place with 13 per-cent of which does comprise half. The results of present study are suggesting that the Algerian native goat breeds had considerable high amount of genetic diversity at eighteen loci studied. These results ob-tained from the molecular characterization using 18 microsatellite markers in Algerian goat breeds indicated that microsatellites used in the present study have a high confidence to reveal genetic diversity for these breeds.
It concludes that the four Algerian native goat breeds studied are classified into distinct breeds with a good level of genetic diversity. Moreover, this data provided important information for conservation programs and could be used to define breeding strategies.
Conflict of interest
The authors declare that they have no conflict of interest. Acknowledgments
We acknowledge Adnan Menderes University Agricultural Biotechnology and Food Safety Application and Research Center (ADU-TARBİYOMER) for providing laboratory facilities for molecular genetics analyses.
References
Afroz, M.F., Faruque, M.O., Husain, S.S., Han, J.L., Paul, B., 2010. Genetic variation and relations in different goat populations of Bangladesh. Bangladesh J. Anim. Sci. 39, 1–8.
Agaoglu, O.K., Ertugrul, O., 2012. Assessment of genetic diversity, genetic relationship and bottleneck using microsatellites in some native Turkish goat breeds. Small Ruminant Res. 105, 53–60.
Agha, S.H., Pilla, F., Galal, S., Shaat, I., D’Andrea, M., Reale, S., Abdelsalam, A.Z.A., Li, M.H., 2008. Genetic diversity in Egyptian and Italian goat breeds measured with microsatellite polymorphism. J. Anim. Breed. Genet. 125, 194–200.
Ameur, A., Ata, N., Benyoucef, M.T., Djaout, A., Azzi, N., Yilmaz, O., Cemal, I., Gaouar, S.B.S., 2017. New genetic identification and characterisation of 12 Algerian sheep breeds by microsatellite markers, Italian. J. Anim. Sci. 17 (1), 38–48.http://dx.doi. org/10.1080/1828051X.2017.1335182.
Amie Marini, A.B., Hifzan, R.M., Tan, S.G., Panandam, J.M., 2014. Assessment of genetic diversity on goat breeds in Malasia using microsatellite markers. Malaysian J. Anim. Sci. 17, 19–26.
Ayachi, A., Belkhadem, S., Gaouar, S.B.S., 2017. Preservation and valorization of the Hamra sheep breed. Genet. Biodivers. J. (GABJ) 1, 17–24.http://ojs.univ-tlemcen. dz/index.php/GABJ/article/view/204.
Barker, J.S.F., Tan, S.G., Moore, S.S., Mukherjee, T.K., Matheson, J.L., Selvaraj, O.S., 2001. Genetic variation within and relationships among populations of Asian goats (Capra hircus). J. Anim. Breed. Genet. 118, 213–233.
Belkhir, K., Borsa, P., Chikhi, L., Raufaste, N., Bonhomme, F., 2001. GENETIX 4.02, Logiciel Sous Windows TM Pour La génétique Des Populations. Montpellier:
Fig. 4. Estimation of the population structure with different K values (assuming K = 2 to 4).
Table 7
Estimated posterior probabilities [Ln Pr(X|K)] for different numbers of inferred clusters (K) andΔK statistic. K Reps Mean LnP(K) ΔK 1 20 −23691.090000 – 2 20 −22372.010000 2.423786 3 20 −21216.265000 7.858534 4 20 −20514.870000 417.877410
Laboratoire Génome, Populations, Interactions, CNRS., Interactions, CNRS. Université de Montpellier II.
Berber, N., Gaouar, S., Leroy, G., Kdidi, S., Aouel, N.T., Mehtar, N.S., 2014. Molecular characterization and differentiation of five horse breeds raised in Algeria using polymorphic microsatellite markers. J. Anim. Breed. Genet. 131, 387–394.
Bosman, L., Van Marie-Koster, E., Visser, C., 2015. Genetic diversity of South African dairy goats for genetic management and improvement. Small Ruminant Res. 123, 224–231.
Botstein, D., White, R.L., Skolnick, M., Davis, R.W., 1980. Construction of a genetic-linkage map in man using restriction fragment length polymorphisms. Am. J. Hum. Genet. 32, 314–331.
Cherifi, Y.A., Gaouar, S.B.S., Moussi, N., Tabet Aoul, N., Saidi-Mehtar, N., 2013. Study of camelina biodiversity in southwestern of Algeria. J. Life Sci. 7, 416–427.
Cherifi, Y.A., Gaouar, S.B.S., Guastamacchia, R., El-Bahrawy, K.A., Abushady, A.M.A., Sharaf, A.A., Harek, D., Lacalandra, G.M., Saidi-Mehtar, N., Ciani, E., 2017. Weak genetic structure in Northern African dromedary camels reflects their unique evo-lutionary history. PLoS One 12.
Criscione, A., Bordonaro, S., Moltisanti, V., Marietta, D., 2016. Differentiation of South Italian goat breeds in the focus of biodiversity conservation. Small Ruminant Res. 145, 12–19.
Dakin, E.E., Avise, J.C., 2004. Microsatellite null alleles in parentage analysis. Heredity 93, 504–509.
Dixit, S.P., Verma, N.K., Aggarwal, R.A.K., Vyas, M.K., Rana, J., Sharma, A., Tyagi, P., Arya, P., Ulmek, B.R., 2010. Genetic diversity and relationship among southern Indian goat breeds based on microsatellite markers. Small Ruminant Res. 91, 153–159.
Dixit, S.P., Aggarwal, R.A.K., Verma, N.K., Vyas, M.K., Rana, J., Sharma, A., Chander, R., 2011. Genetic variability and bottleneck analyses of Kanniadu goat breed based on microsatellite markers. Indian J. Anim. Sci. 81, 40–43.
Dixit, S.P., Verma, N.K., Aggarwal, R.A.K., Vyas, M.K., Rana, J., Sharma, A., 2012. Genetic diversity and relationship among Indian goat breeds based on microsatellite markers. Small Ruminant Res. 105, 38–45.
Djaout, A., Afri-Bouzebda, F., Chekal, F., El-Bouyahiaoui, R., Rabhi, A., Boubekeur, A., Ameur Ameur, A., Gaouar, S.B.S., 2017. Etat de la biodiversité des «races» ovines algériennes. Genet. Biodivers. (GABJ) 1, 1–16.http://ojs.univ-tlemcen.dz/index. php/GABJ/article/view/204.
Earl, D.A., Vonholdt, B.M., 2012. STRUCTURE HARVESTER: a website and program for visualizing STRUCTURE output and implementing the Evanno method. Conserv. Genet. Resour. 4, 359–361.
Evanno, G., Regnaut, S., Goudet, J., 2005. Detecting the number of clusters of individuals using the software STRUCTURE: a simulation study. Mol. Ecol. 14, 2611–2620.
FAO, 2011. Molecular genetic characterization of animal genetic resources. FAO Animal Production and Health Guidelines 9 Food and Agriculture Organization, Rome, Italy.
Falush, D., Stephens, M., Pritchard, J.K., 2003. Inference of population structure using multilocus genotype data: linked loci and correlated allele frequencies. Genetics 164, 1567–1587.
Falush, D., Stephens, M., Pritchard, J.K., 2007. Inference of population structure using multilocus genotype data: dominant markers and null alleles. Mol. Ecol. Notes 7, 574–578.
Fatima, S., 2004. Study of Genetic Variability Among Gohilwadi, Surti and Zalawadi Goats Using Microsatellite Analysis. Department of Animal Genetics and Breeding, College of Veterinary Science & Animal Husbandry. Anand Agricultural University (120).
Frankham, R., Ballou, J.D., Briscoe, D.A., 2002. An Introduction to Conservation Genetics. Cambridge University Press, Cambridge UK.
Gaouar, S., Tabet-Aoul, N., Derrar, A., Goudarzy-Moazami, K., Saïdi-Mehtar, N., 2005. Genetic diversity in Algerian sheep breeds, using microsatellite markers. In: Makkar, Harinder P.S., Viljoen, Gerrit J. (Eds.), Applications of Gene-Based Technologies for Improving Animal Production and Health in Developing Countries. Springer, pp. 641–644.
Gaouar, S., Aoul, N.T., dit Naib, O.K., Hamouda, L., Boushaba, N., Brahami, N., Aouissat, M., Dhimi, L., Saïdi-Mehtar, N., 2012. Genetic Variability and Phylogenetic Relationships of Ovine Algerian Breeds Using Microsatellites. New Trends for Innovation in the Mediterranean Animal Production. Springer, pp. 52–55.
Gaouar, S.B.S., Kdidi, S., Tabet Aouel, N., Aït-Yahia, R., Boushaba, N., Aouissat, M., Dhimi, L., Yahyaoui, M.H., Saidi-Mehtar, N., 2014. Genetic admixture of North-African ovine breeds as revealed by microsatellite loci. Livest. Res. Rural Dev. 26, 7.
Gaouar, S.B.S., Da Silva, A., Ciani, E., Kdidi, S., Aouissat, M., Dhimi, L., Lafri, M., Maftah, A., Mehtar, N., 2015a. Admixture and local breed marginalization threaten Algerian sheep diversity. PLoS One 10.
Gaouar, S.B.S., Kdidi, S., Tabet Aouel, N., Ait-Yahia, R., Boushaba, N., Aouissat, M., Saidi-Mehtar, N., 2015b. Investigation of genetic relationships among Hamra and Beni-Ighil sheep breeds based on microsatellite markers. Wayamba J. Anim. Sci. 7, 1089–1094.
Gaouar, S.B.S., Lafri, M., Djaout, A., El-Bouyahiaoui, R., Bouri, A., Bouchatal, A., Maftah, A., Ciani, E., Da Silva, A.B., 2017. Genome-wide analysis highlights genetic dilution in Algerian sheep. Heredity 118, 293–301.
Glowatzki-Mullis, M.L., Muntwyler, J., Baumle, E., Gaillard, C., 2008. Genetic diversity measures of Swiss goat breeds as decision-making support for conservation policy. Small Ruminant Res. 74, 202–211.
Goudet, J., 2001. FSTAT; a Program to Estimate and Test Gene Diversities and Fixation Indices Version 2 9.3. http://www.unil.ch/izea/softwares/fstat.html.
Gour, D.S., Malik, G., Ahlawat, S.P.S., Pandey, A.K., Sharma, R., Gupta, N., Gupta, S.C., Bisen, P.S., Kumar, D., 2006. Analysis of genetic structure of Jamunapari goats by microsatellite markers. Small Ruminant Res. 66, 140–149.
Gurler, S., Bozkaya, F., 2013. Genetic diversity of three native goat populations raised in the south-Eastern region of Turkey. Kafkas Univ. Vet. Fak. 19, 207–213.
Harek, D., Berber, N., Cherifi, Y.A., Yakhlef, H., Bouhadad, R., Arbouche, F., Sahel, H., Djellout, N.E., Saidi-Mehtar, N., Gaouar, S.B.S., 2015. Genetic diversity and re-lationships in saharan local breeds of Camelus dromedarius as inferred by
microsatellite markers. J. Camel Pract. Res. 22, 1–9.
Hedrick, P.W., 2000. Genetics of Population. Jones and Bartlett, Sudbury, Mass, pp. 34–47.
Holl, H., Isaza, R., Mohamoud, Y., Ahmed, A., Almathen, F., Youcef, C., Gaouar, S., Antczak, D.F., Brooks, S., 2017. A frameshift mutation in KIT is associated with white spotting in the Arbian camel. Genes-Basel 8.
Hubisz, M.J., Falush, D., Stephens, M., Pritchard, J.K., 2009. Inferring weak population structure with the assistance of sample group information. Mol. Ecol. Resour. 9, 1322–1332.
Hykaj, G., Hoda, A., Biçoku, Y., Papa, L., 2012. Genetic variability of Muzhake goat, estimated by microsatellite markers. Livest. Res. Rural Dev. 24, 126.
Iamartino, D., Bruzzone, A., Lanza, A., Blasi, M., Pilla, F., 2005. Genetic diversity of Southern Italian goat populations assessed by microsatellite markers. Small Ruminant Res. 57, 249–255.
Kalinowski, S.T., Taper, M.L., Marshall, T.C., 2007. Revising how the computer program CERVUS accommodates genotyping error increases success in paternity assignment. Mol. Ecol. 16, 1099–1106.
Kerba, A., 1995. Base des données sur les races caprines en Algérie. FAO, pp. 19–39.
Kim, K.S., Yeo, J.S., Lee, J.W., Kim, J.W., Choi, C.B., 2002. Genetic diversity of goats from Korea and China using microsatellite analysis. Asian Australas. J. Anim. 15, 461–465.
Kumar, D., Dixit, S.P., Sharma, R., Pandey, A.K., Sirohi, G., Patel, A.K., Aggarwal, R.A.K., Verma, N.K., Gour, D.S., Ahlawat, S.P.S., 2005. Population structure, genetic varia-tion and management of Marwari goats. Small Ruminant Res. 59, 41–48.
Kumar, S., Dixit, S.P., Verma, N.K., Singh, D.K., Pande, A., Kumar, S., Chander, R., Singh, L.B., 2009. Genetic diversity analysis of the Gohilwari breed of Indian goat (Capra hircus) using microsatellite markers. Am. J. Anim. Vet. Sci. 4, 49–57.
Langella, O., 1999. Populations 1.2.31. Population Genetic Software (Individuals or Populations Distances, Phylogenetic Trees). 2012 (Acces date: 09 July 2015).
Ligda, C., Altarayrah, J., Georgoudis, A., Consortium, E., 2009. Genetic analysis of Greek sheep breeds using microsatellite markers for setting conservation priorities. Small Ruminant Res. 83, 42–48.
Mahammi, F.Z., Gaouar, S.B.S., Tabet-Aoul, N., Tixier-Boichard, M., Saïdi-Mehtar, N., 2014. Caractéristiques morpho-biométriques et systèmes d'élevage des poules locales en Algérie occidentale (Oranie). Cahiers Agric. 23, 1–11.
Mahammi, F.Z., Gaouar, S.B.S., Laloe, D., Faugeras, R., Tabet-Aoul, N., Rognon, X., Tixier-Boichard, M., Saidi-Mehtar, N., 2016. A molecular analysis of the patterns of genetic diversity in local chickens from western Algeria in comparison with commercial lines and wild jungle fowls. J. Anim. Breed. Genet. 133, 59–70.
Mahmoudi, B., Panahi, B., Mohammadi, S.A., Daliri, M., Babayev, M.S., 2014. Microsatellite based phylogeny and bottleneck studies of iranian indigenous goat populations. Anim. Biotechnol. 25, 210–222.
Mahrous, K.F., Alakilli, S.Y., Salem, L., El-Aziem, S.H.A., El-Hanafy, A., 2013. Genetic diversity in Egyptian and Saudi goat breeds using microsatellite markers. J. Appl. Biosci. 72, 5838–5845.
Marshall, T., 2006. In: Marshall, T. (Ed.), Cervus, 3 .0, Cervus Is a Computer Program for Assignment of Parents to Their Offspring Using Genetic Markers. Cervus, a Windows Package for Parentage Analysis Using Likelihood Approach, .http://www. fieldgenetics.com. (Access date: 02 July 2008).
Mekuriaw, G., Gizaw, S., Dessie, T., Mwai, O., Djikeng, A., Tesfaye, K., 2016. A review on current knowledge of genetic diversity of domestic goats (Capra hircus) identified by microsatellite loci: how those efforts are strong to support the breeding programs? J. Life Sci. Biomed. 6, 22–32.
Miller, S.A., Dykes, D.D., Polesky, H.F., 1988. A simple salting out procedure for ex-tracting DNA from human nucleated cells. Nucleic Acids Res. 16 1215–1215.
Missohou, A., Poutya, M.R., Nenonene, A., Dayo, G.K., Ayssiwede, S.B., Talaki, E., Issa, Y., Fane, A., 2011. Genetic diversity and differentiation in nine West African local goat breeds assessed via microsatellite polymorphism. Small Ruminant Res. 99, 20–24.
Nedjraoui, D., 2006. Algeria Country Pasture/Forage Resource Profiles. FAO, Rome, Italy.
Nei, M., 1972. Genetic distance between populations. Am. Nat. 106, 283–292.
Ouafi, A.T., Babilliot, J.M., Leroux, C., Martin, P., 2002. Genetic diversity of the two main Moroccan goat breeds: phylogenetic relationships with four breeds reared in France. Small Ruminant Res. 45, 225–233.
Parejo, J.C., Padilla, J.A., Calero, R., Martinez-Trancon, M., Sansinforiano, E., Rabasco, A., Salazar, J., Bravo, J.A., 2015. Population genetic structure and conservation management of Retinta Extremena goats. Small Ruminant Res. 124, 9–16.
Peakall, R., Smouse, P.E., 2006. GENALEX 6: genetic analysis in Excel: population genetic software for teaching and research. Mol. Ecol. Notes 6, 288–295.
Peakall, R., Smouse, P.E., 2012. GenAlEx 6.5: genetic analysis in Excel. Population genetic software for teaching and research-an update. Bioinformatics 28, 2537–2539.
Pritchard, J.K., Stephens, M., Donnelly, P., 2000. Inference of population structure using multilocus genotype data. Genetics 155, 945–959.
Radhika, G., Raghavan, K.C., Aravindakshan, T.V., Thirupathy, V., 2015. Genetic di-versity and population structure analysis of native and crossbred goat genetic groups of Kerala, India. Small Ruminant Res. 131, 50–57.
Rambaut, A., Drummond, A., 2015. FigTree, Ver. 1.4. 2. Available:http://tree.bio.ed.ac. uk/software/figtree/. (Accessed date: 09 July 2015).
Serrano, M., Calvo, J.H., Martinez, M., Marcos-Carcavilla, A., Cuevas, J., Gonzalez, C., Jurado, J.J., de Tejada, P.D., 2009. Microsatellite based genetic diversity and po-pulation structure of the endangered Spanish Guadarrama goat breed. BMC Genet. 10.
Singh, G., Thakur, Y., Kour, A., Sankhyan, V., Katoch, S., 2015. Genetic characterization of Gaddi goat breed of Western Himalayas using microsatellite markers. Vet. World 8, 527.
Weir, B.S., Cockerham, C.C., 1984. Estimating F-statistics for the analysis of population-structure. Evolution 38, 1358–1370.
Wright, S., 1931. Evolution in mendelian populations. Genetics 16, 97–159.
Yeh, F.C., Yang, R.C., Boyle, T.B.J., Ye, Z., Mao, J.X., 1997. POPGENE, the User-friendly Shareware for Population Genetic Analysis. Molecular Biology and Biotechnology Centre 10. University of Alberta, Canada, pp. 295–301.