HAL Id: hal-02652236
https://hal.inrae.fr/hal-02652236
Submitted on 29 May 2020
HAL is a multi-disciplinary open access
archive for the deposit and dissemination of
sci-entific research documents, whether they are
pub-lished or not. The documents may come from
teaching and research institutions in France or
abroad, or from public or private research centers.
L’archive ouverte pluridisciplinaire HAL, est
destinée au dépôt et à la diffusion de documents
scientifiques de niveau recherche, publiés ou non,
émanant des établissements d’enseignement et de
recherche français ou étrangers, des laboratoires
publics ou privés.
First insights into the genetic diversity of the pinewood
nematode in its native area using new polymorphic
microsatellite loci
Sophie Mallez, Chantal Castagnone, Margarida Espada, Paulo Vieira,
Jonathan D Eisenback, Manuel Mota, Thomas Guillemaud, Philippe
Castagnone-Sereno
To cite this version:
Sophie Mallez, Chantal Castagnone, Margarida Espada, Paulo Vieira, Jonathan D Eisenback, et
al.. First insights into the genetic diversity of the pinewood nematode in its native area using new
polymorphic microsatellite loci. PLoS ONE, Public Library of Science, 2013, 8 (3),
�10.1371/jour-nal.pone.0059165�. �hal-02652236�
Nematode in Its Native Area Using New Polymorphic
Microsatellite Loci
Sophie Mallez1,2,3,4*, Chantal Castagnone2,3,4, Margarida Espada5, Paulo Vieira5, Jonathan D. Eisenback6, Manuel Mota5, Thomas Guillemaud1,3,4, Philippe Castagnone-Sereno2,3,4
1 INRA, UMR 1355 Institut Sophia Agrobiotech, Equipe Biologie des Populations Introduites, Sophia Antipolis, France, 2 INRA, UMR 1355 Institut Sophia Agrobiotech, Equipe Interactions Plantes-Ne´matodes, Sophia Antipolis, France,3 Universite´ de Nice Sophia Antipolis, UMR Institut Sophia Agrobiotech, Sophia Antipolis, France, 4 CNRS, UMR 7254 Institut Sophia Agrobiotech, Sophia Antipolis, France, 5 NemaLab/ICAAM – Instituto de Cieˆncias Agra´rias e Ambientais Mediterraˆnicas, Universidade de E´vora - Nu´cleo da Mitra, E´vora, Portugal,6 Department of Plant Pathology, Physiology, and Weed Science, Virginia Tech, Blacksburg, Virginia, United States of America
Abstract
The pinewood nematode, Bursaphelenchus xylophilus, native to North America, is the causative agent of pine wilt disease and among the most important invasive forest pests in the East-Asian countries, such as Japan and China. Since 1999, it has been found in Europe in the Iberian Peninsula, where it also causes significant damage. In a previous study, 94 pairs of microsatellite primers have been identified in silico in the pinewood nematode genome. In the present study, specific PCR amplifications and polymorphism tests to validate these loci were performed and 17 microsatellite loci that were suitable for routine analysis of B. xylophilus genetic diversity were selected. The polymorphism of these markers was evaluated on nematodes from four field origins and one laboratory collection strain, all originate from the native area. The number of alleles and the expected heterozygosity varied between 2 and 11 and between 0.039 and 0.777, respectively. First insights into the population genetic structure of B. xylophilus were obtained using clustering and multivariate methods on the genotypes obtained from the field samples. The results showed that the pinewood nematode genetic diversity is spatially structured at the scale of the pine tree and probably at larger scales. The role of dispersal by the insect vector versus human activities in shaping this structure is discussed.
Citation: Mallez S, Castagnone C, Espada M, Vieira P, Eisenback JD, et al. (2013) First Insights into the Genetic Diversity of the Pinewood Nematode in Its Native Area Using New Polymorphic Microsatellite Loci. PLoS ONE 8(3): e59165. doi:10.1371/journal.pone.0059165
Editor: Adam Stow, Macquarie University, Australia
Received December 12, 2012; Accepted February 12, 2013; Published March 15, 2013
Copyright: ß 2013 Mallez et al. This is an open-access article distributed under the terms of the Creative Commons Attribution License, which permits unrestricted use, distribution, and reproduction in any medium, provided the original author and source are credited.
Funding: This work was supported by a grant from European Union (KBBE.2010.1.4-09 REPHRAME project). The funders had no role in study design, data collection and analysis, decision to publish, or preparation of the manuscript.
Competing Interests: The authors have declared that no competing interests exist. * E-mail: sophie.mallez@sophia.inra.fr
Introduction
The pinewood nematode (PWN), Bursaphelenchus xylophilus (Steiner & Burher, 1934) Nickle, 1970 (Nematoda: Aphelenchoi-didae) [1], native to North America and widely distributed in the USA and Canada [2], is an invasive pest of pine forests. At a local scale, it is usually transmitted by a cerambycid beetle, belonging to the genus Monochamus [3–6]. Probably due to international trade, including wood, wood products and shipping containers, the pinewood nematode reached other continents at the beginning of the twentieth century [7], where it successfully established and caused pine wilt disease. As a consequence it has become a serious threat to coniferous forests worldwide, especially pine forests [8]. The pine wilt disease is now considered the most serious disease of forest trees in East Asian countries, such as China, Taiwan, South Korea and Japan [9,10]. The presence of PWN was detected for the first time in Europe in 1999, in Peninsula of Setu´bal in Portugal [11]. New outbreaks have been identified since 2008 in the center of Portugal and on Madeira Island in 2009 [12]; and more recently in Spain [13,14].
In light of the significant risks for European forests along with environmental, economic and social impacts [15], there is an
urgent need to develop effective pest management of PWN. In particular, it is critical to understand the invasion and colonization of this pest, including the risk of non-vectored spread of PWN to healthy forests. Several studies have already attempted to decipher the invasion routes of PWN including the detection of the source of invading populations [16–18] and the inference of the history of the outbreaks in Asia [19–22] and in Europe [23,24]. Although an American origin of Japanese populations is now widely accepted [25–27], many questions remain concerning the invasion routes of PWN. Various limitations in these studies can be invoked, including (i) a low number of available genetic markers that can be used on single PWN individual due to the small size of the nematode, (ii) the use of too few field samples from both the invaded and native areas, (iii) the use of culture collection samples instead of field samples and (iv) the lack of use of adequate statistical methods devoted to invasion route inference, as those presented by Estoup and Guillemaud [28].
Microsatellite markers are widely used in population genetics studies [29,30] and specifically in invasion route inference [28]. In a preliminary study, a PWN-specific microsatellite enriched genomic library was built and sequenced using high-throughput 454 GS-FLX Titanium pyrosequencing (Roche Diagnostics) [31].
In short, genomic DNA was obtained from a pool of thousands of PWN from a laboratory collection and enriched by hybridization in the following microsatellite motifs: [(AG)10, (AC)10, (AAC)8,
(AGG)8, (ACG)8, (AAG)8, (ACAT)6and (ATCT)6].
Pyrosequenc-ing yielded 12,286 sequences. The QDD program [32] was used to select sequences containing microsatellites with desirable properties and to design PCR primers pairs. Ninety four primer pairs were designed on sequences longer than 80 bp containing perfect or imperfect microsatellites with at least five repeated motifs.
The objectives of the present work were (i) to test in the laboratory the 94 microsatellite markers developed in silico by Malausa et al. [31], (ii) to set up multiplexed PCR reactions of specific microsatellite markers for routine use in PWN and (iii) to use them to gain first insights into the PWN genetic diversity and structure in its native area, which constitutes a prerequisite for deciphering its worldwide invasion routes [28].
Materials and Methods Biological material
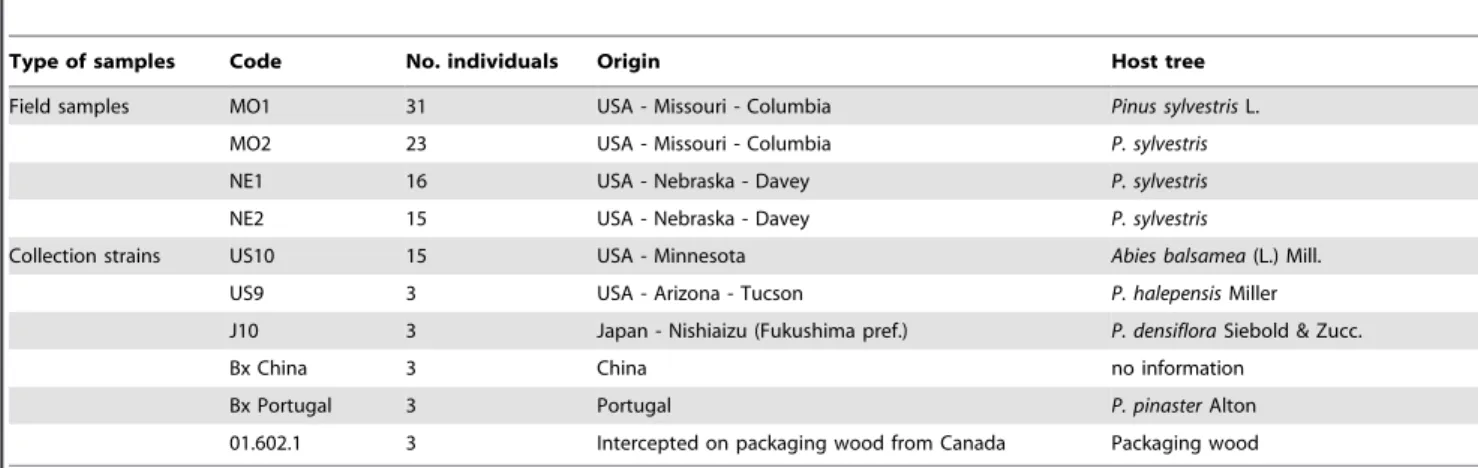
No permission was required to collect samples of this species in the native area and we obtained an official agreement from the French authorities (#2012060-0004) to manipulate this quaran-tine organism in the Institute Sophia Agrobiotech. In this study, a total of 115 individuals grouped into field samples and collection strains from native (USA and Canada) and invasive (Japan, China and Portugal) areas, were used. The characteristics of the samples are listed in Table 1. The field samples came from the native area (USA) and were extracted from wood samples that were collected directly from field locations. Each field sample corresponds to a single tree and consisted of between 15 and 31 individuals of mixed life stages per tree. The trees from Nebraska were close to each other (less than 5 meters) and distant about 500 km from the Missouri trees, which were about 50 km from each other. Nematodes were extracted with a Baermann funnel [33]. The collection strains, both from native and invasive areas, came from cultures that have been reared in the INRA laboratory since 1986 for the oldest strain. This collection was derived from original isolates of about 500 nematodes and is maintained monoxenically on Botrytis cinerea (deBary) Whetzel at 15 uC. Individuals were stored in DESS [34] at 4uC before DNA was extracted.
DNA extraction
Genomic DNA was extracted, as described hereafter, by thermal shock from single individuals [35]. Each individual was transferred to 18ml of lysis buffer (Taq buffer with MgCl210X,
Taq Core Kits10, MP Biomedicals; 60 mg.ml21Proteinase K and sterile distillated H2O) and was then put at 280uC for 45 min,
and immediately transferred to 60uC for 60 min and finally to 95 uC for 15 min in a BiometraH
T3-Thermoblock Thermocycler.
Microsatellite markers validation
To avoid the presence of null alleles that are common in microsatellite markers [36], we tested the PCR amplification of the 94 primer pairs designed by Malausa et al. [31] on 18 individuals from the collection strains (Table 1). This first step was carried out using the following procedure: PCR amplifications were per-formed in a final volume of 25ml containing 2ml of genomic DNA extracted as described above, 2.5ml of Taq buffer with MgCl2
(10X, Taq Core Kits 10, MP Biomedicals), 0.2ml of Taq DNA Polymerase (5 U/ml, Taq Core Kits 10, MP Biomedicals), 1.2ml of dNTPs (10 mM, Taq Core Kits 10, MP Biomedicals), 0.5ml of each primer (10mM, Eurogentec) and sterile distillated H2O. The
amplification reactions were performed in a T3-Thermoblock Thermocycler BiometraHand included a 10 min denaturation step at 95uC, followed by 40 cycles of 30 sec at 95 uC, 30 sec at 55 uC and 1 min at 72uC, followed by a final extension step at 72 uC for 10 min. The markers which gave positive PCR amplifications were then used in fluorescent PCR in order to analyze their polymorphism. This step was conducted on 100 individuals from the field samples and one single collection strain (US10) from the native area (Table 1). Two microsatellite markers from the literature, Bx07 and Bx08 [22], were also added at this step since they amplified well in our PCR conditions. PCR amplifications were performed in 10ml containing 1X QIAGEN Multiplex Master Mix, 2mM of each primer with forward primers labeled with a fluorescent dye (6-FAM, VIC, PET or NED) on the 59 end and 2ml of genomic DNA extracted by thermal shock as explained above. The amplification reactions were performed in a BiometraH T3-Thermoblock Thermocycler and included a 15 min denatur-ation step at 95uC, followed by 28 or 33 cycles (depending on the primer pairs, see Results) of 30 sec at 94uC, 1.5 min at 55 uC, and 1 min at 72uC, followed by a final extension step of 30 min at 60 uC. Genotype scoring was performed using an ABI 3700 sequencer (Applied Biosystems) with the 500 LIZTMGeneScanTM
Table 1. Characteristics of the samples of Bursaphelenchus xylophilus used in this study.
Type of samples Code No. individuals Origin Host tree Field samples MO1 31 USA - Missouri - Columbia Pinus sylvestris L.
MO2 23 USA - Missouri - Columbia P. sylvestris NE1 16 USA - Nebraska - Davey P. sylvestris NE2 15 USA - Nebraska - Davey P. sylvestris
Collection strains US10 15 USA - Minnesota Abies balsamea (L.) Mill. US9 3 USA - Arizona - Tucson P. halepensis Miller J10 3 Japan - Nishiaizu (Fukushima pref.) P. densiflora Siebold & Zucc. Bx China 3 China no information
Bx Portugal 3 Portugal P. pinaster Alton 01.602.1 3 Intercepted on packaging wood from Canada Packaging wood doi:10.1371/journal.pone.0059165.t001
size standard (Applied Biosystems) and GenemarkerTM version 1.75 software (SoftGenetics LLC).
Genetic diversity analyses
We computed observed (Ho) and expected (He) heterozygosities using Genetix 4.05 [37]. Deviations from Hardy-Weinberg equilibrium (HWE), for each locus and globally, were tested using Genepop version 4.1.3 [38]. Deviations from linkage equilibrium between loci were tested using the log likelihood ratio statistic in Genepop version 4.1.3 [38]. We took into account multiple testing (in the case of HWE tests) and non-independence between tests (in the case of linkage tests) by using the false discovery rate (FDR) correction [39] and the sequential Bonferroni adjustment [40], respectively. To quantify any inferred deviation from HWE, we calculated the Weir & Cockerham’s estimate of FIS [41] using
Genepop [38]. Differences in mean allelic richness, computed using Fstat version 2.9.3.2 [42] and mean expected heterozygosity between field samples and collection strain (US10) were tested with the one-sided non-parametric test of Wilcoxon (with greater genetic diversity in the field samples), with the locus as the repeat unit, using R version 2.14.2 [43]. For the mean allelic richness analysis, the microsatellite marker PWN_35 was excluded because it presented missing data, which too greatly reduced the number of individuals taken into account to compute the allelic richness.
Genetic structure analyses
Nematodes from the field were sampled at the same time and reflect at least part of the genetic diversity existing in the field. This is not true for the collection strain, for which we do not have precise sampling information and for which many generations of genetic drift may have distorted the genotypic frequencies. Hence, only the 85 individuals from field origins were used for population genetics structure analyses. We first tested the hypothesis of genotypic frequencies homogeneity among samples using the exact test of Fisher [44] provided by Genepop version 4.1.3 [38]. Since multiple tests were performed, we adjusted the significance level using FDR correction [39]. We also performed an analysis of molecular variance (AMOVA), allowing measurement of the hierarchical distribution of the genetic variability, using Arlequin version 3.5.1.2 [45]. The different sources of variability tested were the following: within samples (i.e. trees), among samples within groups (i.e. states, Nebraska and Missouri) and among groups. The significance of the variance components associated with different levels of structure was tested by performing 20,000 permutations. We then studied the samples using the Bayesian assignment approach implemented in Structure version 2.3.4 [46]. This Bayesian method uses individual multilocus genotypes to infer clusters of individuals that minimize Hardy Weinberg and linkage disequilibria. An admixture model with correlated allele frequen-cies was used [47]. Ten independent runs for K = 1 to 12 were carried out each with a Markov Chain Monte Carlo (MCMC) of 150 000 iterations following a burn-in period of 50 000 iterations. Default values were maintained for all other parameters. The number of clusters was determined using the method of Evanno et al. [48]. Finally, we used a multivariate method, the Discriminant Analysis of Principal Components (DAPC) recently developed by Jombart et al. [49] because of its versatility. This method does not rely on any population genetics model and it is not constrained by any assumptions on HWE or linkage equilibrium. DAPC was performed using adegenet package [50] in R version 2.14.2 [43]. The number of clusters K varied from 1 to 12 and the number of inferred clusters was determined according to the Bayesian Information Criterion (BIC). The chosen number of clusters is
the minimum number of clusters after which the BIC increases or decreases by a negligible amount [50].
Results
Validation of microsatellite markers
Among the 94 microsatellite primer pairs designed by Malausa et al. [31], 25 gave positive PCR amplification at the predicted size for the 18 individuals (data not shown) and were consequently tested for their polymorphism. Fifteen out of these 25 markers and the two markers, Bx07 and Bx08, of Zhou et al. [22] could be unambiguously scored and were polymorphic (Tables 2 and 3). These 17 markers could be amplified in three PCR multiplex reactions: MA28 and MB28 multiplex panels, with 28 cycles in PCR amplification and MC33 multiplex panel with 33 cycles in PCR amplification (Table 2). The 15 markers developed here have been deposited in EMBL-Bank and accession numbers are shown in Table 2.
Genetic diversity
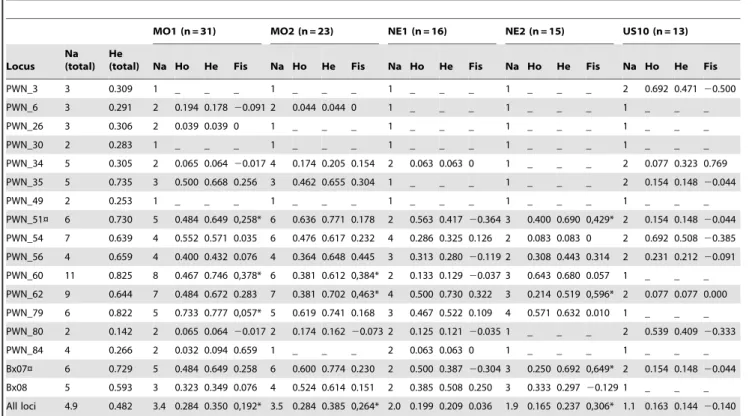
The total number of alleles per locus over all samples varied from 2 to 11, with a mean of 4.7. In Missouri samples, more than four microsatellite markers displayed five alleles or more. The expected heterozygosity per locus over all samples ranged from 0.142 to 0.825 (Table 3). Deviations from HWE associated with heterozygote deficiency were detected in 5 loci (PWN_51, PWN_60, PWN_62, PWN_79 and Bx07; Table 3). Significant linkage disequilibrium was detected between markers PWN_51 and Bx07 after sequential Bonferroni adjustment. In addition all alleles of marker PWN_51 have a length that is exactly 63 bp shorter than those of Bx_07.
The mean number of alleles per sample ranged from 1.1 to 3.5. The mean allelic richness and the mean expected heterozygosity were between 1.49 and 3.13 and between 0.144 and 0.385, respectively (Table 3). The mean allelic richness was generally larger in field samples than in the collection strain, with a reduction of 22% to 52% in the collection strain depending on the field samples. The observed differences were significant for MO1 (Wilcoxon’s test, p = 0.022) and MO2 (p = 0.020) and non-significant for NE1 and NE2 (Wilcoxon’s tests, p.0.1). Expected heterozygosities were also lower in the collection strain with a reduction of 31% to 63% compared to the field samples. Only two significant (Wilcoxon’s test, MO1, p = 0.018 and MO2, p = 0.017) larger mean expected heterozygosities were found in field samples compared to collection strain. Over all loci, HWE was rejected in 3 samples: MO1, MO2 and NE2 (Fisher’s exact tests, p,1023).
Assessing the genetic structure
Nematodes from the four field origins were significantly differentiated either within or between states (Fisher’s exact tests, p,1025). Moreover, the analysis of molecular variance revealed that the majority of the genetic variance was explained by the variation between individuals within trees (75.27%) and that the proportion of variance was much more important between states (16.64%) than between trees within states (8.09%).
Results of the clustering method using Structure and the multivariate method using DAPC are visualized and summarized in Figure 1. Both methods suggest the existence of three clusters. These three clusters were supported by a mean Structure co-ancestry coefficient larger than 93%. In DAPC, all individuals were assigned to the three clusters so that no ‘ghost’ population was inferred. The three clusters inferred by the two different methods were very similar, with one identical cluster and with only four individuals (NE1-4; NE2-6; NE2-8 and NE2-9) assigned
differently to the two remaining clusters. One of the clusters consisted of individuals from Nebraska and the two others were shared between the two samples from Missouri, mixing individuals from different trees. The four individuals from Nebraska mentioned above were assigned either to the Nebraska’s cluster or to one of the two clusters found in Missouri, depending on the method used (see Figure 1).
Discussion
We developed 15 new microsatellite markers with the following properties: (i) they are easily usable in routine conditions, (ii) they can be used together on single individuals, (iii) they are polymorphic at the individual level and (iv) only three multiplex PCR reactions are necessary to genotype each PWN individual.
Two markers, Bx07 and Bx08, from Zhou et al. [22], were also added in two multiplex PCR reactions, because they are polymorphic and they amplified well in our PCR conditions. Nonetheless, it is important to note that we observed significant linkage disequilibrium between Bx07 and PWN_51 and all alleles of Bx07 are exactly 63 bp larger than the corresponding alleles of PWN_51. This leads us to suppose that these two markers correspond to the same locus. However, we could not verify this hypothesis because the sequence of Bx07 is not yet publicly available. Several markers (PWN_51, PWN_60, PWN_62, PWN_79 and Bx07) exhibited also a significant heterozygote deficiency that may be due to two reasons: (i) the presence of null alleles, i.e., alleles that are not amplified by the multiplex PCR, and (ii) a Wahlund effect, i.e., a direct consequence of the existence of subdivisions in the studied populations. As no individuals with Table 2. Characteristics of 15 microsatellite markers developed for Bursaphelenchus xylophilus.
Locus Primer sequence (5’ - 3’) Motif repeat
Fluorescent label/ Multiplex panel Allele size range (bp) Accession Number PWN_3 F : GAAATCTGGGGAGCAAAACA (CT)8 6FAM/MC33 215–227 HF563643 R : ACCGCACTCGCACTTAGATT
PWN_6 F : GGAATTAGGCGTCCACAAGA (AG)7 6FAM/MC33 126–131 HF563644
R : TGCTGTATAAACATTTGCTCTTCG PWN_26 F : GAAAAACTTAGGCTGGGGGA (TG)5 PET/MA28 157–160 HF563645 R : TAGTGACGACTCATCCGCTG PWN_30 F : ACCTAGCGTCGAAAACCCTT (TG)5 VIC/MB28 207–209 HF563646 R : ATAGCAGCAGGTCAAATCCG PWN_34 F : CCATTGCCCAAAGGATTAAA (CT)7 PET/MC33 82–95 HF563647 R : ACGTAGCATTCGGAGTGACC
PWN_35 F : ACCGCCTGGTAACCGAGT (GA)6 PET/MB28 185–193 HF563648
R : TTGGACACTGCGAGTAAGGA
PWN_49 F : CTGGGAGTTCTTTTTGCTCG (AAC)5 PET/MA28 174–177 HF563649
R : GCAACAATCGTTAGTGGCAA
PWN_51 F : GGAAGAGACTTGACCCGAAA (AG)7 6FAM/MC33 84–96 HF563650
R : GGAAAAGAGTCCTCACGTCAA
PWN_54 F : ACCTTCACACTTGTAGCCGC (AG)7 PET/MA28 113–119 HF563651
R : CCGGTCATCATAATCTCTGATCT
PWN_56 F : TCTTCACATTAATCTTGCTGCC (CA)8 PET/MC33 185–195 HF563652
R : AACGATTAGGAACGCAGTGG
PWN_60 F : GGCGAAACGGATAAAGGAAT (CA)9 VIC/MB28 129–147 HF563653
R : TTCTTCCCCAAACCTTCTCC
PWN_62 F : GAGCTATAGCCCCTGCCTTT (CT)6 6FAM/MA28 112–124 HF563654
R : AGCCTTGCGAAGAAACAAAA
PWN_79 F : TGGATACAAACGGTTGAGGA G(GA)2G(GA)8A(T)5 NED/MB28 107–114 HF563655
R : AACCTCATCTGTCCGTGGAT PWN_80 F : AATTGGTGCTCCTGTATGGC TG(TGT)5TG VIC/MB28 78–88 HF563656 R : CGGCTTACTCTTTGTCCCAA PWN_84 F : CCGTGTTTTCAACTCATTCC (CT)2T(CT)5C PET/MC33 129–137 HF563657 R : TTTGATCCGATTACCTTCGG Bx07 F : AACGGAAAAGAGTCCTCACG (TC)10 6FAM/MB28 146–157 [22] R : TAGGCCCTCCTTGACAAAAGC Bx08 F : CTGCCTATTTTCGACTTCTC (CT)10 NED/MA28 105–113 [22] R : CAAGGATCGTGTTCCTCTTTTTG
Characteristics of the microsatellite markers from Zhou et al. [22], Bx07 and Bx08, are also given. doi:10.1371/journal.pone.0059165.t002
missing genotypes were observed at these loci, the first hypothesis is not likely. Moreover, clustering analyses corroborated the second hypothesis. Using these markers, the level of polymorphism detected in our samples was low to moderate but sufficient for population genetics analyses. Moreover, it lies in the range
typically found in the literature for other phytoparasitic nematode species [51–56]. This new set of markers provides a useful tool, appropriate to implement analytical methods in population genetics due to its resolution at the individual level. Specifically, these markers will be very useful in identifying the source of Table 3. Summary of standard population genetics analyses for each sample.
MO1 (n = 31) MO2 (n = 23) NE1 (n = 16) NE2 (n = 15) US10 (n = 13) Locus
Na (total)
He
(total) Na Ho He Fis Na Ho He Fis Na Ho He Fis Na Ho He Fis Na Ho He Fis PWN_3 3 0.309 1 _ _ _ 1 _ _ _ 1 _ _ _ 1 _ _ _ 2 0.692 0.471 20.500 PWN_6 3 0.291 2 0.194 0.178 20.091 2 0.044 0.044 0 1 _ _ _ 1 _ _ _ 1 _ _ _ PWN_26 3 0.306 2 0.039 0.039 0 1 _ _ _ 1 _ _ _ 1 _ _ _ 1 _ _ _ PWN_30 2 0.283 1 _ _ _ 1 _ _ _ 1 _ _ _ 1 _ _ _ 1 _ _ _ PWN_34 5 0.305 2 0.065 0.064 20.017 4 0.174 0.205 0.154 2 0.063 0.063 0 1 _ _ _ 2 0.077 0.323 0.769 PWN_35 5 0.735 3 0.500 0.668 0.256 3 0.462 0.655 0.304 1 _ _ _ 1 _ _ _ 2 0.154 0.148 20.044 PWN_49 2 0.253 1 _ _ _ 1 _ _ _ 1 _ _ _ 1 _ _ _ 1 _ _ _ PWN_51¤ 6 0.730 5 0.484 0.649 0,258* 6 0.636 0.771 0.178 2 0.563 0.417 20.364 3 0.400 0.690 0,429* 2 0.154 0.148 20.044 PWN_54 7 0.639 4 0.552 0.571 0.035 6 0.476 0.617 0.232 4 0.286 0.325 0.126 2 0.083 0.083 0 2 0.692 0.508 20.385 PWN_56 4 0.659 4 0.400 0.432 0.076 4 0.364 0.648 0.445 3 0.313 0.280 20.119 2 0.308 0.443 0.314 2 0.231 0.212 20.091 PWN_60 11 0.825 8 0.467 0.746 0,378* 6 0.381 0.612 0,384* 2 0.133 0.129 20.037 3 0.643 0.680 0.057 1 _ _ _ PWN_62 9 0.644 7 0.484 0.672 0.283 7 0.381 0.702 0,463* 4 0.500 0.730 0.322 3 0.214 0.519 0,596* 2 0.077 0.077 0.000 PWN_79 6 0.822 5 0.733 0.777 0,057* 5 0.619 0.741 0.168 3 0.467 0.522 0.109 4 0.571 0.632 0.010 1 _ _ _ PWN_80 2 0.142 2 0.065 0.064 20.017 2 0.174 0.162 20.073 2 0.125 0.121 20.035 1 _ _ _ 2 0.539 0.409 20.333 PWN_84 4 0.266 2 0.032 0.094 0.659 1 _ _ _ 2 0.063 0.063 0 1 _ _ _ 1 _ _ _ Bx07¤ 6 0.729 5 0.484 0.649 0.258 6 0.600 0.774 0.230 2 0.500 0.387 20.304 3 0.250 0.692 0,649* 2 0.154 0.148 20.044 Bx08 5 0.593 3 0.323 0.349 0.076 4 0.524 0.614 0.151 2 0.385 0.508 0.250 3 0.333 0.297 20.129 1 _ _ _ All loci 4.9 0.482 3.4 0.284 0.350 0,192* 3.5 0.284 0.385 0,264* 2.0 0.199 0.209 0.036 1.9 0.165 0.237 0,306* 1.1 0.163 0.144 20.140 Note: Na (total), Na, Ho and He refer to as the total number of alleles per locus over all samples, the number of alleles per locus in each sample, the observed heterozygosity and the expected heterozygosity, respectively. Fis was calculated after Weir & Cockerham [41]. The last row gives mean numbers of alleles, mean heterozygosities and Fis calculated over all loci. ‘*’ indicates that the HWE test is significant after FDR correction [39] (except for the last row). ‘¤’ indicates the microsatellite markers involved in significant linkage disequilibria after sequential Bonferroni adjustment [40]. ‘_’ means that for monomorphic markers, Ho, He and Fis were not computed.
doi:10.1371/journal.pone.0059165.t003
Figure 1. Genetic structure of the PWN field samples from the USA. A, Barplots of Structure of the coefficient of co-ancestry for K = 2, 3, 4, 5 and 6 clusters. Each bar corresponds to one individual nematode and each cluster is represented by a color. The number of clusters inferred was K = 3, based on the DK of Evanno et al. [48]. B, DAPC scatterplot showing the first two principal components of the DAPC for K = 3, the number of cluster being inferred from the Bayesian Information Criterion (BIC).
invasive outbreaks and in deciphering the invasion routes of the PWN. Practically, they will be used to obtain multilocus genotypes (MLGs) of numerous samples from the native and invaded areas. These MLGs will be analyzed using recent and appropriate methods devoted to this question, like approximate Bayesian computation [28,57] which has already been successfully used in other invading species [58–60]. Until now, most markers developed for the PWN, such as AFLP [19,21], RAPD [16,24], ISSR [16,18], IGS [18], homologous DNA probes [17] or cytochrome b and cellulase gene sequences [23] suffer from technical limitations. They either displayed a low level of polymorphism [23], were not codominant [16,18,19,21,24] and/ or were used on pooled collections of individuals [16–19,21,23,24] with results that are difficult to interpret. A few microsatellite markers have already been developed for the PWN [20,22] but they either required the pre-amplification of genomic DNA [20], which can cause an artifactual polymorphism, or were too few to obtain a clear image of the genetic diversity of the samples analyzed [22]. The reason for these problems is that, in general, the minute quantity of DNA from each individual is an obstacle to obtain individual multilocus genotypes at a large number of markers. Multiplex PCR reactions, in addition to reducing costs, allow this problem to be overcome by amplifying several microsatellite markers in a single PCR reaction ([61] for a review, [62]). The main advantage of the tools developed here is thus the possibility to genotype individuals using three multiplex PCR reactions. Only three PCR reactions per individual are needed to obtain the diploid multilocus genotypes of 17 microsatellite markers without any DNA pre-amplification step.
We further used the 17 microsatellite markers on 100 individuals PWN collected from four field locations and one laboratory collection strain to obtain first insights into the genetic variability of B. xylophilus at the individual level in its native area. First, the number of alleles and the expected heterozygosity were lower in the collection strain than in field samples with large reductions of 22–52% and of 31–63%, respectively. Although the statistical significance of this result was not clear, it seems that the collection strain has likely suffered a loss of genetic diversity compared to field samples, particularly the Missouri samples. This difference between laboratory strains and wild populations/field samples has already been explored and demonstrated in other species. For instance, Kim et al. [63] observed a loss of 15–39% genetic diversity in the non-diapause colony of the western corn rootworm (Diabrotica virgifera virgifera Le Conte, 1868) compared with contemporary wild populations, depending on the parameter measured. Similar results were obtained by Coe et al. [64] with the zebrafish (Danio rerio Hamilton, 1863) with the allelic richness for all four strains less than 20% of that found in the wild fish. The maintenance of strains in laboratory collections and, in our specific case, the very short generation time, i.e. 6 5–7 days at 20uC [65], and the need to transfer nematodes from one Petri dish to another to ensure the viability of the strain, probably create recurrent bottlenecks, which in turn decrease the genetic diversity. Further investigations are needed to clarify this observation. However, in any case, this potential loss of genetic diversity is important to take into account when performing population genetic diversity analyses using medium and long-term culture collection samples. Second, intra-sample variability was near HWE and linkage equilibrium. This result confirms that the PWN reproduces sexually in natura with no evidence of deviation from random mating between individuals. Moreover, an important part of the genetic variance detected here corresponded to inter-individual variation within a tree. This suggests that several nematodes enter
into the tree and more specifically that several nematodes effectively reproduce and contribute to the growth of the population inside the tree. This observation is supported by the presence of more than 4 alleles per locus for some microsatellite markers at the tree level. Different results were observed by Zhou et al. [22] in Japan : (i) a very low genetic diversity was detected at the tree level, with 418 individuals (out of 420) presenting the same individual genotype on 14 trees sampled ; (ii) the genetic variability was more important between than within trees. This difference can be explained by (i) a technical limitation, owing to the small number of markers (only four) used in this study leading to a large variance of the statistics summarizing genetic variation; and by (ii) the loss of genetic diversity that generally occurs during invasion, resulting in lower genetic diversity in invasive populations than in native ones [66,67].
Finally, the various samples displayed significant genetic differences, highlighting the existence of a spatial genetic structure. Spatial differentiation exists at very short scale, with neighboring trees of Nebraska significantly differentiated. This suggests that the PWN dispersal, whether active or passive, can be spatially limited even at a short scale and that genetic drift may play an important role. Furthermore, both methods used in this study (Bayesian assignment and multivariate methods) inferred three clusters among the field samples analyzed. Each cluster consisted of individuals from different trees, reinforcing the existence of a genetic structure within and between trees. Different clusters were identified within trees scale (Missouri trees) suggesting that different beetles carrying genetically differentiated nematode populations infected a single tree. The individuals from the Nebraska trees, close to each other, were grouped in a single cluster. In addition, both Missouri trees exhibited the same two genetic clusters. These local genetic similarities probably result from efficient short distance dispersal mediated by the insect vector [68]. Some nematodes from Nebraska were also assigned to a cluster mainly formed by Missouri individuals (results of DAPC method) or presented hybrid genotypes between Nebraska and Missouri clusters (results of Bayesian method) despite the large geographical distance between them (more than 500 km). This result is an agreement with the potentially important role of the human-induced dispersal, already proposed in others studies on the PWN [69,70] and in other nematode species [71]. However, too few samples were used in this study to provide clear evidence of long-distance dispersal. With that respect, a hierarchical sampling scheme with nematodes sampled from various trees located in different groups of trees situated in different forests should be implemented. This would allow a precise assessment of the population genetic structure of the PWN to better determine the spatial range of nematode dispersal and the scale at which populations function.
Acknowledgments
We would like to thank Aure´lie Blin and Pedro Barbosa for helpful technical support, Douglas LeDoux and Julia Thompson (Missouri Department of Agriculture, USA), and Mark Harrell (Nebraska Forest Service, USA) for supplying the field isolates of B. xylophilus from Missouri and Nebraska, respectively.
Author Contributions
Performed the sampling: ME PV JE MM. Performed the experiments: SM CC ME PV JE. Analyzed the data: SM TG PCS. Contributed reagents/ materials/analysis tools: CC JE MM. Wrote the paper: SM TG PCS.
References
1. Hunt DJ (2008) A checklist of the Aphelenchoidea (Nematoda: Tylenchina). Journal of Nematode Morphology and Systematics 10: 99–135.
2. Dropkin VH, Foudin A, Kondo E, Linit MJ, Smith M, et al. (1981) Pinewood nematode : a threat to US forests? Plant Disease 65: 1022–1027.
3. Linit MJ (1988) Nematode - vector relationships in the pine wilt disease system. Journal of Nematology 20: 227–235.
4. Mamiya Y (1972) Pine wood nematode Bursaphelenchus lignicolus Mamiya and Kiyohara, as a causal agent of pine wilting disease. Review of Plant Protection Research 5: 46–60.
5. Naves PM, Camacho S, de Sousa EM, Quartau JA (2007) Transmission of the pine wood nematode Bursaphelenchus xylophilus through feeding activity of Monochamus galloprovincialis (Col., Cerambycidae). Journal of Applied Entomology
131: 21–25.
6. Sousa E, Bravo MA, Pires J, Naves P, Penas AC, et al. (2001) Bursaphelenchus xylophilus (Nematoda; Aphelenchoididae) associated with Monochamus galloprovin-cialis (Coleoptera; Cerambycidae) in Portugal. Nematology 3: 89–91. 7. Mamiya Y (1988) History of pine wilt disease in Japan. Journal of Nematology
20: 219–226.
8. Suzuki K (2002) Pine wilt disease - a threat to pine forest in Europe. Dendrobiology 48: 71–74.
9. Mamiya Y (1976) Pine wilt disease caused by the pine wood nematode, Bursaphelenchus lignicolus, in Japan. Japan Agricultural Research Quarterly 10: 206–211.
10. Mamiya Y (1983) Pathology of the pine wilt disease caused by Bursaphelenchus xylophilus. Annual Review of Phytopathology 21: 201–220.
11. Mota M, Braasch H, Bravo MA, Penas AC, Burgermeister W, et al. (1999) First report of Bursaphelenchus xylophilus in Portugal and in Europe. Nematology 1: 727– 734.
12. Fonseca L, Cardoso JMS, Lopes A, Pestana M, Abreu F, et al. (2012) The pinewood nematode, Bursaphelenchus xylophilus, in Madeira Island. Helmintholo-gia 49: 96–103.
13. Abelleira A, Picoaga A, Mansilla JP, Aguin O (2011) Detection of Bursaphelenchus xylophilus, causal agent of pine wilt disease on Pinus pinaster in Northwestern Spain. Plant Disease 95: 776.
14. Robertson L, Cobacho Arcos S, Escuer M, Santiago Merino R, Esparrago G, et al. (2011) Incidence of the pinewood nematode Bursaphelenchus xylophilus Steiner & Buhrer, 1934 (Nickle, 1970) in Spain. Nematology 13: 755–757.
15. Soliman T, Mourits MCM, van der Werf W, Hengeveld GM, Robinet C, et al. (2012) Framework for modelling economic impacts of invasive species, applied to pine wood nematode in Europe. PLoS ONE 7(9): e45505. doi:10.1371/ journal.pone.0045505.
16. Metge K, Burgermeister W (2008) Analysis of Bursaphelenchus xylophilus (Nematoda: Parasitaphelenchidae) provenances using ISSR and RAPD fingerprints. In: Mota M, Vieira P, editors. Pine wilt disease: a worldwide threat to forest ecosystems. pp. 175–186.
17. Tares S, Abad P, Bruguier N, de Guiran G (1992) Identification and evidence for relationships among geographical isolates of Bursaphelenchus spp. (pinewood nematode) using homologous DNA probes. Heredity 68: 157–164.
18. Valadas V, Barbosa P, Espada M, Oliveira S, Mota M (2012) The pinewood nematode, Bursaphelenchus xylophilus, in Portugal : possible introductions and spread routes of a serious biological invasion revealed by molecular methods. Nematology 00: 1–13.
19. Cheng XY, Cheng FX, Xu RM, Xie BY (2008) Genetic variation in the invasive process of Bursaphelenchus xylophilus (Aphelenchida: Aphelenchoididae) and its possible spread routes in China. Heredity 100: 356–365.
20. Jung J, Han H, Ryu SH, Kim W (2010) Microsatellite variation in the pinewood nematode, Bursaphelenchus xylophilus (Steiner and Buhrer) Nickle in South Korea. Genes & Genomics 32: 151–158.
21. Jung J, Han H, Ryu SH, Kim W (2010) Amplified fragment length polymorphism analysis and genetic variation of the pinewood nematode Bursaphelenchus xylophilus in South Korea. Animal Cells and Systems 14: 31–36. 22. Zhou ZH, Sakaue D, Wu BY, Hogetsu T (2007) Genetic structure of populations
of the pinewood nematode Bursaphelenchus xylophilus, the pathogen of pine wilt disease, between and within pine forests. Phytopathology 97: 304–310. 23. Valadas V, Laranjo M, Mota M, Oliveira S (2012) Molecular characterization of
Portuguese populations of the pinewood nematode Bursaphelenchus xylophilus using cytochrome b and cellulase genes. Journal of Helminthology: 1–10. doi : 10.1017/S0022149X12000673
24. Vieira P, Burgermeister W, Mota M, Metge K, Silva G (2007) Lack of genetic variation of Bursaphelenchus xylophilus in Portugal revealed by RAPD-PCR analyses. Journal of Nematology 39: 118–126.
25. Jones JT, Moens M, Mota M, Li HM, Kikuchi T (2008) Bursaphelenchus xylophilus: opportunities in comparative genomics and molecular host-parasite interactions. Molecular Plant Pathology 9: 357–368.
26. Kikuchi T, Cotton JA, Dalzell JJ, Hasegawa K, Kanzaki N, et al. (2011) Genomic insights into the origin of parasitism in the emerging plant pathogen Bursaphelenchus xylophilus. PLoS Pathog 7(9): e1002219. doi:10.1371/journal.-ppat.1002219.
27. Wingfield MJ, Blanchette RA, Nicholls TH, Robbins K (1982) The pine wood nematode: a comparison of the situation in the United States and Japan. Canadian Journal of Forest Research 12: 71–75.
28. Estoup A, Guillemaud T (2010) Reconstructing routes of invasion using genetic data: why, how and so what? Molecular Ecology 19: 4113–4130.
29. Luikart G, England PR (1999) Statistical analysis of microsatellite DNA data. Trends in Ecology & Evolution 14: 253–256.
30. Selkoe KA, Toonen RJ (2006) Microsatellites for ecologists: a practical guide to using and evaluating microsatellite markers. Ecology Letters 9: 615–629. 31. Malausa T, Gilles A, Meglecz E, Blanquart H, Duthoy S, et al. (2011)
High-throughput microsatellite isolation through 454 GS-FLX Titanium pyrose-quencing of enriched DNA libraries. Molecular Ecology Resources 11: 638–644. 32. Meglecz E, Costedoat C, Dubut V, Gilles A, Malausa T, et al. (2010) QDD: a user-friendly program to select microsatellite markers and design primers from large sequencing projects. Bioinformatics 26: 403–404.
33. Viglierchio DR, Schmitt RV (1983) On the methodology of nematode extraction from field samples : Baermann funnel modifications. Journal of Nematology 15: 438–444.
34. Yoder M, Tandingan De Ley I, King IW, Mundo-Ocampo M, Mann J, et al. (2006) DESS : a versatile solution for preserving morphology and extractable DNA of nematodes. Nematology 8: 367–376.
35. Castagnone C, Abad P, Castagnone-Sereno P (2005) Satellite DNA-based species-specific identification of single individuals of the pinewood nematode Bursaphelenchus xylophilus (Nematoda : Aphelenchoididae). European Journal of Plant Pathology 112: 191–193.
36. Dakin EE, Avise JC (2004) Microsatellite null alleles in parentage analysis. Heredity 93: 504–509.
37. Belkhir K, Borsa P, Chikhi L, Raufaste N, Bonhomme F (1996–2004) GENETIX 4.05, logiciel sous Windows TM pour la ge´ne´tique des populations. Laboratoire Ge´nome, Populations, Interactions, CNRS UMR 5000, Universite´ de Montpellier Montpellier (France).
38. Rousset F (2008) GENEPOP ’ 007: a complete re-implementation of the GENEPOP software for Windows and Linux. Molecular Ecology Resources 8: 103–106.
39. Benjamini Y, Hochberg Y (1995) Controlling the false discovery rate - a practical and powerful approach to multiple testing. Journal of the Royal Statistical Society Series B-Methodological 57: 289–300.
40. Sokal RR, Rohlf FJ (1995) Biometry. The Principles and Practice of Statistics in Biological Research. Third Edition edn. W.H. Freeman and Company, New York. pp 236–242.
41. Weir BS, Cockerham CC (1984) Estimating F-Statistics for the analysis of population structure. Evolution 38: 1358–1370.
42. Goudet J (2002) Fstat, a program to estimate and test gene diversities and fixation indices (version 2.9.3.2). : Available online http://www2.unil.ch/ popgen/softwares/fstat.htm
43. R Development Core Team (2012) R: A language and environment for statistical computing.: R Foundation for Statistical Computing, Vienna, Austria. ISBN 3-900051-07-0, URL http://www.R-project.org/.
44. Raymond M, Rousset F (1995) An exact test for population differentiation. Evolution 49: 1280–1283.
45. Excoffier L, Lischer HEL (2010) Arlequin suite ver 3.5: a new series of programs to perform population genetics analyses under Linux and Windows. Molecular Ecology Resources 10: 564–567.
46. Pritchard JK, Stephens M, Donnelly P (2000) Inference of population structure using multilocus genotype data. Genetics 155: 945–959.
47. Falush D, Stephens M, Pritchard JK (2003) Inference of population structure using multilocus genotype data: linked loci and correlated allele frequencies. Genetics 164: 1567–1587.
48. Evanno G, Regnaut S, Goudet J (2005) Detecting the number of clusters of individuals using the software structure: a simulation study. Molecular Ecology 14: 2611–2620.
49. Jombart T, Devillard S, Balloux F (2010) Discriminant analysis of principal components: a new method for the analysis of genetically structured populations. BMC Genetics 11: 94.
50. Jombart T (2008) adegenet: a R package for the multivariate analysis of genetic markers. Bioinformatics 24: 1403–1405.
51. He Y, Li HM, Brown DJF, Lamberti F, Moens M (2003) Isolation and characterisation of microsatellites for Xiphinema index using degenerate oligonucleotide primed PCR. Nematology 5: 809–819.
52. Leach M, Agudelo P, Lawton-Rauh A (2012) Genetic variability of Rotylenchulus reniformis. Plant Disease 96: 30–36.
53. Mulet K, Fargette M, Richaud M, Genson G, Castagnone-Sereno P (2011) Isolation of microsatellites from an enriched genomic library of the plant-parasitic nematode Meloidogyne incognita and their detection in other root-knot nematode species. European Journal of Plant Pathology 129: 501–505. 54. Picard D, Plantard O, Scurrah M, Mugnie´ry D (2004) Inbreeding and
population structure of the potato cyst nematode (Globodera pallida) in its native area (Peru). Molecular Ecology 13: 2899–2908.
55. Plantard O, Porte C (2003) Isolation and characterization of microsatellite loci in the sugar beet cyst nematode Heterodera schachtii. Molecular Ecology Notes 3: 139–141.
56. Thie´ry M, Mugnie´ry D (2000) Microsatellite loci in the phytoparasitic nematode Globodera. Genome 43: 160–165.
57. Beaumont MA, Zhang WY, Balding DJ (2002) Approximate Bayesian computation in population genetics. Genetics 162: 2025–2035.
58. Lombaert E, Guillemaud T, Cornuet JM, Malausa T, Facon B, et al. (2010) Bridgehead Effect in the Worldwide Invasion of the Biocontrol Harlequin Ladybird. PLoS ONE 5(3): e9743. doi:10.1371/journal.pone.0009743 59. Lombaert E, Guillemaud T, Thomas CE, Handley LJL, Li J, et al. (2011)
Inferring the origin of populations introduced from a genetically structured native range by approximate Bayesian computation: case study of the invasive ladybird Harmonia axyridis. Molecular Ecology 20: 4654–4670.
60. Miller N, Estoup A, Toepfer S, Bourguet D, Lapchin L, et al. (2005) Multiple transatlantic introductions of the western corn rootworm. Science 310: 992–992. 61. Guichoux E, Lagache L, Wagner S, Chaumeil P, LE´ Ger P, et al. (2011) Current trends in microsatellite genotyping. Molecular Ecology Resources 11: 591–611. 62. Karaiskou N, Primmer C (2008) PCR multiplexing for maximising genetic analyses with limited DNA samples: an example in the collared flycatcher, Ficedula albicollis. Annales Zoologici Fennici 45: 478–482.
63. Kim KS, French BW, Sumerford DV, Sappington TW (2007) Genetic diversity in laboratory colonies of western corn rootworm (Coleoptera : Chrysomelidae), including a nondiapause colony. Environmental Entomology 36: 637–645. 64. Coe TS, Hamilton PB, Griffiths AM, Hodgson DJ, Wahab MA, et al. (2009)
Genetic variation in strains of zebrafish (Danio rerio) and the implications for ecotoxicology studies. Ecotoxicology 18: 144–150.
65. Mamiya Y (1975) The life history of the pine wood nematode, Bursaphelenchus lignicolus. Japanese Journal of Nematology 5: 16–25.
66. Sakai AK, Allendorf FW, Holt JS, Lodge DM, Molofsky J, et al. (2001) The population biology of invasive species. Annual Review of Ecology and Systematics 32: 305–332.
67. Wares JP, Hughes AR, Grosberg RK (2005) Mechanisms that drive evolutionary change. In: Sax DF, Stachowicz JJ, Gaines SD, editors. Species Invasions: Insights into Ecology, Evolution and Biogeography. Sunderland, MA, USA: Sinauer Associates Inc. pp. 229–257.
68. Shibata E (1986) Dispersal movement of the adult Japanese pine sawyer, Monochamus alternatus Hope (Coleoptera, Cerambycidae) in a young pine forest. Applied Entomology and Zoology 21: 184–186.
69. Evans HF, McNamara DG, Braasch H, Chadoeuf J, Magnusson C (1996) Pest Risk Analysis (PRA) for the territories of European Union (as PRA area) on Bursaphelenchus xylophilus and its vectors in the genus Monochamus. OEPP/EPPO Bulletin 26: 199–249.
70. Robinet C, Roques A, Pan HY, Fang GF, Ye JR, et al. (2009) Role of human-mediated dispersal in the spread of the pinewood nematode in China. PLoS ONE 4(2): e4646. doi:10.1371/journal.pone.0004646.
71. Plantard O, Porte C (2004) Population genetic structure of the sugar beet cyst nematode Heterodera schachtii: a gonochoristic and amphimictic species with highly inbred but weakly differentiated populations. Molecular Ecology 13: 33– 41.