Molecular analysis of genetic diversity among
vine accessions using DNA markers
A.F. da Costa1, P.E. Teodoro2, L.L. Bhering2, F.D. Tardin3, R.F. Daher4,
W.F. Campos4, A.P. Viana4 and M.G. Pereira4
1Instituto Capixaba de Pesquisa, Assistência Técnica e Extensão Rural, Centro Regional de Desenvolvimento Rural, Centro Serrano,
Domingos Martins, ES, Brasil
2Laboratório de Biometria, Departamento de Biologia Geral, Universidade Federal de Viçosa, Viçosa, MG, Brasil
3Núcleo de Desenvolvimento de Cultivares, Embrapa Milho e Sorgo, Sinop, MT, Brasil
4Laboratório de Melhoramento Genético Vegetal,
Universidade Estadual do Norte Fluminense “Darcy Ribeiro”, Campos dos Goytacazes, RJ, Brasil
Corresponding author: P.E. Teodoro E-mail: eduteodoro@hotmail.com Genet. Mol. Res. 16 (2): gmr16029586 Received December 19, 2016
Accepted February 23, 2017 Published April 13, 2017
DOI http://dx.doi.org/10.4238/gmr16029586
Copyright © 2017 The Authors. This is an open-access article distributed under the terms of the Creative Commons Attribution ShareAlike (CC BY-SA) 4.0 License.
ABSTRACT. Viticulture presents a number of economic and social advantages, such as increasing employment levels and fixing the labor force in rural areas. With the aim of initiating a program of genetic improvement in grapevine from the State University of the state of Rio de Janeiro North Darcy Ribeiro, genetic diversity between 40 genotypes (varieties, rootstock, and species of different subgenera) was evaluated using Random amplified polymorphic DNA (RAPD) molecular markers. We built a matrix of binary data, whereby the presence of a band was assigned as “1” and the absence of a band was assigned as “0.” The genetic distance was calculated between pairs of genotypes based on the arithmetic complement
from the Jaccard Index. The results revealed the presence of considerable variability in the collection. Analysis of the genetic dissimilarity matrix revealed that the most dissimilar genotypes were Rupestris du Lot and Vitis rotundifolia because they were the most genetically distant (0.5972). The most similar were genotypes 31 (unidentified) and Rupestris du lot, which showed zero distance, confirming the results of field observations. A duplicate was confirmed, consistent with field observations, and a short distance was found between the variety ‘Italy’ and its mutation, ‘Ruby’. The grouping methods used were somewhat concordant.
Key words: Vitis sp.; Jaccard index; UPGMA; Tocher clustering method
INTRODUCTION
Vine belongs to the Vitaceae family, in which the Vitis genus is divided into two subgenera or sections: Euvitis and Muscadinia. The Euvitis subgenus includes more than 60 species established naturally in both tropical and temperate areas, and are known as true vines, with 2n = 2x = 38 chromosomes. On the other hand, the Muscadinia subgenus has only three species, Vitis munsoniana, Vitis popenoei, and Vitis rotundifolia, the latter being the main species. They have 2n = 2x = 40 chromosomes, and are exclusive to the southeastern United States and Mexico (Bruce and Pratt, 1996; Sousa, 1996; Pommer, 2002).
Viticulture presents a series of economic and social advantages, such as increasing the level of employment, besides fixing the labor force in rural areas. Correia and Silva (2001) noted that table grape needs approximately 799.3 days∙man-1∙ha-1 in the first year of
implantation and 1592.6 days∙man-1∙ha-1 from the second year, accounting for up to 6.4 annual
permanent jobs per hectare. In this context, we believe that the establishment of a genetic improvement program for vine, aiming to identifying genotypes adapted to the edaphoclimatic conditions of the Northern Fluminense region, can contribute to a greater diversification of agribusiness in this region, occupying areas previously cultivated with sugar cane.
In viticulture, it is normal to differentiate and identify cultivars, and to analyze diversity based on three techniques: ampelography, involving the description and characterization of organs; ampelometry, involving the study of leaves using linear and angular quantitative methods; and the analysis of chemical characteristics, such as the electrophoretic profiles of proteins (Liao et al., 1997; Boselli et al., 2000; Weihl and Dettweiler, 2000). However, these “non-molecular” tools can result in false attributions when used at the clonal level (Lopes et al., 1999; Imazio et al., 2002). In this sense, molecular markers have advantages for the analysis of genetic diversity, as they are not influenced by the environment, and in general, have epistatic or minimum pleiotropic or null effects (Hodgkin et al., 2001; Nuez et al., 2002).
In plant breeding, molecular markers can be used for various purposes. Random amplified polymorphic DNA (RAPD) markers are one of the most widespread markers applied to the breeding of several crops, due to their ease of use, speed, and low cost. They are used to estimate genetic distance between populations, and to characterize germplasm banks or collections (Han et al., 2014; Mendes et al., 2014; Asad et al., 2015; Costa et al., 2015; Santos et al., 2015; Sharaf-Eldin et al., 2015). This is also true for vine crops, and RAPD markers have been used in diversity studies, marker-assisted selection, in the distinction of varieties confirming and/or rejecting hypotheses of synonymy, determining distribution and relationships with geographic areas and other variables, and also for the study of natural processes of evolution,
migration, and selection (Moreno et al., 1995; Lahogue et al., 1998; Vidal et al., 1999, 2000; Tamhankar et al., 2001; Ulanovsky et al., 2002a; Schneider et al., 2015).
The aim of this study was to evaluate the molecular diversity in a collection of vine germplasm from the Center of Agricultural Sciences and Technologies of UENF, which is composed of 40 genotypes, including 13 varieties, nine hybrids, nine species, and nine rootstocks, via RAPD molecular markers.
MATERIAL AND METHODS
The study was conducted at the municipality of Campos dos Goytacazes, RJ. According to the Köppen classification system, the climate of the Northern Fluminense region is Aw, warm, and humid tropical, with a dry season in the winter and a rainy season in the summer, with annual precipitation around 1053 mm. Genotypes used in the study and their identification numbers are described in Table 1. Young leaves were selected from the plants, which were packed in foil with identification of each genotype, frozen in liquid nitrogen, and taken to the laboratory, where they were stored in an ultra-freezer at -70°C. DNA was extracted from young vine leaves using an extraction protocol described for species from the Vitis and Ampelosis genera (Lodhi et al., 1994).
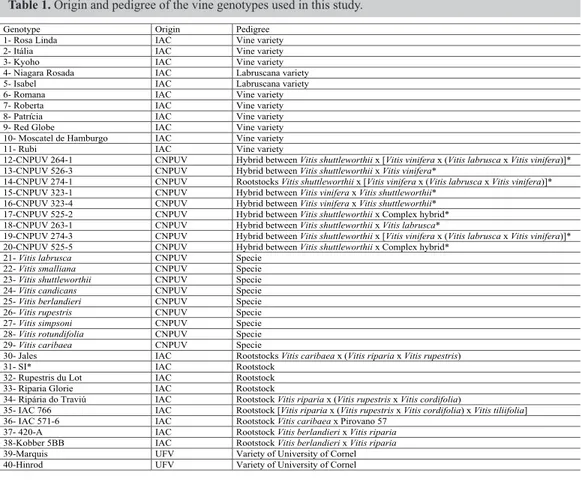
Table 1. Origin and pedigree of the vine genotypes used in this study.
Genotype Origin Pedigree
1- Rosa Linda IAC Vine variety
2- Itália IAC Vine variety
3- Kyoho IAC Vine variety
4- Niagara Rosada IAC Labruscana variety
5- Isabel IAC Labruscana variety
6- Romana IAC Vine variety
7- Roberta IAC Vine variety
8- Patrícia IAC Vine variety
9- Red Globe IAC Vine variety
10- Moscatel de Hamburgo IAC Vine variety
11- Rubi IAC Vine variety
12-CNPUV 264-1 CNPUV Hybrid between Vitis shuttleworthii x [Vitis vinifera x (Vitis labrusca x Vitis vinifera)]* 13-CNPUV 526-3 CNPUV Hybrid between Vitis shuttleworthii x Vitis vinifera*
14-CNPUV 274-1 CNPUV Rootstocks Vitis shuttleworthii x [Vitis vinifera x (Vitis labrusca x Vitis vinifera)]* 15-CNPUV 323-1 CNPUV Hybrid between Vitis vinifera x Vitis shuttleworthii*
16-CNPUV 323-4 CNPUV Hybrid between Vitis vinifera x Vitis shuttleworthii* 17-CNPUV 525-2 CNPUV Hybrid between Vitis shuttleworthii x Complex hybrid* 18-CNPUV 263-1 CNPUV Hybrid between Vitis shuttleworthii x Vitis labrusca*
19-CNPUV 274-3 CNPUV Hybrid between Vitis shuttleworthii x [Vitis vinifera x (Vitis labrusca x Vitis vinifera)]* 20-CNPUV 525-5 CNPUV Hybrid between Vitis shuttleworthii x Complex hybrid*
21- Vitis labrusca CNPUV Specie
22- Vitis smalliana CNPUV Specie
23- Vitis shuttleworthii CNPUV Specie
24- Vitis candicans CNPUV Specie
25- Vitis berlandieri CNPUV Specie
26- Vitis rupestris CNPUV Specie
27- Vitis simpsoni CNPUV Specie
28- Vitis rotundifolia CNPUV Specie
29- Vitis caribaea CNPUV Specie
30- Jales IAC Rootstocks Vitis caribaea x (Vitis riparia x Vitis rupestris)
31- SI* IAC Rootstock
32- Rupestris du Lot IAC Rootstock
33- Riparia Glorie IAC Rootstock
34- Ripária do Traviú IAC Rootstock Vitis riparia x (Vitis rupestris x Vitis cordifolia)
35- IAC 766 IAC Rootstock [Vitis riparia x (Vitis rupestris x Vitis cordifolia) x Vitis tiliifolia]
36- IAC 571-6 IAC Rootstock Vitis caribaea x Pirovano 57
37- 420-A IAC Rootstock Vitis berlandieri x Vitis riparia
38-Kobber 5BB IAC Rootstock Vitis berlandieri x Vitis riparia
39-Marquis UFV Variety of University of Cornel
The leaf tissues were macerated in a mortar containing liquid nitrogen. About 0.5 g of the macerated tissue from each genotype was placed in 15-mL Falcon tubes, and resuspended in 6.0 mL extraction buffer. Then, all tubes were vortexed to ensure to ensure the cap remained secure. The suspension was incubated in a water bath at 65°C for 25 min. During this incubation process, the tubes were gently inverted to facilitate homogenization of the solution. After the incubation period, the tubes were taken from the water bath and cooled to room temperature. Chloroform: ethanol (6 mL) was then added, and the tubes were gently inverted 20 to 25 times, to form an emulsion. Centrifugation was performed for approximately 15 min at 5500 rpm.
Next, 4 mL of the supernatant from each tube was transferred to a new labeled tube. Subsequently, 2 mL 5 M NaCl was added to the supernatant and mixed gently. At this point, 8 mL 95% ethanol (-20°C) was added. The tubes were incubated at -20°C for 2 h. After this period, the material was centrifuged for 5 min at 5000 rpm until a white precipitate had formed at the bottom of each tube. The supernatant was removed and the pellet transferred to 2-mL tubes. Each precipitate was washed with 76 and 95% ethanol to remove excess salt. The precipitate from each tube was then left at room temperature to dry for 15-20 min. The precipitate from each tube was resuspended in 200 mL TE (10 mM Tris-HCl, 1 mM EDTA, pH 8.0) containing RNAse at a final concentration of 40 mg/mL, and then incubated in a water bath at 37°C 30 min. At the end of this step, the DNA was suspended.
Extracted DNA was quantified by electrophoretic analysis on a minigel, and by using a spectrophotometer. The minigel was prepared with 0.8% agarose, TAE (Tris base, sodium acetate, 0.5 M EDTA, and distilled water) at 0.5 M ethidium bromide (3.5 mL for each 70 mL of gel). A solution containing 2 mL DNA from each genotype, 2 mL Blue Juice, and 8 mL TE were applied. A High DNA MASS Ladder, purchased from Invitrogen, was used as a DNA standard in a mixture of 2 mL plus 2 mL Blue Juice. After the electrophoresis was run at 80 V for 1 h 50 min in 0.5X TAE buffer, the gel was exposed to ultraviolet rays and immediately photographed using Eagle Eye II, Stratagene. Quantification was performed (at 260 and 280 nm) and DNA purity was evaluated (ratio between 260 and 280 nm) using a Spekol UV-VIS spectrophotometer from Zeiss. After the extracted DNA was quantified, all analyzed samples were diluted to 10 ng/mL.
Amplification reactions were performed in a final volume of 25 mL, and DNA polymorphisms were identified by assays performed on Perkin Elmer 9700 and 9600 thermocyclers, as described by Williams et al. (1990), with modifications. The reaction mixture contained the following: PCR buffer 10X, MgCl2 (25 mM), dATP, dCTP, dGTP, dTTP, and DNA Taq Polymerase (Pharmacia Biotech, USA), initiators Operon Technologies (Alameda, California) and Milli Q ultrapure water. Primers were selected and optimized using DNA samples from two genotypes (Itália and V. shuttleworthii). We tested 119 primers obtained from Operon Technologies (Alameda, California), most of which were selected based on existing literature (Williams et al., 1990). From these, only the primers that generated clear bands and those with the greatest number of polymorphisms among the tested genotypes were selected.
Amplification reactions for RAPD were performed according to the modified protocol established by Williams et al. (1990), in a final volume of 25 µL, containing 20 ng genomic DNA. Amplifications were performed in thermal cyclers (Perkin Elmer GeneAmp PCR System 9600 and 9700) programmed at 95°C for 1 min followed by 45 cycles of 1 min at 94°C, 1 min at 36°C, and 2 min at 72°C, and a final extension of 7 min at 72°C. The temperature of the samples was then reduced to 4°C. Amplification products were analyzed by agarose gel electrophoresis at 1.4%, visualized after ethidium bromide staining, (0.005%), and photodocumented in an ultraviolet light translucent (Eagle Eye II).
Using RAPD gel analysis, we built a matrix of binary data, whereby the presence of a band was assigned as “1” and the absence of a band was assigned as “0.” The genetic distance was calculated in pairs among the genotypes based on the arithmetic complement from Jaccard Index (cij) based on Equation 1:
1 - ij b c c a b c d + = + + +
where: a is the match number type 1-1 for each pair of accessions; b is the discordance number type 1-0 for each pair of genotypes; c is the discordance number type 0-1 for each pair of genotypes; d is the match number type 0-0 for each pair of genotypes. Based on the index, the optimization cluster method as proposed by Tocher and cited by Rao (1952) was used, as well as the unweighted pair-group average hierarchical method (UPGMA). All analyzes were performed using the Genes software (Cruz, 2013), following the procedures recommended by Cruz et al. (2012).
RESULTS AND DISCUSSION
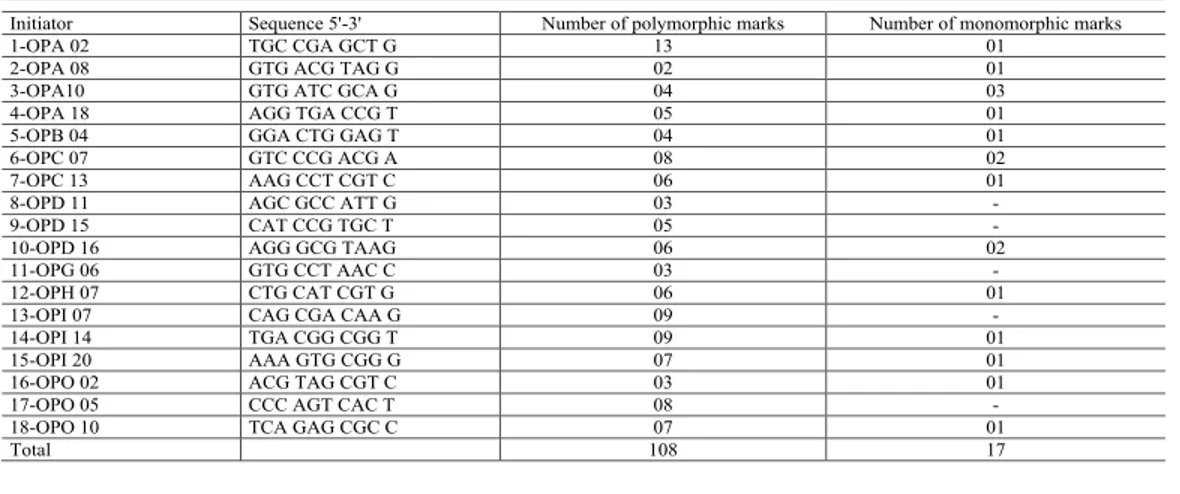
The concentration and purity of DNA obtained varied with respect to genotype. However, a high concentration of DNA was obtained, with a mean of 862.75 ng/µL and purity was within the desirable limit of 1.6 to 2.0 according to Lahogue et al. (1998). Of the 119 primers tested, the following 18 were selected: OPA 02, 08, 10, and 18; OPB 04; OPC 07, and 13; OPD 11, 15, and 16; OPG 06; OPH 07; OPI 07, 14, and 20; OPO 02, 05, and 10. In total, 108 polymorphic and 17 monomorphic marks were obtained, with OPA 02 being the most informative; 13 polymorphic marks and only one monomorphic mark were obtained (Table 2 and Figure 1). Tamhankar et al. (2001) analyzed the genetic diversity of important genotypes in India, and reported that in that study, the OPA 02 primer was the most informative, with 22 polymorphic marks, and was able to identify 32 genotypes. However, in a study characterizing vine varieties from two germplasm banks in Spain, Moreno et al. (1995) found OPA 02 to be inappropriate, since it was included in the group of primers that reported little or no polymorphism. However, it must be emphasized that in that study only varieties were used, whereas the present study and that of Tamhankar et al. (2001) also included rootstocks and different species.
Table 2. List of indicators used, with the respective base sequences and number of associated polymorphic and monomorphic marks.
Initiator Sequence 5'-3' Number of polymorphic marks Number of monomorphic marks
1-OPA 02 TGC CGA GCT G 13 01
2-OPA 08 GTG ACG TAG G 02 01
3-OPA10 GTG ATC GCA G 04 03
4-OPA 18 AGG TGA CCG T 05 01
5-OPB 04 GGA CTG GAG T 04 01
6-OPC 07 GTC CCG ACG A 08 02
7-OPC 13 AAG CCT CGT C 06 01
8-OPD 11 AGC GCC ATT G 03 -
9-OPD 15 CAT CCG TGC T 05 -
10-OPD 16 AGG GCG TAAG 06 02
11-OPG 06 GTG CCT AAC C 03 -
12-OPH 07 CTG CAT CGT G 06 01
13-OPI 07 CAG CGA CAA G 09 -
14-OPI 14 TGA CGG CGG T 09 01
15-OPI 20 AAA GTG CGG G 07 01
16-OPO 02 ACG TAG CGT C 03 01
17-OPO 05 CCC AGT CAC T 08 -
18-OPO 10 TCA GAG CGC C 07 01
A binary data matrix was constructed from the analyzed marks to obtain the genetic dissimilarity matrix, based on the arithmetic complement of the Jaccard Index. Analysis of the genetic dissimilarity matrix showed that the most dissimilar genotypes were 32 (Rupestris du Lot) and 28 (V. rotundifolia), because they presented the greatest distance (0.5972). These results are in agreement with the genealogy, since the genotype V. rotundifolia belongs to the Muscadinia subgenus and the other belongs to the subgenus Euvitis. The most similar genotypes were 31 (unidentified) and 32 (Rupestris du lot), which showed a distance of zero, confirming the field observations. Sample identification for genotype 31 was lost, and was subsequently named as “non-identifying material (31)” to avoid error. However, this phenotypic behavior was similar to that of genotype number 32. However, based on the phenotypic characteristics alone, we could not say that it was a duplicate, and this was confirmed by molecular analyses. These results are similar to those reported by Ulanovsky et al. (2002a, b), who were able to identify replicates between genotypes when using RAPD markers to characterize vine germplasm.
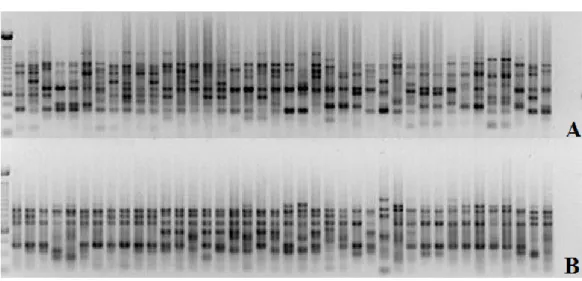
Two groups were initially formed using the Tocher method (Table 2). In group I, 39 genotypes belonging to the Euvitis subgenus were clustered, and in group II, only the V. rotundifolia (28) genotype, belonging to the Muscadinia subgenus was found. V. rotundifolia species (28) are important in germplasm collections because they are adapted to humid climates, in addition to being resistant to many diseases and pests. In this way, this species can serve as a source of genetic material for the improvement of cultivars and rootstocks (Bruce and Pratt, 1996). When the V. rotundifolia (28) genotype was removed from the analysis, group I was reclustered into five subgroups (Table 3), where I is the subgroup formed by rootstocks (31, 32, 34, 33, 38, 35, 37, 36, and 30) and two species, V. berlandieri (25) and V. rupestris (26), which is justifiable, since these two species are present in most of the crosses from which such rootstocks originated (Nogueira 1984; Sousa 1996). A second and large subgroup was formed with all cultivars, hybrids, and V. labrusca (21), V. shuttleworthii (23), and V. simpsoni (27) species. V. shuttleworthii (23) was part of all crosses that generated the EMBRAPA Figure 1. Electrophoretic analysis of the amplification products of genomic DNA from 40 vine genotypes using the OPI 07 (1a) and OPI14 (1b) primers.
hybrids, while V. labrusca was part of some of the crosses that originated the hybrids CNPUV 264-1 (12), CNPUV 274-1 (14), CNPUV 263-1 (18), and CNPUV 274-3 (19). Regarding the presence of the V. simpsoni (27) genotype in this group, it can be assumed that, because two of the hybrids [CNPUV 525-2 (17) and CNPUV 525-5 (20)], have one of the parents, complex hybrid not knowing for sure what crosses that gave rise to the same, V. simpsoni (27) may be one of his ancestors. The other three subgroups were formed by only one genotype each, these distinct species being V. caribaea (29), V. smalliana (22), and V. candicans (24), respectively, in subgroups III, IV, and V.
Table 3. Clusters of 40 genotypes grouped by the Tocher method, based on dissimilarity expressed by the Jaccard index arithmetic complement.
Group Genotypes
I 31, 32, 26, 34, 33, 38, 35, 25, 37, 36, 30, 29, 10, 7, 40, 39, 21, 3, 11 8, 2, 9, 6, 1, 13, 19, 15, 18, 5, 4, 12, 17, 14, 23, 16, 27, 20, 22, and 24
II 28
To better understand the results obtained in this study, it was of interest to regroup subgroup II, which originated 10 new subsubgroups. In these, the separation between hybrids (Table 4), species, and cultivars was verified. With the exception of genotypes 16 and 20, hybrids that formed independent subsubgroups (VIII and IX), were regrouped in subsubgroup III. V. labrusca (21), V. shuttleworthii (23), and V. simpsoni (27) formed three distinct sub-groups, respectively, VI, VII, and X. The cultivars gave rise to the largest number of subsubgroups out of four, with sub-group I formed by the genotypes Itália (2), Rubi (11), Patrícia (8), Moscatel de Hamburgo (10), Red Globe (9), Romana (6), and Kyoho (3), where the cultivars Itália (2) and Rubi (11) were very close, with the shortest intragroup distance. This is understandable since this is that mutation (Sousa, 1996).
Table 4. Subclusters of genotypes from group I of Table 1, grouped by the Tocher method, based on dissimilarity expressed by the Jaccard index arithmetic complement.
Group Genotypes I 31, 32, 26, 34, 33, 38, 35, 25, 37, 36 and 30 II 2, 11, 8, 10, 9, 6, 3, 7, 39, 40, 1, 19, 13, 15, 18, 12, 14, 5, 4, 17, 21, 23, 20, 16, and 27 III 29 IV 22 V 24
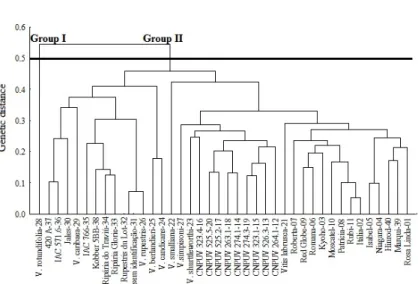
When using a cut-off point at a genetic distance of 0.5, it was possible to verify that the UPGMA cluster (Figure 2) was consistent with the Tocher cluster method in establishing the groups (Table 5).
The main contributions of this work to the genetic breeding of vines are the possibility of guiding the crosses to generate the segregating populations for high variability, a determining factor for gain in the selection of superior genotypes. However, in future studies, characters of agronomic interest should be evaluated so that the most promising crosses are predicted more accurately. In addition, in this study, two genotypes (31 and 32) were identified as duplicates, from which 31 (no identification) can be eliminated from future studies.
REFERENCES
Asad HA, Meah MB, Begum SN, Khalil MI, et al. (2015). Study of genetic variation of eggplant cultivars by using RAPD-PCR molecular markers and the relationship with Phomopsis blight disease reaction. Genet. Mol. Res. 14: 17007-17018. http://dx.doi.org/10.4238/2015.December.16.1
Boselli M, Corso C and Monaco A (2000). Ampelographic characterization of white grape varieties in Campania (Southern Italy) by multivariate analysis. Acta Hortic. 528: 75-81. http://dx.doi.org/10.17660/ActaHortic.2000.528.8
Bruce IR and Pratt C (1996). Grape. In: Janick J, Moore JN (Ed.). Fruit Breeding. 2nd edn. John Wiley, New York. Correia RC and Silva PCG (2001). Aspectos socioeconômicos da viticultura. In: Leão PCS (Ed.). Uva de mesa Produção
- Aspectos Técnicos. Embrapa Informação Tecnológica, Brasília.
Costa LS, Reiniger LRS, Heinzmann BM, Amaral LP, et al. (2015). Study of the genetic diversity and structure of a natural population of Nectandra megapotamica (Spreng.) Mez. using RAPD markers. Genet. Mol. Res. 14: 18407-18413.
http://dx.doi.org/10.4238/2015.December.23.28
Cruz CD (2013). Genes: a software package for analysis in experimental statistics and quantitative genetics. Acta Sci.
Agron. 35: 271-276. http://dx.doi.org/10.4025/actasciagron.v35i3.21251
Cruz CD, Carneiro PCS and Regazzi AJ (2012). Modelos biométricos aplicados ao melhoramento genético. 3rd edn. Editora UFV, Viçosa.
Figure 2. Dendrogram of genetic dissimilarity among 40 vine genotypes, established by unweighted pair-group average hierarchical method (UPGMA), using the arithmetic complement of the Jaccard index, based on the Random amplified polymorphic DNA (RAPD) marker matrix.
Table 5. Subclusters of genotypes from group I of Table 2, grouped by the Tocher method, based on dissimilarity expressed by the Jaccard index arithmetic complement.
Group Genotypes I 2, 11, 8, 10, 9, 6, and 3 II 4 and 5 III 15, 19, 13, 18, 17, 14, and 12 IV 39, 40 and 1 V 7 VI 21 VII 23 VIII 16 IX 20 X 27
Han J, Wang WY, Leng XP, Guo L, et al. (2014). Efficient identification of ornamental peach cultivars using RAPD markers with a manual cultivar identification diagram strategy. Genet. Mol. Res. 13: 32-42. http://dx.doi.org/10.4238/2014. January.8.2
Hodgkin T, De Vicente MC, Dudnik N and Hodgkin T (2001). Molecular methods in the conservation and use of plant genetic resources. Acta Hortic. 546: 107-118. http://dx.doi.org/10.17660/ActaHortic.2001.546.8
Imazio S, Labra M, Grassi F, Winfield M, et al. (2002). Molecular tools for clone identification: the case of cultivar ‘Traminer’. Plant Breed. 121: 31-535. http://dx.doi.org/10.1046/j.1439-0523.2002.00762.x
Lahogue F, This P and Bouquet A (1998). Identification of a codominant scar marker linked to the seedlessness character in grapevine. Theor. Appl. Genet. 97: 950-959. http://dx.doi.org/10.1007/s001220050976
Liao XR, Zhu XC and He PC (1997). Application of seed protein components in cluster analysis of Chinese Vitis plants.
J. Hortic. Sci. 72: 109-115. http://dx.doi.org/10.1080/14620316.1997.11515497
Lodhi MA, Ye GN, Weeden NF and Reisch BI (1994). A simple and efficient method for DNA extraction from grapevine cultivars and Vitis species. Plant Mol. Biol. Report. 12: 6-13. http://dx.doi.org/10.1007/BF02668658
Lopes MS, Sefc KM, Eiras Dias E, Steinkellner H, et al. (1999). The use of microsatellites for germplasm management in a Portuguese grapevine collection. Theor. Appl. Genet. 99: 733-739. http://dx.doi.org/10.1007/s001220051291
Mendes RFM, Araujo Neto RB, Nascimento MPSBC and Lima PSC (2014). RAPD analysis of the genetic diversity among accessions of Fabaceous forages (Poincianella spp) from the Caatinga. Genet. Mol. Res. 13: 5832-5839.
http://dx.doi.org/10.4238/2014.August.1.1
Moreno S, Gogorcena Y and Ortiz JM (1995). The use of RAPD markers for identification of cultivated grapevine (Vitis
vinifera L.). Sci. Hortic. (Amsterdam) 62: 237-243. http://dx.doi.org/10.1016/0304-4238(95)00784-Q
Nogueira DJP (1984). Porta-enxerto de videiras. Inf. Agropec. 10: 22-24.
Nuez F, Dias EE, Steinkellner H and Machado MLC (2002). Genómica y Mejora Vegetal. Editora Mundi- Prensa libros, Sevilla.
Pommer CV (2002). Videira. In: Bruckner C.H. Melhoramento de Fruteiras de clima temperado. Editora UFV, Viçosa. Rao CR (1952). Advanced statistical methods In: Biometric research. John Wiley, New York.
Santos MF, Damasceno-Silva KJ, Carvalhaes MA and Lima PSC (2015). Genetic variation detected by RAPD markers in natural populations of babassu palm (Attalea speciosa Mart.). Genet. Mol. Res. 14: 6124-6135. http://dx.doi. org/10.4238/2015.June.8.10
Schneider A, Carra A, Akkak A, This P, et al. (2015). Verifying synonymies between grape cultivars from France and Northwestern Italy using molecular markers. J. Grape Res. 40L: 197.
Sharaf-Eldin MA, Al-Tamimi A, Alam P, Elkholy SF, et al. (2015). Genetic relatedness of artichoke (Cynara scolymus L.) hybrids using random amplified polymorphic DNA (RAPD) fingerprinting. Genet. Mol. Res. 14: 18431-18439. http:// dx.doi.org/10.4238/2015.December.23.31
<bok>Sousa JSI (1996). Uvas para o Brasil. Editora FEALQ, Piracicaba.</bok>
Tamhankar SA, Patil SG and Rao VS (2001). Assessment of the genetic diversity of some important grape genotypes in India using RAPD markers. J. Grape. Res. 40: 157-161.
Ulanovsky S, Gogorcena Y, Toda FM and Ortiz JM (2002a). Use of molecular markers in detection of synonymies and homonymies in grapevines (Vitis vinifera L). Scien. Hort. 92: 241-254. http://dx.doi.org/10.1016/S0304-4238(01)00291-6
Ulanovsky S, Gogorcena Y, Toda FM and Ortiz JM (2002b). Characterisation of grapevine accessions at germplasm banks with RAPD and microsatellite markers. Acta Hortic. 546: 271-279.
Vidal JR, Coarer M and Defontaine A (1999). Genetic relationships among grapevine varieties grown in different French and Spanish regions based on RAPD markers. Euphytica 109: 161-172. http://dx.doi.org/10.1023/A:1003776716394
Vidal JR, Delavault P, Coarer M and Defontaine A (2000). Design of grapevine (Vitis vinifera L.) cultivar-specific SCAR primers for PCR fingerprinting. Theor. Appl. Genet. 101: 1194-1201. http://dx.doi.org/10.1007/s001220051597
Weihl T and Dettweiler E (2000). Differentiation and identification of 500 grapevine (Vitis L.) cultivars using notations and measured leaf parametrs. Acta Hortic. 528: 37-43.
Williams JG, Kubelik AR, Livak KJ, Rafalski JA, et al. (1990). DNA polymorphisms amplified by arbitrary primers are useful as genetic markers. Nucleic Acids Res. 18: 6531-6535. http://dx.doi.org/10.1093/nar/18.22.6531