HAL Id: hal-02133437
https://hal.archives-ouvertes.fr/hal-02133437
Submitted on 18 May 2019HAL is a multi-disciplinary open access
archive for the deposit and dissemination of sci-entific research documents, whether they are pub-lished or not. The documents may come from teaching and research institutions in France or abroad, or from public or private research centers.
L’archive ouverte pluridisciplinaire HAL, est destinée au dépôt et à la diffusion de documents scientifiques de niveau recherche, publiés ou non, émanant des établissements d’enseignement et de recherche français ou étrangers, des laboratoires publics ou privés.
River fluxes to the sea from the ocean’s 10Be/9Be ratio
Friedhelm von Blanckenburg, Julien Bouchez
To cite this version:
Friedhelm von Blanckenburg, Julien Bouchez. River fluxes to the sea from the ocean’s 10Be/9Be ratio. Earth and Planetary Science Letters, Elsevier, 2014, 387, pp.34-43. �10.1016/j.epsl.2013.11.004�. �hal-02133437�
Originally published as:
von Blanckenburg, F., Bouchez, J. (2014): River fluxes to the sea from the ocean’s 10Be/9Be
ratio. - Earth and Planetary Science Letters, 387, 1, 34-43
River fluxes to the sea from the ocean’s
10Be/
9Be ratio
Friedhelm von Blanckenburga, * and Julien Bouchezb
aEarth Surface Geochemistry, Helmholtz Centre Potsdam GFZ German Research Centre for Geosciences, Telegraphenberg, 14473 Potsdam, Germany
*Communicating author. [email protected]. Also at: Institute of Geological Sciences, Freie Universität Berlin, Germany. c present address: Institut de Physique du Globe de Paris, 1 rue Jussieu, 75232 Paris 05, France
Earth Planet Sci Letters 2014, 387:34-43; doi 10.1016/j.epsl.2013.11.004
Abstract
The ratio of the meteoric cosmogenic radionuclide 10Be to the stable isotope 9Be is proposed here to be a flux proxy of terrigenous input into the oceans. The ocean’s dissolved 10Be/9Be is set by (1) the flux of meteoric 10Be produced in the atmosphere; (2) the denudational flux of the rivers discharging into a given ocean basin; (3) the fraction of 9Be that is released from primary minerals during weathering (meaning the 9Be transported by rivers in either the dissolved form or adsorbed onto sedimentary particles and incorporated into secondary oxides); and (4) the fraction of riverine 10Be and 9Be actually released into seawater. Using published 10Be/9Be data of rivers for which independent denudation rate estimates exist we first find that the global average fraction of 9Be released during weathering into river waters and their particulate load is 20% and does not depend on denudation rate. We then evaluate this quantitative proxy for terrigenous inputs by using published dissolved seawater Be isotope data and a compilation of global river loads. We find that the measured global average oceanic dissolved 10Be/9Be ratio of about 0.9×10⁻⁷ is satisfied by the mass balance if only about 6% of the dissolved and adsorbed riverine Be is eventually released to the open ocean after escaping the coastal zone. When we establish this mass balance for individual ocean basins good agreement results between 10Be/9Be ratios predicted from known river basin denudation rates and measured ocean 10Be/9Be ratios. Only in the South Atlantic and the South Pacific the 10Be/9Be ratio is dominated by advected Be and in these basins the ratio is a proxy for ocean circulation. As the seawater 10Be/9Be ratio is faithfully recorded in marine chemical precipitates the 10Be/9Be ratio extracted from authigenic sediments can now serve to estimate relative changes in terrigenous input into the oceans back through time on a global and on an ocean basin scale.
1. Introduction
The 10Be/9Be isotope ratio combines the meteoric cosmogenic radionuclide 10Be (T1/2 = 1.39 Myr), deposited onto the Earth's surface by precipitation, with its stable counterpart 9Be, released from rocks by weathering. Given this combination, the 10
Be/9Be ratio in seawater is sensitive to continental denudation rates. The average residence time of Be in seawater being only ca. 600-1000 years, the ratio differs between ocean basins (e.g. Bourlès et al., 1989; Brown et al., 1992; Frank et al., 2009; Kusakabe et al., 1990; von Blanckenburg et al., 1996). Correspondingly, dissolved 10Be/9Be ratios in seawater are lowest in the Mediterranean Sea, a small ocean basin dominated by high terrigenous input and limited exchange with the global ocean; and highest in the Pacific, which collects a large flux of meteoric 10Be over its vast surface area while receiving comparatively low terrigenous input given the size of the ocean basin. It has been proposed that the 10Be/9Be ratio extracted from authigenic marine sediments, recording the surrounding seawaters’ 10Be/9Be ratio, traces continental denudation back through time (Bourlès et al., 1989; von Blanckenburg and O'Nions, 1999; Willenbring and von Blanckenburg, 2010a). To date only very coarse (My) time resolution records of paleo-denudation over the last 10 My were reconstructed (Willenbring and von Blanckenburg, 2010a). When applied at higher time resolution the method will allow to evaluate changes in denudation rate as a function of Quaternary climate shifts. Ultimately, the temporal resolution is limited only by the residence time of Be in the respective ocean basin, and by the resolution of the sedimentary record.
A geochemical framework suited to explore how erosion and weathering set the 10
Be/9Be ratio of soils and rivers was suggested recently by von Blanckenburg et al. (2012). A river drainage basin’s denudation rate can be calculated by measuring the 10
Be/9Be ratio of the dissolved Be or reactive Be carried by rivers (meaning adsorbed or bound to secondary oxyhydroxide precipitates) provided that the flux of meteoric 10
Be into this basin and the concentration of 9Be in bedrock are known, and that the fraction of 9Be released from primary minerals during weathering can be estimated. The 9Be thus released and the meteoric 10Be deposited onto the continents are delivered through riverine transport to the oceans, where they mix with 10Be deposited directly onto the ocean surface. Aeolian input only plays a minor role for the modern oceanic 9Be budget (von Blanckenburg et al., 1996; Willenbring and von Blanckenburg, 2010a). After entry into the ocean, particle-reactive Be can be captured in estuaries and shelf areas (Brown et al., 1992; Kusakabe et al., 1991) and at ocean margins (Anderson et al., 1990; Lao et al., 1992). Yet these sites of scavenging are also sites of release of reactive metals from shelf and slope sediments during diagenetic reactions and pore fluid expulsion (Arsouze et al., 2009; Jeandel et al., 2011). Dissolved Be that reaches the open ocean is entrained by the gyres of the major ocean basins that have the remarkable ability to homogenise this isotope ratio despite the reactive nature of Be and the high scavenging intensity at
the ocean margins (Igel and von Blanckenburg, 1999). For example, in the Pacific Ocean the Be is mixed to such an extent that the 10Be/9Be ratio exhibits a 13% dispersion only, calculated from measured surface water ratios, despite input 10Be/9Be ratios spanning a range of up to five orders of magnitude (von Blanckenburg and Igel, 1999). At the scale of an ocean basin, Be with a uniform 10Be/9Be ratio is then delivered to deep waters, where 9Be is present at relatively invariant concentrations of 30 pM (Kusakabe et al., 1990). Given that the deep ocean residence time is about 600-1000 years (Kusakabe et al., 1990; von Blanckenburg et al., 1996) this Be compartment is characterized by 10Be/9Be ratios that are distinct between ocean basins but that are more or less uniform within a basin (Kusakabe et al., 1990).
Considering this proxy’s considerable potential as tracer for terrigenous erosion and weathering, it is timely to develop means for the translation of present and past 10Be/9Be ratios to global estimates of the transfer of terrigenous matter into the oceans. The aim of this contribution is therefore 1) to determine, using global river denudation and oceanic 10Be/9Be data, the terrigenous input fluxes of these two isotopes into the global oceans, as well as into individual ocean basins; 2) to provide estimates of the fractional release of this metal into the dissolved form once delivered into the oceans; 3) to explore the fidelity of the oceanic 10Be/9Be ratio as a quantitative proxy for past terrigenous inputs to the ocean when extracted from authigenic marine sediments. We do this by combining published dissolved 10Be/9Be data from all ocean basins with estimates of the terrigenous fluxes of Be into these basins.
2. The oceanic Be isotope mass balance
The first aim of this study is to characterise the 10Be/9Be ratio established in the oceans following transfer of terrigenous 9Be and 10Be via rivers and the addition of meteoric 10Be deposited directly onto the ocean’s surface (Figure 1). We follow the terminology of von Blanckenburg et al. (2012): (10Be/9Be)diss is the isotope ratio of Be
dissolved in river waters (Bediss); and (10Be/9Be)reac is the isotope ratio of reactive Be
(Bereac), adsorbed onto the particulate load of rivers and contained in Be-rich
secondary phases, such as Fe-Mn oxihydroxides. Provided the contact time between river water and river particles is sufficiently long, (10Be/9Be)reac and (10Be/9Be)diss
equilibrate during riverine transport to a common ratio as shown previously (von Blanckenburg et al., 2012). In a given river and at steady-state, this ratio is:
[ ]
(
Be)
diss Be reac parent Be riv diss reacD
Be
f
f
F
Be
Be
Be
Be
9 9 10 9 9 10 9 10+
⋅
⋅
=
=
(1)where
F
riv10Be describes the atmospheric flux of meteoric 10Be onto the river basin (in atoms m-2 yr-1; note that in von Blanckenburg et al. (2012) we call this fluxF
met10Be), D the river basin’s denudation rate that comprises both physical erosion and chemical weathering (in kg m-2 yr-1), [9Be]parent is the mean 9Be concentration of the riverbasin’s parent rock (in atoms kg-1 or mol kg-1), and
f
reac9Be+ f
diss9Be is the fraction of 9Be released during weathering from the parent rock, meaning the fraction of 9Be that is ultimately available for mixing with dissolved 10Be. Hereafter we callf
reac9Be+ f
diss9Be the mobile fraction of 9Be. We assume for simplicity that the remainder of the 9Be, which is locked in primary minerals, does not enter the oceanic Be cycle. Therefore, the terrigenous Be finally available for release and mixing in seawater is supplied either in the reactive form (Bereac) as borne by the solid erosional load of rivers or in thedissolved form (Bediss) in river water. However, not all mobile Be is ultimately
delivered to the open ocean, as in the coastal ocean reactive Be might be deposited with the particles that carry this Be. The fraction of reactive Be thus trapped might differ from the fraction of reactive Be carried by rivers, as reactive and dissolved Be can exchange upon entry in the oceans. We represent the efficiency of overall Be delivery to the open ocean by a fractional factor φdel that is identical for both isotopes.
Essentially, φdel quantifies the fraction of riverine mobile Be surviving the sink
provided by the estuaries and the coastal interface. Once in dissolved form in the open ocean, all Be from the continents is rapidly homogenised with the meteoric 10Be deposited directly onto the surface oceans. The average dissolved 10Be/9Be ratio of an ocean basin, termed (10Be/9Be)oc, can be calculated as follows:
[ ]
[ ]
(
)
[ ]
[ ]
(
riv del reac riv del diss)
riv diss del riv reac del riv riv Be oc oc oc
A
E
Be
Q
Be
Be
Q
Be
E
A
F
A
Be
Be
9 9 10 10 9 10 10⋅
⋅
+
⋅
⋅
⋅
⋅
⋅
+
⋅
⋅
⋅
+
⋅
=
φ
φ
φ
φ
(2)where
F
oc10Be is the flux of meteoric 10Be deposited onto the ocean surface (in atoms m-2 y-1) averaged over Aoc, the surface area of the ocean (in m2), Eriv is the averageerosion rate (in kg m-2y-1) for the river basins discharging into the ocean, Ariv is the
total surface area of these basins (in m2), and Qriv is the total runoff of these rivers (in
ms-1). [10Be]reac, and [9Be]reac are the flux-weighted average reactive 10Be and 9Be
concentrations in the river sediments, while [10Be]diss, and [9Be]diss are the
flux-weighted average dissolved 10Be and 9Be concentrations of rivers draining to the ocean. At steady-state, the amount of meteoric 10Be delivered by rivers to the ocean is equal to that deposited onto the continental surface drained by those rivers:
[ ]
[ ]
(
)
Be riv riv diss riv reac riv rivE
Be
Q
Be
A
F
A
⋅
⋅
10+
⋅
10=
⋅
10 (3)where
F
riv10Beis averaged over Ariv. The steady-state flux of this continental 10Be to theocean does not depend on denudation rate. First, the amount of in situ-produced 10Be carried by solid river loads is negligible as compared to the amount of meteoric 10Be. Second, if steady state between sediment production and sediment export is indeed attained, large-scale storage of sediment in continental alluvial deposits does
not result in net trapping of 10Be. Hence, regardless of Eriv and Qriv and the amount of
sediment stored in alluvial deposits, eventually all 10Be precipitated is quantitatively transported to the oceans. However, if the residence time during alluvial storage is significant relative to the half-life of 10Be (1.39 Myr), some of the 10Be might decay before reaching the ocean. We ignore the effect of this radioactive decay as it amounts to a maximum error of only 2% onto the ocean 10Be/9Be ratio if all terrigenous 10Be had decayed before reaching the ocean (corresponding to the maximum proportion of ocean 10Be supplied by rivers, which is Ariv/(Ariv+Aoc)× φdel).
Similarly for 9Be:
Ariv⋅ Eriv⋅
[ ]
9Be reac+ Qriv⋅ 9 Be[ ]
diss(
)
= Ariv⋅ Driv⋅ 9 Be[ ]
parent⋅ freac 9 Be+ f diss 9 Be(
)
(4)where Driv is the average denudation rate in the basin drained by rivers flowing to the
ocean, and
f
reac9Be+ f
diss9Be
, the mobile fraction of 9Be, is averaged over these river basins. Substituting equations (3) and (4) in equation (2) the final equation describing (10Be/9Be)oc, conceptually illustrated in Figure 1, is:
[ ]
(
Be)
diss Be reac parent riv del Be riv del Be oc riv oc ocD
Be
f
f
F
F
A
A
Be
Be
9 9 10 10 9 9 10+
⋅
⋅
⋅
⋅
+
⋅
=
φ
φ
(5)Equation (5) can also be applied to large endorheic river basins, with Aoc then
representing the lake area. If the lake area is small relative to the river basin area (Aoc << Ariv), then equation (5) simplifies to equation (1). When applied to a large
endorheic basin, the authigenic phase of sediment precipitated into the lake would record delivery of 9Bereac and 9Bediss into the lake (equation (5)).
3. The modern ocean budget of Be
3.1 Data sourcesWe compare modelled (10Be/9Be)oc calculated from published estimates of the source
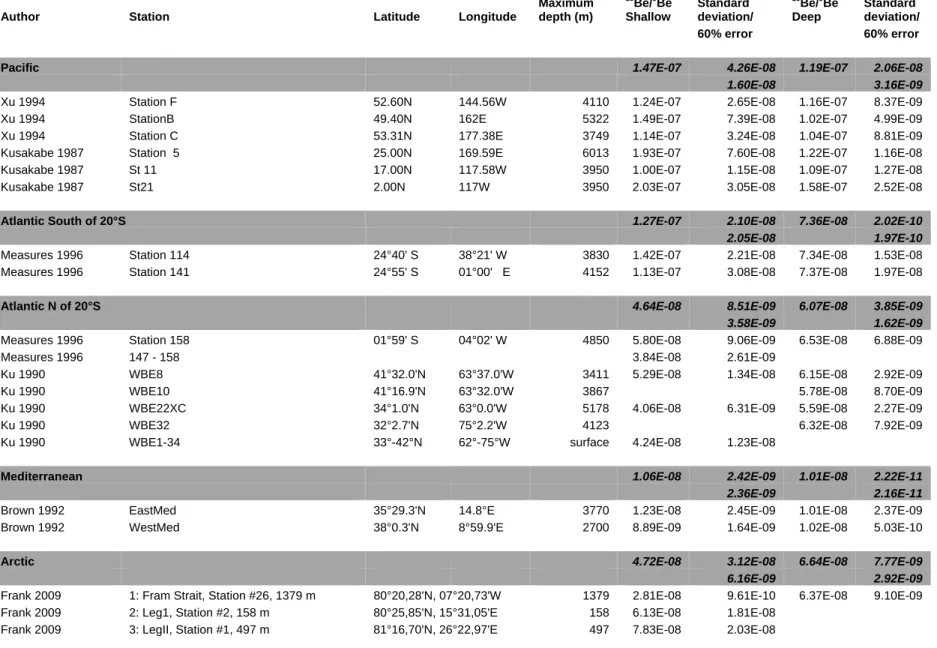
fluxes as defined in equation (5) with 10Be/9Be ratios published for dissolved Be in modern seawater. We do not use 10Be/9Be ratios measured on the surface scrapings of hydrogenetic Fe-Mn crusts (e.g. (von Blanckenburg et al., 1996)) given that these integrate over several 105 years, a timescale over which the terrigenous fluxes of 9Be might have changed relative to the modern riverine fluxes used here. Seawater Be isotope concentrations were measured in the North Pacific (Kusakabe et al., 1987; Xu, 1994), in the Atlantic (Measures et al., 1996), in the Mediterranean Sea (Brown et al., 1992), and in the Arctic Ocean (Frank et al., 2009). (Table S1, Supplement S1). 10Be and 9Be concentrations are strongly depth-dependent and follow a
nutrient-type depth-profile in most ocean basins (Kusakabe et al., 1990), which means that concentrations of dissolved Be are low at the surface after uptake onto particles and increase with depth as Be is released from sinking particles. Although the 10Be/9Be ratio is not depth-dependent to the same extent, it also varies with depth, given that most 10Be is delivered to the surface ocean through direct precipitation, whereas the deep water 10Be/9Be ratio is influenced by advection of Be via the thermohaline circulation. Therefore, we group our data into “shallow water”, comprising all measurements up to 1000 m depth, essentially thermocline water, and “deep water”, comprising all measurements between 1000 m water depth and the seafloor. No dissolved Be has been measured to date in the Indian Ocean. We instead use the 10Be/9Be ratio measured on leachates of deep ocean surface sediments from the Indian Ocean (Bourlès et al., 1989), assumed to represent the isotopic composition of modern bottom waters. The ocean basin averages are summarised in Table 1. Weighting the Be isotope data by ocean basin area, we obtain a global ocean 10Be/9Be ratio of 0.97 ± 0.20 × 10⁻⁷ for shallow water, and 0.84 ± 0.08 × 10⁻⁷ for deep water, respectively.
We next compare these measured oceanic 10Be/9Be ratios with (10Be/9Be)oc predicted
by equation (5). We use the following fluxes.
F
oc10Be andF
riv10Beare based on the global flux distribution of Willenbring and von Blanckenburg (2010b). This map is an average of the model distributions maps of Field et al. (2006) and Heikkilä et al. (2008). We extract an ocean basin-specificF
oc10Be and, for simplicity, use the same value for the flux of meteoric 10Be onto the river basins discharging into that ocean basinF
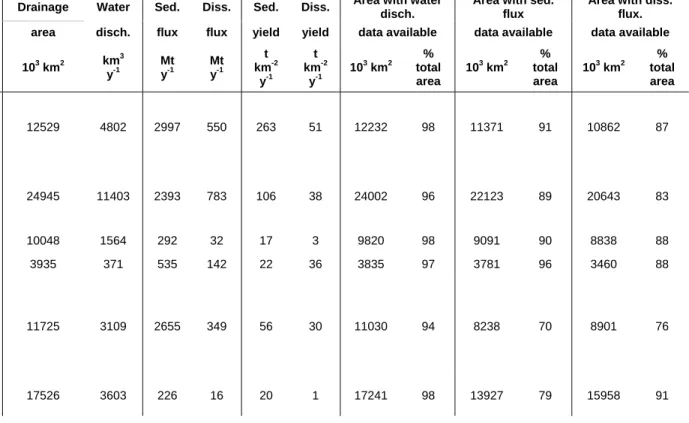
riv10Be given that the meteoric flux varies mainly as a function of latitude and thus is similar between the oceans and the adjacent continental area (Table 1). The flux of riverine material to the ocean is more than 20 times greater than the atmospheric dust flux, and it is likely that the former dominates the marine chemistry of beryllium, similar to numerous other elements dissolved in seawater (Oelkers et al., 2012). We compiled the denudational flux of solid and dissolved matter discharged into each ocean basin from the global river flux database of Milliman and Farnsworth (2011) (Supplement S2). The data covers a global exhoreic basin area (global Ariv) of 84.3 × 10⁶ km2, which is lower than the estimate ofPeucker-Ehrenbrink (2009). We calculate the denudation rate D for continental areas draining into each ocean basin and for the global ocean by summing up all suspended and dissolved loads of the individual rivers draining into a particular basin, and by dividing the obtained flux by the corresponding drainage area. We obtain a global sediment yield of 147 t km-2 y-1 and a global dissolved yield of 36 t km-2 y-1, corresponding to an annual global sediment delivery to the oceans of 12.4 × 10⁹ t and a global dissolved flux of 3 × 10⁹ t. Correcting the dissolved flux for cyclic salts would change the estimates of Driv by only a small amount, given the predominance of the particulate
over the dissolved flux. The surface areas used and fluxes calculated are summarised in Table 1. As no modern ocean 10Be/9Be data is available for the South Pacific, we present the global denudation estimate both including and excluding the
South Pacific. The difference introduced into the global denudation flux is small as Ariv in the South Pacific is only 10% of that of the North Pacific (Table 1). We confirm
previous analyses (von Blanckenburg et al., 1996; Willenbring and von Blanckenburg, 2010a) that the Be input through dust into the oceans is most likely lower than a few percent of the total 9Be input (Supplement S3). Finally, for calculating input fluxes, we used [9Be]parent of 2.5 ppm as a reasonable estimate of
the mean land surface lithologies (von Blanckenburg et al., 2012). In order to predict a global (10Be/9Be)oc ratio using equation 5, we are left with two unknowns: the mobile
fraction of 9Be
f
reac9Be+ f
diss9Be and the fractional delivery of mobile Be from the ocean margins into the open ocean, φdel.3.2 The mobile fraction of 9Be
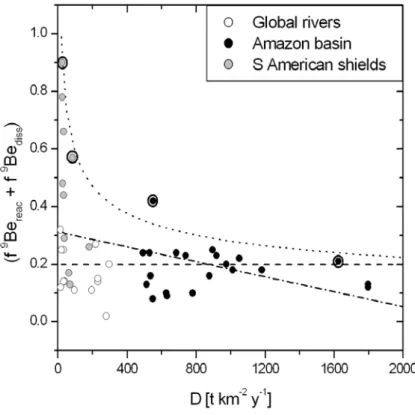
We use the river Be isotope data base from von Blanckenburg et al. (2012) and solve equation (1) for each river for the mobile fraction of 9Be
f
reac9Be+ f
diss9Be (Figure 2). The set of rivers used in this calculation is representative of a large variety of lithologic, climatic, and tectonic regimes. When excluding the rivers draining the highly weathered cratonic rocks (most likely over-represented in our data set by several rivers draining the South American shields), the global rivers appear to share a common mobile fraction of 9Be of 0.18 ± 0.08. When including those rivers draining shield rocks, we obtain an average mobile fraction of 9Be of 0.24 ± 0.18. We use a rounded global mobile fraction of 9Be of 0.2, meaning that 20% of the Be contained within the rocks is liberated by weathering. Given that in granitoid rocks Be is contained in highly weatherable minerals such as plagioclase and biotite (Grew, 2002), this value might appear surprisingly low. However, on a global scale, silicate lithologies are dominated by clastic sedimentary rocks (Amiotte-Suchet et al., 2003), in which Be will be contained in minerals such as muscovite and illite, that readily survive continental weathering.3.3 The fractional delivery of terrigenous Be into the open ocean
As the behaviour of Be in estuarine and shelf areas is not yet fully understood, no a-priori estimate is possible for the fractional delivery factor φdel. We thus first solve
equation (5) for the global value of φdel by using a mobile fraction of 9Be of 0.2 in
conjunction with the global denudational fluxes, meteoric 10Be fluxes, and areas described in the previous section, and later compare the calculated global φdel value
with those reported for other reactive metals. A global deep ocean (excluding the South Pacific for lack of ocean Be data) model (10Be/9Be)oc of 0.88 × 10⁻⁷, similar to
the measured ratio (Table 1), is obtained if φdel has a value of 0.063 ± 0.036. The
uncertainty of this estimate is presented in Appendix 1. This φdel value means that
6.3% of both 10Be and the 9Be entering the oceans from the continents, either in the dissolved or in the reactive form, are eventually released into the open ocean gyres in the dissolved form, where they mix with the additional 10Be deposited onto the oceans via direct precipitation. φdel does not describe the processes that scavenge
10Be precipitated directly into the open oceans, termed boundary scavenging processes (Anderson et al., 1990; Lao et al., 1992). Instead φdel quantifies removal of
Be at those sites at which the 10Be and 9Be isotopes derived from the continents are not yet homogenised with the 10Be originating from direct precipitation into the oceans. Where the oceans 10Be/9Be ratio is already homogenised (Igel and von Blanckenburg, 1999) boundary scavenging of Be does not affect the oceans 10Be/9Be ratio.
We can now compare the derived global delivery factor φdel with previous studies on
other metals. Commonly, the delivery factor to the ocean has been reported relative to the total riverine (i.e. including primary minerals, secondary precipitates, and dissolved) elemental flux to the ocean, whereas φdel in our study quantifies the
fractional delivery of dissolved and reactive Be only. From our results, a total riverine Be global delivery factor of 1.2% can be calculated from φdel ×
(
)
Be diss Be reac
f
f
9+
9 . This value would not change even if primary minerals released some of their 9Be in the seawater. Oceanic release of 9Be from primary minerals would shift(
f
reac9Be+
f
diss9Be)
in the mass balance to higher values at the cost of reduced φdel. The 1.2% valuecompares well with the global delivery factor estimated for the rare earth element neodymium, a similarly reactive element, for which 3-5% transfer to the open ocean is calculated (Arsouze et al., 2009). Rempfer et al. (2011) found that 6% of the ocean Nd is supplied via direct river discharge. About 10% of the riverine iron flux, another particle-reactive element, survives estuarine loss (Raiswell, 2006). 3-5% of Th, a very particle-reactive element, was estimated to be dissolved from continental input (Roy-Barman et al., 2002).
3.4 The riverine flux into individual ocean basins traced by their 10Be/9Be ratio
The accuracy of our global ocean mass balance cannot be fully evaluated as φdel
remains an adjustable variable. However, assuming that the global delivery factor
φdel and the uniform mobile fraction of 9Be (0.2) across different rivers are valid for
each separate ocean basin, we can test our approach for internal consistency by applying the model expressed by equation (5) on a basin-by-basin case. In this case the widely varying denudation rates contributing to the individual basins as well as their range of Ariv/Aoc ratios should be reflected in the individual basins’ (10Be/9Be)oc.
The assignment of the associated continental drainage areas is documented in Supplement S2. To perform this test we separate the global ocean into the North Pacific basin including the South China and the Bering Sea, the South Pacific (south of the equator), the North Atlantic including the North Sea and the Caribbean, the South Atlantic (separated from the N Atlantic at 5° S, as the surface ocean circulation system results in a distinct 10Be/9Be domain south of this latitude, (McDonald and Wunsch, 1996)), the Mediterranean (excluding the Black Sea, as we assume minimal exchange of Be between these two basins), the Indian Ocean including the Mallaca Strait, North-Eastern Australia, and the seas of South-East Asia which are assumed
to deliver most of the terrigenous input into the Indian Ocean via the Indonesian throughflow. We summed up Ariv for the individual drainage basins of Milliman &
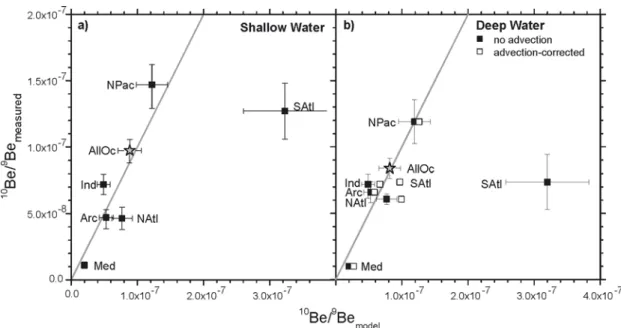
Farnsworth (2011). The results of the model are given in Table 1, and the comparison to measured shallow and deep water 10Be/9Be ratios is shown in Figure 3.
The model predicts low (10Be/9Be)oc values for the North Atlantic and the
Mediterranean Sea reflecting their high denudational input, and the Arctic ocean, reflecting its small Aoc and low
F
metoc10Be
. For the Indian Ocean, despite its high inputs caused by a high denudation rate of 400 t km-2 y-1, only intermediate model (10Be/9Be)oc values are predicted given that its large Aoc also results in a high 10Be
input. The North Pacific displays the highest model (10Be/9Be)oc ratios. Only the South
Pacific, for which no measured Be data exists, is predicted to feature an even higher (10Be/9Be)oc of 9.8 × 10⁻⁷, given its very small Ariv/Aoc ratio and hence its minor
terrigenous input (Table 1).
Using the global estimates for φdel of 0.063 and a mobile fraction of 9Be of 0.2 we
obtain excellent agreement between modeled and measured 10Be/9Be seawater ratios for the North Pacific, the Indian, the North Atlantic, the Arctic Ocean and the Mediterranean Sea for both shallow and deep water (Figure 3). Only the South Atlantic does not match the predictions. There, the model predicts much higher (10Be/9Be)oc than observed in either shallow or deep water, although the agreement is
slightly better for shallow water. This misfit can be explained by the low denudation rate in basins surrounding the southern Atlantic and the small associated Ariv, which
makes the seawater isotope composition extremely sensitive to lateral inputs through ocean circulation. We quantify the effect of advection of deep and shallow water by means of a simple flux-based steady-state mixing model (Supplement S4). For each ocean basin we take the river-sourced fluxes of 10Be and 9Be and the meteoric flux
Be oc
F
10 based on the parameters of Table 1. To these we add advective fluxes based on water mass transport between basins (Ganachaud and Wunsch, 2000), and on the measured 9Be concentrations and 10Be/9Be ratios of Be dissolved in water. We then calculate ratios for the mixture between the denudation and advective inputs (10Be/9Be)mixture (Figure 5). The deep water of the South Atlantic is essentially amixture of North Atlantic Deep Water and Antarctic Bottom and Intermediate Water. Therefore, its isotope ratio is dominated by those of the northern Atlantic (0.6 × 10⁻⁷) and the Pacific (1 × 10⁻⁷). The South Atlantic (10Be/9Be)
mixture is indeed closer to the
measured value (Figure 3). We can expect a similar situation for the Southern Pacific, for which no dissolved Be data exists. 10Be/9Be ratios from surface scrapings of Fe-Mn crusts (von Blanckenburg et al., 1996) are actually around 1 × 10⁻⁷, much lower than the prediction of the denudation-based (10Be/9Be)oc, 9 × 10⁻⁷ (Table 1),
4. Exploring past changes in terrigenous weathering and
erosion using sedimentary
10Be/
9Be ratios
To demonstrate that 10Be/9Beratios from the authigenic phase of sediment can trace terrigenous inputs back through time we first discuss the ocean input processes that the 10Be/9Be ratio actually quantifies, then evaluate whether this signal is transmitted unmodified through the coastal trap, and finally assess its potential to record changes in denudation rates.
4.1 The sedimentary 10Be/9Be ratio: a proxy for denudation, for weathering, or for Be delivery through the coastal zone?
For 10Be/9Be ratios to faithfully record denudation rates, the first condition is that a roughly uniform and constant mobile 9Be fraction is delivered by rivers into the coastal zone, meaning that at the ocean basin scale
f
reac9Be+ f
diss9Be does not change with D. For the large river scale we have already shown that this condition is fulfilled (see section 3.2), as most global rivers share a common mobile fraction of 9Be of 0.2. This observation is further discussed in section 4.2. We have also shown previously that in large rivers (10Be/9Be)reac and (10Be/9Be)diss likely equilibrate to a roughlysimilar ratio (von Blanckenburg et al., 2012). Hence globally both (10Be/9Be)reac and
(10Be/9Be)diss of Be delivered to the coastal zone essentially record D. For ocean
10Be/9Be ratios to faithfully record fluxes of continental inputs to the sea, another requirement is that φdel does not depend on those inputs. We have evidence that this
condition is fulfilled between the different ocean basins as variations of 10Be/9Be ratios between ocean basins primarily reflect differences in their denudational fluxes and not in φdel (section 3.4).
These observations suggest that Be behaviour in rivers and coastal ocean is uniform and independent on D. We invoke two different scenarios that can be regarded as end member pathways for Be delivery to the open ocean to account for these observations. Importantly, these scenarios have different implications for the interpretation of sedimentary 10Be/9Be ratios in terms of past continental input to the seas.
A first possibility is that only dissolved Be from the continents eventually enters the open ocean. Such a coastal bypass process has been shown for some of the rivers draining into the Arctic Ocean (Frank et al., 2009). In this case the fraction of total 9Be delivered φ del × ( Be diss Be reac
f
f
9+
9 ) is essentially identical tof
diss9Be in rivers. This scenario is not entirely unlikely as from our results, a total riverine Be delivery fraction of 1.2% was calculated (section 3.3) which is comparable with the values forf
diss9Be of 2-3% measured in the Amazon river (Table 2 in von Blanckenburg et al. (2012)). In this case the ocean 10Be/9Be ratio directly reflects the chemical weathering flux of 9Be into the oceans, i.e. the release flux of 9Be from primary minerals minus the uptake flux into the reactive fraction during weathering. At constantf
reac9Be+
f
diss9Be andf
diss9Be,the ocean 10Be/9Be ratio then reflects the ocean basin-wide denudation flux D. One prediction from this scenario is that changes in continental weathering back through time should be instantaneously transmitted into shifts in the ocean 10Be/9Be ratio. We know of such a behaviour for Nd, of which the radiogenic isotope ratios change abruptly over glacial - interglacial time scales (Burton and Vance, 2000; Gourlan et al., 2010; Wilson et al., 2012).
A perhaps more realistic version of this first scenario is that the partitioning between Bediss and Bereac occurs to some extent through adsorption-desorption processes in
rivers and coastal ocean. Therefore, the value of φdel should be a function of this
partitioning, which in turn depends on particle density and the particle-water partition coefficient
K
dBe (Supplement S5). One might suspect that through changing sediment delivery to the coastal ocean, φdel is a function of D itself. However, global river datashow that river particle concentration and D are not correlated (Milliman and Farnsworth, 2011). Furthermore, even if D and particle concentration in the coastal ocean were positively correlated,
K
dBeitself depends in an inverse way on particle concentration, an effect known as “particle concentration effect” (Hawley et al., 1986). These two effects largely compensate each other (Supplement S5, see also sensitivity analysis below). Hence the ocean 10Be/9Be ratio still reflects the ocean basin-wide weathering flux.The second scenario features co-precipitation of Be as a significant removal process in rivers and in the coastal ocean. Such co-precipitation might occur if Be is, for example, quantitatively scavenged with Fe(III)oxyhydroxides upon entry in the coastal ocean. Studies on estuarine scavenging of 9Be for example used flux balances in which it was assumed that over short time scales, scavenging in estuaries and at ocean boundaries removes riverine 9Be almost quantitatively, given the highly reactive nature of Be at near-neutral pH (Kusakabe et al., 1990; Kusakabe et al., 1991). However, over longer time scales, we expect that some of the scavenged Be is released. Early diagenetic processes on the shelves, for example those coupled to the iron redox cycle, can result in fast precipitation-dissolution cycles over which a minute fraction of Bereac leaks into seawater as 9Bediss. Such
scavenging and release processes are similar to what has been termed boundary exchange (Arsouze et al., 2009; Lacan and Jeandel, 2005; Wilson et al., 2012): the extent of this Be leak sets the value of φdel. In this case ocean 10Be/9Be ratios reflect
the flux of mobile (reactive plus dissolved) 9Be delivered by rivers to the coastal ocean. As mobile 9Be is dominated by sediment-borne reactive Be (Table 2 in von Blanckenburg et al. (2012)), 10Be/9Be ratios reflect the ocean basin-wide denudation flux D as transmitted by the sedimentary flux into the coastal ocean. However, this signal is likely to be damped in the past 10Be/9Be record, depending on the time scale of release of scavenged Be. This time scale is not straightforward to estimate, ranging from years if pore fluid expulsion from coastal sediments into the overlying water column is the major Be release process, to kiloyears if release is dominated by shelf instability during sealevel lowstands. However, significant variations in the Nd
isotopes record over glacial-interglacial cycles suggest that such a damping, if any, does not completely smooth the source signal.
4.2. Precision of paleo-D estimates
We have seen that for individual ocean basins the modern (10Be/9Be)oc can be
predicted from independent estimates of D to within a factor of two (Figure 3). We envisage this accuracy as applicable only to the determination of absolute rates of paleo-D from past 10Be/9Be ratios as some of the mismatch might be caused by inaccurate estimates of the suspended and dissolved river fluxes used, in addition to inaccuracies inherent to the proxy itself. Our ability to reconstruct past relative fluctuations in D in a given ocean basin is not impaired by these systematic inaccuracies, but rather requires examination of the potential sources of error inherent to the 10Be/9Be proxy, that we now present.
First, some of this bias might be introduced through ocean circulation, which is quantifyable and hence correctable. This correction was done in a very simple way in section 3.4 but can potentially be performed more accurately by use of general circulation models including tracer transport (e.g.Rempfer et al., 2011).
More importantly the precision of paleo-D is limited by the precision at which we know the paleo-10Be production
F
10Be, which in turn depends on variations in the geomagnetic field strength (Carcaillet et al., 2004), as we assume that shorter-term fluctuations caused by changes in solar modulation are averaged out (Willenbring and von Blanckenburg, 2010b). In principle, variations in paleo-F
10Be can be corrected using geomagnetic paleo-intensity records. However, large discrepancies in both amplitude and temporal variability have been reported between different geomagnetic paleo-intensity records (Channell et al., 2009; Valet et al., 2005; Ziegler et al., 2011). Moreover, unexplained discrepancies exist when comparing marine sediment 10Be records with different paleo-intensity records (Christl et al., 2010; Frank et al., 1997; Knudsen et al., 2008). For the case that past 10Be/9Be ratios can be determined on sedimentary sequences with extremely good age control, and if variations in paleo-F
10Be are also known accurately for this time interval, the error introduced byF
10Be will be small. In all other cases, this error depends on both the integration time of the sediment sample and on the potential offset between the age models of the 10Be/9Be and geomagnetic intensity records. We use thepaleo-Be
F
10 record of Christl et al. (2010) to quantify this error (Figure 5). We find that at low integration time (a few ky) the possible deviation from the actual F10Be amounts to 3 to 17%, depending on the offset between the age models. At high integration time scale (> 50 ky) errors are small and amount to 2 to 5%, as most fluctuations inF
10Beare averaged out (Figure 5).
The fidelity of the proxy further depends on the condition that the parameters used to convert ocean 10Be/9Be ratios into D are not themselves strong functions of D. These
parameters are Ariv and Aoc, φdel and
Be diss Be reac
f
f
9+
9 . The ratio Aoc/Ariv in equation (5)shifts from 4.3 in interglacials to 3.4 at low-sealevel in glacials (François et al., 1998). This shift results in a small uniform offset in the relationship between (10Be/9Be)oc and
D amounting to an offset of ca. 20 t km-2 y-1 in D (Figure 6) relative to the modern global average (Table 1). This offset can be corrected for by using the global sealevel curve. The maximum potential dependence of φdel on D can be expressed as a
function of sediment delivery to the coastal ocean (see Supplement S5), where sediment delivery is assumed to vary proportionally to D. As explained in section 4.1, during times of high D increase in particle concentration is compensated by the resulting lowering of the partition coefficient of Be between the reactive and dissolved phases (following Hawley et al.,(1986)). The difference between the constant- and D dependent-φdel scenarios results roughly in an offset D of roughly ± 20 t km-2 y-1. For
the dependence of
f
reac9Be+ f
diss9Be on D, an upper extreme case in the form of a power law fit through the upper data envelope of rivers shown in Figure 2 can be calculated, which is likely an overestimate. Errors of ± 20 to ± 100 t km-2 y-1 result. Using a lower and an upper bound for the measured oceans 10Be/9Be ratio, (0.7 to 1.5 × 10⁻⁷, Table 1), and assuming that the sources of errors (inF
10Be, Ariv and Aoc, φdel, andBe diss Be reac
f
f
9+
9 ) do not compound each other, an overall uncertainty of ca. 20-30% can be estimated on past relative variations in D (for D being similar to the modern value).Finally, changes in the relative contribution of lithologies with different [9Be]parent can
affect the oceanic 10Be/9Be. Li and Elderfield (2013) have recently suggested that weathering from volcanic islands decreased in the late Neogene, whereas weathering of felsic continental rocks simultaneously increased. Keeping a given ocean basins 10Be/9Be ratio constant over the same period (Willenbring and von Blanckenburg, 2010a) would require the fortuitous case that the product of D × [9Be]parent ×
(
)
9 9 Be diss Be reacf
f
+
× φdel resulting from the terrigenous input into that basinremained constant. As [9Be]parent is 5 times lower in basalts than in continental felsic
rocks (von Blanckenburg et al., 2012), this condition is only met if 9Be in basalt is completely released from primary volcanic rocks during subaerial weathering or in seawater (Oelkers et al., 2012). In this case
(
f
reac9Be+
f
diss9Be)
is 1 and the product [9Be]parent ×(
)
9 9 Be diss Be reacf
f
+
is identical between basaltic and felsic settings. Unless an equivalent change in φdel occurs between lithologies, variations in D or their absenceare indeed reflected in the oceanic 10Be/9Be ratios. However, the near-neutral pH of rivers draining basaltic lithologies likely results in exceedingly low riverine [9Be]diss,
and, once released from primary minerals, all Be will be carried in the reactive form. For basalt weathering to influence the oceanic 10Be/9Be ratio at all, a further requirement is hence that Bereac is released in seawater. This might not be the case if
all reactive Be is locked into secondary clays. In that case the oceanic 10Be/9Be ratio records paleo-D of felsic continental rocks only.
5. Potential Applications
The advantage of this new 10Be/9Be proxy lies in its ability to quantitatively determine relative variations in past denudation rate from the authigenic phase of marine sediment. In this regard the proxy provides fundamental advantages over the commonly used radiogenic or stable isotope proxies that do not provide any direct information on fluxes. These estimates can be determined on a range of temporal resolution, from a minimum of 600 y (residence time of Be in) to 1 My (low sedimentation rates such as found in Fe-Mn crusts). They can be estimated to a maximum age of 10 My (limited by about 7 half-lives of 10Be). They can be determined for the global ocean, at sites where seawater is representative of the global composition, such as the circum-Antarctic area, and for individual basins, where the 10Be/9Be ratio is controlled only by the local denudational input. At sites where advection of water strongly alters the dissolved Be budget, the 10Be/9Be ratio is rather a proxy for ocean circulation. Today this is the case in the South Atlantic and the South Pacific. Finally, the approach can also be applied to large endorheic river basins.
The uncertainty at which relative variations in an ocean basin's paleo-10Be/9Be ratio can be converted into relative estimates in paleo-D depends mainly on the quality of the age model and knowledge of the paleo-10Be flux over this interval (amounting to an error of 3-17%). The accuracy of this conversion further depends on the simultaneous variations in sealevel, in the fraction of Be escaping the coastal trap and the fraction of 9Be released upon primary mineral dissolution. At the current state of knowledge, they add a likely uncertainty of 20 to 30%. The largest improvements in this new method will arise from improvements of past 10Be flux variations as function of magnetic field strength, and from studies that explore the sensitivity of the oceanic 10Be/9Be ratio on boundary exchange of Be as is currently explored for other tracers within the “Geotraces” program (Jeandel et al., 2011).
Acknowledgements. We are grateful to Martin Frank, Marcus Christl, and one
anonymous reviewer for their careful and constructive reviews that led to a major refinement of the presentation of the proposed proxy.
Appendix 1. The uncertainty of the modern
φ
delvalue
The absolute uncertainty on the global value of φdel is determined by propagating the
individual uncertainties of the parameters in equation 5. An uncertainty for the (10Be/9Be)oc ratio of ± 0.1 × 10⁻⁷ is used, reflecting the typical difference between
shallow and deep water data (Table 1). We contend that
F
oc10Be andF
riv10Beare associated with an uncertainty of 20% as inferred from the typical differences between the local meteoric 10Be fluxes from Field et al. (2006) and Heikkilä et al. (2008) (see also Willenbring and von Blanckenburg (2010b). The mobile fraction of9Be
f
reac9Be+ f
diss9Be is known ± 0.08 (see section 3.2). As the area of global exhoreic basins Ariv is notoriously difficult to assess, we use as uncertainty the differencebetween the estimate made here from the database of Milliman and Farnsworth (2011) and that of Peucker-Ehrenbrink (2009), which amounts to 15%. We use an uncertainty on [9Be]parent of ± 0.5 ppm (von Blanckenburg et al., 2012). We estimate
the uncertainties associated with denudational fluxes (Milliman and Farnsworth, 2011) to be around 20%. While this analysis emphasises the need to obtaining estimates of φdel with high-fidelity we note that these systematic uncertainties do not
affect estimates in relative changes of paleo-denudation rate from paleo-(10Be/9Be)oc.
Instead it is the way these parameters potentially change with D that affect paleo-D estimates. These uncertainties were calculated in section 4.2.
Supplementary Material:
Supplement S1: Compilation of seawater dissolved 10Be/9Be ratios Supplement S2: Denudation rate summary
Supplement S3: Estimating ocean dust input
Supplement S4: Calculating the effect of ocean water advection on a basins 10Be/9Be ratio
Supplement S5: An adsorption model for estimating te dependence of 9Be delivery (φdel) on sediment flux in the coastal zone
Table 1: Modeled and measured ocean 10Be/9Be ratios
Measured 10Be/9Be ocean data (average and standard deviation) are derived from individual seawater profiles (Supplementary Table S1). Ariv and Driv are calculated
from global suspended and dissolved river loads (Milliman and Farnsworth, 2011) as given in Supplementary Table S2. Model (10Be/9Be)oc is calculated using a global
f
reac9Be+ f
diss9Be of 0.2, a global φdel of 0.063, and the basins specific Be ocF
10 =F
riv10Be as extracted from global flux maps (Willenbring and von Blanckenburg, 2010b).(1) Indian ocean 10Be/9Be data is from the authigenic phase of surface sediment samples (Bourlès et al., 1989) as no seawater data is available for this basin.
(2) Uncertainties on model (10Be/9Be)oc do not contain systematic errors of model
parameters to avoid obscuring inter-basin differences; only the 20% uncertainty for the basins Driv was propagated.
(3) Uncertainties of the average measured 10Be/9Be ratios given are one standard error multiplied with Student’s t-factor at the 60% confidence level.
(4) Measured global ocean 10Be/9Be ratios were calculated on an area-weighted basis (Supplement S1). Not using ocean volume instead adds only a minor uncertainty as only very few water profiles exist for 10Be/9Be, where their low number introduces the largest uncertainty on the global average.
Ocean Basin Aoc Ariv Driv
Be oc riv
F
10, (10Be/9Be)oc model ± 2 measured10Be/9Be ± 3 measured 10Be/9Be ± 3
km2 km2 t km-2 y-1 kmatoms -2 y-1 Shallow Deep
North Pac >0° 8.30 × 10⁷ 1.25 × 10⁷ 314 1.20 × 10¹⁶ 1.23 × 10⁻⁷ 2.45 × 10⁻⁸ 1.47 × 10⁻⁷ 1.6× 10⁻⁸ 1.19 × 10⁻⁷ 3.2 × 10⁻⁹ South Pac < 0° 9.40 × 10⁷ 1.27 × 10⁶ 380 1.00 × 10¹⁶ 9.37× 10⁻⁷ 1.87 × 10⁻⁷ North Atlantic 4.80 × 10⁷ 2.49 × 10⁷ 144 1.20 × 10¹⁶ 7.93 × 10⁻⁸ 1.59 × 10⁻⁸ 4.64 × 10⁻⁸ 3.6 × 10⁻⁹ 6.07 × 10⁻⁸ 1.6 × 10⁻⁹ South Atlantic 4.10 × 10⁷ 1.00 × 10⁷ 49 8.00 × 10¹⁵ 3.24 × 10⁻⁷ 6.48 × 10⁻⁸ 1.27 × 10⁻⁷ 2.1 × 10⁻⁸ 7.36 × 10⁻⁸ 2.0 × 10⁻¹⁰ Indian1 7.40 × 10⁷ 1.41 × 10⁷ 406 8.00 × 10¹⁵ 5.04 × 10⁻⁸ 1.01 × 10⁻⁸ 7.20 × 10⁻⁸ 1.3 × 10⁻⁹ 7.20 × 10⁻⁸ 1.3 × 10⁻⁹ Arctic 1.70 × 10⁷ 1.75 × 10⁷ 36 4.00 × 10¹⁵ 5.45 × 10⁻⁸ 1.09 × 10⁻⁸ 4.7 × 10⁻⁸ 6.2× 10⁻⁹ 6.6 × 10⁻⁸ 2.9 × 10⁻⁹ Mediterranean 2.50 × 10⁶ 3.94 × 10⁶ 163 1.00 × 10¹⁶ 2.05 × 10⁻⁸ 4.11 × 10⁻⁹ 1.1 × 10⁻⁸ 2.4 × 10⁻⁹ 1.0 × 10⁻⁸ 2.2 × 10⁻¹¹ All Oceans4 3.60 × 10⁸ 8.43 × 10⁷ 184 9.67 × 10¹⁵ 1.11 × 10⁻⁷ 2.22 × 10⁻⁸ 9.71 × 10⁻⁸ 9.4 × 10⁻⁹ 8.38 × 10⁻⁸ 3.0 × 10⁻⁹ All Oceans4 without S Pac 2.66 × 10⁸ 8.31 × 10⁷ 181 9.57 × 10¹⁵ 8.42 × 10⁻⁸ 1.68 × 10⁻⁸ 9.71 × 10⁻⁸ 9.4 × 10⁻⁹ 8.38 × 10⁻⁸ 3.0 × 10⁻⁹
Figures
Figure 1: Cartoon showing the fluxes of 9Be and 10Be. The parameters defined in equation (5) are coloured in the cartoon and in the color version of the equation shown here, with the exception of
f
reac9Be+ f
diss9Be.Figure 2: The mobile fraction of 9Be shown as a function of denudation rate D for the rivers used in the global 10Be/9Be compilation of von Blanckenburg et al. (2012). Open symbols: (10Be/9Be)diss measured in the dissolved load of rivers where D is from
river loads (Milliman and Farnsworth, 2011). Closed and grey symbols: (10Be/9Be)reac
measured on the reactive phase of Amazon river and tributary sediment, where D is from in situ-produced cosmogenic nuclides (data sources as in von Blanckenburg et al. (2012)). Closed symbols: Andean tributaries and Amazon main stream. Grey symbols: Rivers draining shield areas of which the significance for a global relationship between D and the mobile fraction of 9Be is unclear. Three fits are shown that describe the relationship between D and the mobile fraction of 9Be. Dashed line: a mean fraction of mobile 9Be that is 0.2 ± 0.08 (this value excludes shield rivers); dashed-dotted line: linear fit through all data, where the mobile fraction of 9Be = D[t km-2 y-1] x -0.00013 + 0.31; dotted curve: power law fit through upper envelope of data (four points denoted by circles), where the mobile fraction of 9Be = 2.6 x D[t km -2 y-1]-0.32. These fits are used in Figure 6 to evaluate how the oceans 10Be/9Be should change with a change in global denudation.
Figure 3: Measured mean ocean basin dissolved 10Be/9Be ratios against the ratio modeled using equation (5) (Table 1). a) “Shallow water” averages dissolved Be measurements from samples up to 1000 m depth; b) “Deep water” samples from beneath 1000 m. Closed symbols: individual basin results where the model ratio is based solely on the denudational Be input. Open symbols in b): model data comprises the effects of both denudational Be input and deep water advection from an adjacent basin (Figure 4, Supplement S4). Grey star: ocean basin area-weighted measurements and model (10Be/9Be)oc for the global oceans without the southern
Pacific. For the Indian Ocean no dissolved Be data are available: in this case the ratio from leachates of modern surface sediments (Bourlès et al., 1989) was used instead. All modeled values were calculated using a global river mobile fraction of 9Be of 0.2 and φ
del of 0.063. Uncertainties of measured 10Be/9Be ratios are one
standard error of means of individual seawater depth profiles. As uncertainties of
F
riv10Be,F
metoc 10Be
, [9Be]parent, the mobile fraction of 9Be, and φdel are assumed to be
mostly systematic, meaning they affect all ocean basins to a similar extent, propagating them into individual modelled basins (10Be/9Be)oc would only obscure
differences. Hence we only propagate the uncertainty on the individual basins’ denudational flux Driv, estimated to be approximately 20%.
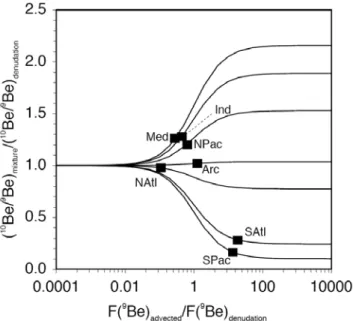
Figure 4. Sensitivity of oceanic 10Be/9Beratios to advection of water masses from an adjacent ocean basin. Here, for each ocean basin, a mixture of a (10Be/9Be)oc ratio
based only on terrigenous inputs ((10Be/9Be)denudation, corresponding to (10Be/9Be)oc in
equation (5), values in Table 1) and an input from adjacent ocean basins is calculated following a simple binary mixture equation (see Supplement S4). The resulting ratio (10Be/9Be)mixture depends on the 10Be/9Be ratio of the water advected
and on the flux of the advected Be F(9Be)advected, as compared to the flux of the
denudational Be F(9Be)denudation. For each ocean basin, the 10Be/9Be would shift along
a curve with a changing ratio F(9Be)advected/ F(9Be)denudation. The present status of each
ocean basin is shown by black squares. On the left-hand side of the diagram, where F(9Be)advected/F(9Be)denudation is < 1, (10Be/9Be)mixture is not strongly modified by
advection of water, as the advective Be flux is too low. In these basins, changes in D can be evaluated. On the right-hand side of the diagram, where the curves are steep, (10Be/9Be)oc is sensitive to the strength of advection of water, as the advective Be flux
overwhelmes the denudational flux. In these basins, changes in the strength of deep water circulation result in changes of F(9Be)advected and (10Be/9Be)oc becomes sensitive
to changing deep water circulation. For the apparently flat curves (e.g. the Arctic basin) (10Be/9Be)oc set by the basins denudation rate is identical to the ratio of the
water mass potentially advected into the basin. Here changes in advection will not modify the 10Be/9Be ratio regardless of the advective strength.
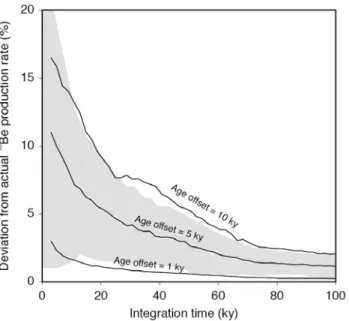
Figure 5. Illustration of the uncertainty introduced by past variations in F10Bethat are caused by variations in the magnetic field strength into estimates in relative changes of past D from (10Be/9Be)oc extracted from the authigenic phase of ocean sediment.
To be used as a proxy for D, paleo-(10Be/9Be)oc has to be corrected for variations in Be
F
10 . The uncertainty introduced by this correction would be zero if samples were taken in a sufficiently small age interval using an accurate age model, at an age at which F10Beis known with perfect accuracy. We estimate the relative error arising from the departure from this ideal case as in practice age models of sedimentary sequences are imperfect (denoted by an absolute “Age offset”), and samples integrate over a given interval (denoted by “Integration time”). Larger errors in age models result in larger uncertainty in paleo-D, while higher integration time results in reduced uncertainty as the variations inF
10Be tend to cancel out. At high integration times, (100 kyrs), such errors are small, regardless of the error on the age model. The curves denoting this error were generated by first calculating the "true" 10Be production flux when averaging 1000 values that were randomly selected over the whole 10Be production record of Christl et al. (2010) at the prescribed age and over the selected integration time. Then, production fluxes were integrated over the same integration time scale, but around an age that is offset (either towards younger or older ages) from the first one by the prescribed "age offset". The relative difference between the two 10Be production fluxes was then calculated and is shown by the mean (solid curves) and standard deviation (grey area is mean ± standard deviation for the "Age offset = 5 kyrs"-curve) were calculated over this set of 1000 values.Figure 6: Relationship between D and oceanic 10Be/9Be ratios. All curves were calculated using Be
oc
F
10 = Beriv
F
10 = 106 atoms cm-2 y-1 and [9Be]parent = 2.5 ppm. The"Reference"-model (thick solid line) is based on a constant mobile fraction (
f
reac9Be+ f
diss9Be) = 0.2, a constant φdel = 0.063, and the global ocean and exhoreicdrainage areas presented in Table 1. In the "Low seawater level (glacial)"-model, the global ocean area is decreased by 1.6 107 km2, and the exhoreic river basin area is increased by the same area (François et al., 1998). For the "φdel depends on
D"-model, φdel was expressed as a function of sediment delivery to the global ocean
(Supplement S5), where sediment delivery is assumed to vary proportionally to D. In the coastal zone, an increase in river sediment delivery results in two competing effects: a lowering of the partition coefficient of Be between the reactive and dissolved phases in the coastal ocan (following (Hawley et al., 1986)); and an increase in the availability of suspended sediment in the coastal ocean. For the "
f
reac9Be+ f
diss9Be depends on D"-model,f
reac9Be+ f
diss9Be was assumed to follow the power-law fitting the upper envelop of thef
reac9Be+ f
diss9Be-D relationship of large rivers (Figure 2), which is likely an overestimate. The two horizontal lines show a possible minimimum and maximum value of today’s (10Be/9Be)oc, corresponding to the typicalintra-ocean basin variability observed in seawater (Table 1). The vertical grey bar describes the range of D values that could be inferred from each of these (10Be/9Be)oc.
References
Amiotte-Suchet, P.A., Probst, J.L., Ludwig, W., 2003. Worldwide distribution of continental rock lithology: Implications for the atmospheric/soil CO2 uptake by continental weathering and alkalinity river transport to the oceans. Global Biogeochemical Cycles 171038, doi:10.1029/2002GB001891.
Anderson, R.F., Lao, Y., Broecker, W.S., Trumbore, S.E., Hofmann, H.J., Wölfli, W., 1990. Boundary scavenging in the Pacific Ocean: a comparison of 10Be and 231Pa. Earth and Planetary Science Letters 96, 287-304.
Arsouze, T., Dutay, J.C., Lacan, F., Jeandel, C., 2009. Reconstructing the Nd oceanic cycle using a coupled dynamical - biogeochemical model. Biogeosciences 6, 2829-2846.
Bourlès, D., Raisbeck, G.M., Yiou, F., 1989. 10Be and 9Be in marine sediments and their potential for dating. Geochimica Cosmochimica Acta 53, 443-452.
Brown, E.T., Measures, C.I., Edmond, J.M., Bourles, D.L., Raisbeck, G.M., Yiou, F., 1992. Continental inputs of Beryllium to the oceans. Earth and Planetary Science Letters 114, 101-111.
Burton, K.W., Vance, D., 2000. Glacial-interglacial variations in the neodymium isotope composition of seawater in the Bay of Bengal recorded by planktonic foraminifera. Earth and Planetary Science Letters 176, 425-441.
Carcaillet, J.T., Bourlès, D.L., Thouveny, N., 2004. Geomagnetic diploe moment and 10Be production rate intercalibration from authigenic 10Be/9Be for the last 1.3 Ma. Geochemistry Geophysics Geosystems doi:10.1029/2003GC000641, 13.
Channell, J.E.T., Xuan, C., Hodell, D.A., 2009. Stacking paleointensity and oxygen isotope data for the last 1.5 Myr (PISO-1500). Earth and Planetary Science Letters 283, 14-23.
Christl, M., Lippold, J., Steinhilber, F., Bernsdorff, F., Mangini, A., 2010. Reconstruction of global Be-10 production over the past 250 ka from highly accumulating Atlantic drift sediments. Quaternary Science Reviews 29, 2663-2672. Field, C.V., Schmidt, G.A., Koch, D., Salyk, C., 2006. Modeling production and climate-related impacts on 10Be concentration in ice cores. Journal of Geophysical Research 111, doi:10.1029/2005JD006410.
François, L.M., Delire, C., Warnant, P., Munhoven, G., 1998. Modelling the glacial– interglacial changes in the continental biosphere. Global and Planetary Change 16– 17, 37-52.
Frank, M., Porcelli, D., Andersson, P.S., Baskaran, M., Björk, G., Kubik, P.W., Hattendorf, B., Günther, D., 2009. The dissolved beryllium isotope composition of the Arctic Ocean. Geochimica Cosmochimica Acta 73, 6114-6133.
Frank, M., Schwarz, B., Baumann, S., Kubik, P.W., Suter, M., Mangini, A., 1997. A 200 kyr record of cosmogenic radionuclide production rate and geomagnetic field intensity from 10Be in globally stacked deep-sea sediments. Earth and Planetary Science Letters 149, 121-129.
Ganachaud, A., Wunsch, C., 2000. Improved estimates of global ocean circulation, heat transport and mixing from hydrographic data. Nature 408, 453-457.
Gourlan, A.T., Meynadier, L., Allegre, C.J., Tapponnier, P., Birck, J.L., Joron, J.L., 2010. Northern Hemisphere climate control of the Bengali rivers discharge during the past 4 Ma. Quaternary Science Reviews 29, 2484-2498.
compositions). Reviews in Mineralogy and Geochemistry 50, 487-549.
Hawley, N., Robbins, J.A., Eadie, B.J., 1986. The partitioning of 7beryllium in fresh water. Geochimica Cosmochimica Acta 50, 1127-1131.
Heikkilä, U., Beer, J., Feichter, J., 2008. Meridional transport and deposition of atmospheric 10Be. Atmospheric Chemistry and Physics Discussions 8, 16819-16849. Igel, H., von Blanckenburg, F., 1999. Lateral mixing and advection of reactive isotope tracers in ocean basins: numerical modeling. Geochemistry, Geophysics, Geosystems 1, 1999GC000003.
Jeandel, C., Peucker-Ehrenbrink, B., Jones, M.T., Pearce, C.R., Oelkers, E.H., Godderis, Y., Lacan, F., Aumont, O., Arsouze, T., 2011. Ocean margins: The missing term in oceanic element budgets? EOS 92, 217-224.
Knudsen, M.F., Henderson, G.M., Frank, M., Mac Niocaill, C., Kubik, P.W., 2008. In-phase anomalies in Beryllium-10 production and palaeomagnetic field behaviour during the Iceland Basin geomagnetic excursion. Earth and Planetary Science Letters 265, 588-599.
Kusakabe, M., Ku, T.L., Southon, J.R., Measures, C.I., 1990. Beryllium isotopes in the ocean. Geochemical Journal 24, 263-272.
Kusakabe, M., Ku, T.L., Southon, J.R., Shao, L., Vogel, J.S., Nelson, D.E., Nakaya, S., Cusimano, G.L., 1991. Be isotopes in rivers/estuaries and their oceanic budgets. Earth and Planetary Science Letters 102, 265-276.
Kusakabe, M., Ku, T.L., Southon, J.R., Vogel, J.S., Nelson, D.E., Measures, C.I., Nozaki, Y., 1987. Distribution of 10Be and 9Be in the Pacific Ocean. Earth and Planetary Science Letters 82, 231-240.
Lacan, F., Jeandel, C., 2005. Neodymium isotopes as a new tool for quantifying exchange fluxes at the continent-ocean interface. Earth and Planetary Science Letters 232, 245-257.
Lao, Y., Anderson, R.F., Broecker, W.S., Trumbore, S.E., Hofmann, H.J., Wölfli, W., 1992. Transport and burial rates of 10Be and 231Pa in the Pacific Ocean during the Holocene period. Earth and Planetary Science Letters 113, 173-189.
Li, G., Elderfield, H., 2013. Evolution of carbon cycle over the past 100 million years. Geochim. Cosmochim. Acta 103, 11-25.
McDonald, A., Wunsch, C., 1996. An estimate of global ocean circulation and heat fluxes. Nature 382, 436-439.
Measures, C.I., Ku, T.L., Luo, S., Southon, J.R., Xu, X., Kusakabe, M., 1996. The distribution of 10Be and 9Be in the South Atlantic. Deep-Sea Research I 43, 987-1009. Milliman, J.D., Farnsworth, K.L., 2011. River discharge to the coastal ocean. A global synthesis. Cambridge University Press, Cambridge.
Oelkers, E.H., Jones, M.T., Pearce, C.R., Jeandel, C., Eiriksdottir, E.S., Gislason, S.R., 2012. Riverine particulate material dissolution in seawater and its implications for the global cycles of the elements. Cr Geosci 344, 646-651.
Peucker-Ehrenbrink, B., 2009. Land2Sea database of river drainage basin sizes, annual water discharges, and suspended sediment fluxes. Geochemistry Geophysics Geosystems 10.
Raiswell, R., 2006. Towards a global highly reactive iron cycle. Journal of Geochemical Exploration 88, 436-439.
Nd-isotopes with a coarse resolution ocean circulation model: Sensitivities to model parameters and source/sink distributions. Geochim. Cosmochim. Acta 75, 5927-5950.
Roy-Barman, M., Coppola, L., Souhaut, M., 2002. Thorium isotopes in the western Mediterranean Sea: an insight into the marine particle dynamics. Earth and Planet. Sc. Lett. 196, 161-174.
Valet, J.P., Meynadier, L., Guyodo, Y., 2005. Geomagnetic dipole strength and reversal rate over the past two million years. Nature 435, 802-805.
von Blanckenburg, F., Bouchez, J., Wittmann, H., 2012. Earth surface erosion and weathering from the 10Be (meteoric)/9Be ratio. Earth and Planetary Science Letters 351-352, 295-305.
von Blanckenburg, F., Igel, H., 1999. Lateral mixing and advection of reactive isotope tracers in ocean basins: observations and mechanisms. Earth and Planetary Science Letters 169, 113-128.
von Blanckenburg, F., O'Nions, R.K., 1999. Response of beryllium and radiogenic isotope ratios in Northern Atlantic Deep Water to the onset of Northern Hemisphere Glaciation. Earth and Planetary Science Letters 167, 175-182.
von Blanckenburg, F., O'Nions, R.K., Belshaw, N.S., Gibb, A., Hein, J.R., 1996. Global distribution of Beryllium isotopes in deep ocean water as derived from Fe-Mn crusts. Earth and Planetary Science Letters 141, 213-226.
Willenbring, J.K., von Blanckenburg, F., 2010a. Long-term stability of global erosion rates and weathering during late-Cenozoic cooling. Nature 465, 211-214.
Willenbring, J.K., von Blanckenburg, F., 2010b. Meteoric cosmogenic Beryllium-10 adsorbed to river sediment and soil: applications for Earth-surface dynamics. Earth Science Reviews 98, 105-122.
Wilson, D.J., Piotrowski, A.M., Galy, A., McCave, I.N., 2012. A boundary exchange influence on deglacial neodymium isotope records from the deep western Indian Ocean. Earth and Planetary Science Letters 341, 35-47.
Xu, X., 1994. Geochemical studies of beryllium isotopes in marine and continental natural systems University of Southern California, LA p. 315.
Ziegler, L.B., Constable, C.G., Johnson, C.L., Tauxe, L., 2011. PADM2M: a penalized maximum likelihood model of the 0-2 Ma palaeomagnetic axial dipole moment. Geophysical Journal International 184, 1069-1089.


![Figure 6: Relationship between D and oceanic 10 Be/ 9 Be ratios. All curves were calculated using F oc 10 Be = F riv 10 Be = 10 6 atoms cm -2 y -1 and [ 9 Be] parent = 2.5 ppm](https://thumb-eu.123doks.com/thumbv2/123doknet/14739138.575698/24.892.137.524.108.482/figure-relationship-oceanic-ratios-curves-calculated-using-parent.webp)