M. F. Ruane
Report #MIT-EL 73-012 February 1973
The Energy Laboratory was established by the Massachusetts Institute of Technology as a Special Laboratory of the Institute for research on the complex societal and technological problems of the supply, demand and consumption of energy. Its full-time staff assists in focusing the diverse research at the Institute to permit undertaking of long term interdisciplinary projects of considerable magnitude. For any specific program, the relative roles of the Energy Laboratory, other special laboratories, academic departments and laboratories depend upon the technologies and issues involved. Because close coupling with the
nor-.. .. .
mal academic teaching and research activities of the Institute is an important feature of the Energy Laboratory; its rincipal activities arc conducted on the Institute's Cambridge Campus.
This study was done in association with the Electric Power Systems Engineering Laboratory and the Department of Civil Engineering (Ralph M. Parsons Laboratory for Water Resources and Hydrodynamics and the
by
Michael Frederick Ruane
ABSTRACT
A modl is developed to describe the sulfur dioxide and particulate air pollution characteristics of a fossil fueled steam electric power plant. The model contains three stages. The first considers boiler emissions and the application of
one of four parameterized abatement methods: wet limestone scrubbing, catalytic oxidation, magnesium oxide scrubbing,
and the use of tall stacks. The second stage tests stack emis-sions and uses meteorological dispersion models, particularly the double gaussian model, to determine and test three hour,
twenty-four hour and annual worst case ground level concentra-tions. The third stage calculates the performance of the
abatement method used in terms of economics and resource costs. The model can be used to determine feasible combinations of plant types, site types and abatement methods as support for a separate generation expansion model. It can also be used independently to study environmental and economic
sensi-tivities to changes in air pollution standards.
General descriptions of the operation of the abatement methods and explanations of meteorological modeling are in-cluded. Examples of the use of the model as an evaluative planning tool and as a sensitivity analysis tool, examining sulfur dioxide standards, are given. A computer listing of
I would like to thank Professor Fred C. Schweppe for his patience and guidance in defining the problem area and scope of investigation of this work, and for his encouragement when difficulties arose.
Professor James Austin of the Department of Meteorology provided a wealth of theoretical and practical information on the chapter about
meteorological modeling. Without his help, and the advice of Ronald Hilfiker, Area I EPA meteorologist, and Dr. Bruce Egan of Environmental Research and Technology, the model development would have been impossible.
The work described in this report was partly supported by a National Science Foundation Grant (#GI-34936) as part of a research program at MIT entitled "Dynamics of Energy Systems". Support from a NSF trainee-ship was also involved.
The report essentially constitutes a master's thesis submitted to the Electrical Engineering Department. Mrs. Jean Spencer was responsible for transforming the draft copy into the finished product.
Finally, I want to thank my wife, Patricia, for her understanding and support during the preparation of this work.
Table of Contents Abstract 2 Acknowledgements 3 List of Figures 6 List of Tables 7 Chapter I - Introduction 8
Air Pollution and Air Pollution Standards 9
Abatement Alternatives 11
The Planning Problem 13
Chapter II - Model Overview and Examples 16
Model Assumptions 16
General Assumptions 17
Plant Assumptions 19
Site Assumptions 20
Abatement Method Assumptions 21
Economics Assumptions 23
Model Operating Logic 23
Model Example I 25
Model Example II 31
Chapter III - Boiler and Stack Emissions 37
Boiler Emission Factors 37
Abatement Process Data 41
Commercial Status of Abatement Processes 44
Chapter IV - Meteorological Modeling 50
Site Characterization 50
Plume Rise 53
Three Hour Worst Case Average 55
Twenty-four Hour Worst Case Average 56
Annual Average 58
Standards Testing and Stack Incrementation 60
Chapter V - Abatement Parameterization and Economics 63
Process Parameterization 63
Common Operating Parameters 65
Common Economic Parameters 67
Individual Process Parameters - Wet Limestone 69
Scrubbing
Individual Process Parameters - Catalytic Oxidation 71
Individual Process Parameters - Magnesium Oxide 72
Scrubbing
Individual Process Parameters - Tall Stacks 75
Chapter VI - Conclusions and Recommendations for 81 Further Research
Further Research 82
Appendix A - Meteorological Background and the 85
Binormal Dispersion Formula
Meteorological Background 85
Binormal Dispersion Formula 91
Appendix B - A Generation Expansion Model 98
Plant Evaluation Model 99
Plant Expansion Model 100
Gas Turbine Modeling 101
Appendix C - Abatement Process Descriptions 104
Wet Limestone Scrubbing 105
Catalytic Oxidation 110
Magnesium Oxide Scrubbing 114
Tall Stacks 119
Appendix D - Model Computer Program 123
Data Requirements for Independent Use 124
Input Data Variable Explanations 125
Common Input Parameters 131
Wet Limestone Scrubbing Parameters 132
Catalytic Oxidation Parameters 133
Magnesium Oxide Scrubbing Parameters 133
Tall Stack Parameters 135
Glossary 136
Program Listing 147
List of Figures
2.1 Model Operating Logic 24
2.2 3 hr SO2 Air Quality Standards 32
2.3 24 hr SO2 Air Quality Standards 33
A.1 Lapse Rates and Stability Classes 88
A.2 Plume Behavior 90
A.3 Dispersion Formula Coordinate System 94
A.4 Vertical Dispersion Standard Deviations 96
C.1 Wet Limestone Scrubbing 106
C.2 Catalytic Oxidation 111
C.3 Magnesium Oxide Scrubbing 115
List of Tables
I-1 Federal Emission and Air Quality Standards 12
III-1 Representative Sulfur and Ash Contents 39
III-2 Boiler Emission Factors 39
III-3 Full Size SO2 Removal Installations 46
A-1 Stability Conditions 89
A-2 az Parameters 97
CHAPTER I
INTRODUCTION
Increasing concern about the environmental effects of industrial practice has caused a revolution in the planning requirements of the electric power industry. The public is no longer satisfied simply to receive the power it demands.
Through litigation, federal, state and local standards, and the pressures of public opinion, the public also requires that the power industry provide its product with minimal effect on the environment.
That the electric power industry should be one of the prime targets for those concerned about air pollution is un-derstandable. It is a major and visible polluter, its fossil
fueled plants producing 50% of the total national sulfur di-oxide emissions and 25% of the total particulates annually. These enormous quantities combined with a growth rate which should quadruple the industry's size by the year 2000, mean that significant air pollution control must be exercised just
to maintain today's environment.2 8 Hopefully control may also
improve the quality of the air, if not directly, then perhaps by encouraging the substitution of electricity for other sour-ces of energy which cause more pollution. For a number of reasons then, the electric power industry is under increasing and immediate pressure, both justified and unjustified, to clean up the air pollution being caused by its operations.
This work is a description of the development of a plan-ning tool for the electric power industry which will assist
the power system planner in his efforts to produce power with-out unnecessary damage to the atmosphere. The air pollution characteristics and the costs of air pollution control are
modeled for a combination of new fossil fueled power plant,
a site for the plant and a method of air pollution control. The remainder of this chapter discusses the planning problem
in more detail after first covering some background material on air pollution standards and control alternatives.
AIR POLLUTION AND AIR POLLUTION STANDARDS
There are many different pollutants which result from the burning of a fossil fuel in a modern power plant. Sulfur
dioxide (SO2), nitrogen oxides (NOx), particulate matter,
car-bon monoxide, carcar-bon dioxide and hydrocarcar-bons are the most
significant. Of these, sulfur dioxide,36 particulates3 7 and
nitrogen oxides are considered the most serious threats to
health and property. The air pollution effects produced by the pollutants can be described as either global or local.
Global effects are those which occur over large areas and long periods of time, such as recent increases in sulfur dioxide concentrations over the oceans and polar areas. Glo-bal effects are most dependent on the total amounts of
the all-too-familiar brown urban haze or soiling by particu-lates depend on the amounts of pollutants emitted and the manner in which the local meteorology and topography combine to disperse the pollutants. People generally notice the more rapidly changing local effects, although the dangers of global pollution are at least equally serious.
Adding to these effects are the background levels of pol-lutants. These ambient levels are due to both natural and man made causes, the differentiation being that man can con-trol the man made portion of the background level. For example, a coastal site like Boston could have natural background levels of particulates from ocean salt spray, or the dust of distant fires, etc. Man made levels would result from incinerators, home heaters, cars or power plants.
The Environmental Protection Agency has established
fede-ral emission standards3 0 applicable to power plants to control
the global effects of emissions and hopefully to reduce the local effects as well. The emission standards specify the maximum emissions allowed per million Btu's of heat input to the boiler. Since poor plant design or weather conditions could produce dangerous local ground level concentrations of pollutants even if a plant is meeting the emission standards, the EPA has established standards for ground level
concentra-tions.3 These standards specify maximum average values for
These ground level air quality standards and the plant emis-sion standards are listed in table I-1. States may adopt these federal standards or implement their own, provided the state standards are equally or more restrictive.
ABATEMENT ALTERNATIVES
As there are two types of air pollution effects, there are also two alternatives for controlling the air pollution
produced by a plant.9 ' 1 0 The first is source control and is
mainly concerned with the emissions or global effects. The second, atmospheric dispersion control, affects only ground level concentrations.
Source control, an essentially deterministic process, en-tails altering the plant design or operation so as to reduce emissions, resulting also in reduced ground level concentra-tions. Four available means for source control are fuel sub-stitution, capacity reduction, process changes, and pollutant removal. Fuel substitution broadly includes fuel
desulfuri-zation, use of naturally nonpolluting fuels or switching to alternate generation like hydroelectric power. Capacity re-duction would bring no improvement in terms of the present emission standards, but it would reduce ground level concen-trations. Process changes would include redesign of the plant to reduce the production of pollutants. Pollutant re-moval requires that the polluted flue gases be treated and
FEDERAL EMISSION AND AIR QUALITY STANDARDS
Emission Standards (applicable to new or modified sources of more than 250 million Btu/hr heat input)
Particulates
0.18 g/106 cal
Sulfur Dioxide
1.4 g/106 cal (liquid fuel)
2.2 g/106 cal (solid fuel)
Primary and Secondary Ambient Air Quality Standards
Primary standards are those deemed necessary, with a margin of safety, to protect public health.
Secondary standards are those deemed necessary to protect pub-lic welfare from known or anticipated adverse effects of pol-lutants.
Annual arithmetic mean 24 hr maximum (once/yr) 3 hr maximum (once/yr)
Annual arithmetic mean 24 hr maximum (once/yr) 3 hr maximum (once/yr)
Primary Standards
Particulates Sulfur Dioxide
75 g/m3 80 pg/m3 260 g/m3 365 pg/m3
Secondary Standards
Particulates Sulfur Dioxide
60 g/m3 60 pg/m3 150 pg/m3 260 pg/m3
the pollutants removed or rendered harmless.
Nitrogen oxides, one of the three main pollutants produced by the normal power plant, can only be controlled by capacity
reduction3 8 or process changes, usually alterations in the
boiler. No gas treatment method is now available and since the nitrogen oxides are formed primarily from atmospheric ni-trogen, fuel substitution is ineffective.
Atmospheric dispersion control, relying on meteorological parameters, is stochastic in nature. It attempts to reduce the ground level concentrations resulting from a given emis-sion rate by plant design and site choice. Good plant design of the stack height and the heat content of the stack gases can produce plume behavior which lessens the probability of high ground level concentrations. Site choice on the basis of topography and meteorology can influence the average be-havior of the plume in a similarly favorable way. Considera-tion of known background levels, both natural and man made, can indicate whether a site can sustain the additional concen-trations produced by the plant, and still meet the standards.
THE PLANNING PROBLEM
The system planner in the past developed his generation expansion strategies without including the possible costs and environmental tradeoffs of air pollution control methods. The strategies were developed on the basis of reliability and
eco-nomic criteria, and after the number and size of the necessary plants were determined, the problem of siting the plants was addressed. The size and number of plants required in the fu-ture makes such a two-step procedure undesirable. Utilities no longer can be sure that an acceptable site can be found
for each plant, because environmental constraints have elimi-nated many sites from consideration.
One goal of this work is to provide a tool to answer the
question, "What is the feasibility of a given combination of plant-site-abatement equipment (hereafter called a PSA alter-native)?" That is, if a particular type of new fossil fueled plant is specified, along with some means of air pollution
abatement, and it is placed on a site type of known topography, meteorology and background concentrations, will the
combina-tion meet the emission and air quality standards? Such knowledge can indicate to the planner which PSA alternatives he can con-sider feasible in his planning strategies. If the plant is environmentally feasible, the economic feasibility of the plant and abatement equipment is determined in terms of the invest-ment and operating costs.
This particular approach to the feasibility question is chosen in order to provide support for a generation expansion planning model which is described in appendix B. The combi-nation of the generation expansion planning model and the eval-uative model which results from this work can be used by the system planner to include air environmental constraints in his
planning strategies.
A second goal of this work is to provide a tool to answer the question, "What are the sensitivities of pollution and
costs to standards changes?" That is, if a plant were forced to meet different levels of pollution standards, what trade-offs would develop between actual pollution levels and the
costs required to meet those levels? Clearly, the answer to the second question could affect the constraints applied in
the first, and change drastically the system planner's options. The tool is the previously mentioned model of the air
pollution characteristics and abatement economic characteris-tics of a given PSA combination. The two goals require that the model be able to perform two broad functions:
1) Determine if a PSA combination meets the specified emission and air quality standards.
2) Evaluate the economic and environmental costs of the applied air pollution control method.
Chapter II gives an overview of the model structure and considers two examples of the application of the model. Chap-ters III, IV and V explain the detailed model structure, while chapter VI gives conclusions and recommendations for further research. Supporting appendices and references complete this work.
CHAPTER II
MODEL OVERVIEW AND EXAMPLES
The model is designed to determine the air environmental feasibility and the abatement economics, resource requirements and plant effects for a prespecified plant-site-abatement (PSA) alternative. Such an alternative consists of a power plant type, a site type for the plant, and a means of air pollution control.
This chapter first discusses the assumptions made about the power plant and its site, and about the abatement method and its economics. The operating logic of the model is then given as an introduction to two sample applications of the model.
MODEL ASSUMPTIONS
The major assumptions made about the model are as follows:
General
1. Prespecified PSA alternatives are evaluated.
2. Only sulfur dioxide and particulates are considered. 3. The model is designed to consider only steam
genera-ting plants.
Plant
1. Plant performance is parameterized.
Site
1. Six alternatives of type and background are considered. 2. Representative meteorological data applies to all sites
of the same alternative.
Abatement Method
1. Four types are considered.
2. Abatement performance is parameterized. 3. Stack heights are decided by the model.
Economics
1. Five costs are calculated.
2. Abatement economics are parameterized.
GENERAL ASSUMPTIONS
The model evaluates combinations of plant type, site type and abatement method. It makes its one optimizing choice when it decides plant stack height as the smallest value (of a set of values) which will enable the plant to be air environmen-tally feasible, i.e. meet the air pollution standards. It does not attempt to determine the best site or cheapest abate-ment method. These decisions are made by the system planner using the model's results.
Although nitrogen oxides are one of the three main power plant pollutants, the model does not consider them. This is because the only means of nitrogen oxide control are capacity
reduction or boiler design changes. Since nitrogen oxides are inert and form from atmospheric nitrogen in the boiler flame area, no flue gas treatment method or fuel substitution will significantly reduce their emissions. Changing boiler
design would be a complicated task and could well make the modeJ's results less reliable. It was decided to assume that
all new boilers such as this model is evaluating would come with adequate nitrogen oxides controls. If it were desired
to evaluate nitrogen oxides, the boiler and meteorological models are applicable, and only relatively few program changes would be needed.
The model is designed to evaluate fossil fueled steam
generating plants since these are the most common plants, carry the most load, and produce the most emissions. An adaptation
to include gas turbines is included in appendix B. Although fossil plants can be base loaded, intermediate or peaking plants in practice, the model evaluates them all at 100% capacity fac-tor to get worst case meteorological comparisons.
Abatement parameters can adjust for the lower operating cost of peaking operation for example, through a quantity called "stream time". This is the actual hours of operation for the abatement equipment. Although the plant is assumed to operate at 100% capacity continuously, "stream time" is the length of time in hours per year for which abatement costs are evaluated.
PLANT ASSUMPTIONS
The plant is considered in terms of the air pollution
characteristics only, so most electrical and mechanical aspects are ignored by the model. The boiler operation is emphasized. Since the stack height is designed by the model for air pollu-tion control purposes, it is not considered part of the pre-specified plant and its cost will be included in the abatement costs.
The following parameters are assumed to be determined by factors other than air pollution control, and are used to repre-sent the air pollution aspects of the prespecified plant and
its fuel.
1. Plant type
2. Plant size (MW)
3. Fuel type
4. Fuel sulfur content 5. Fuel ash content 6. Fuel heat equivalent 7. Boiler gas flow
8. Boiler exit gas temperature 9. Boiler heat input
10. Boiler efficiency
11. Stack gas sulfur dioxide content (spare)
12. Stack gas particulate con-tent (spare)
Plant type specifies fossil base loaded, peaking or in-termediate for information purposes and possible abatement economics use. At present all three types are treated the same. Plant combustion method is also given if coal is burned
size in MW is the plant's maximum capacity.
Fuel type, either coal, oil or gas is accompanied by fuel sulfur and ash contents, specified as "high", "medium" or "low". Numerical values are assigned for these in the model. The
heat equivalent of the fuel must be in units compatible with
the emission factors used, Btu/ton for coal, Btu/103 gcal for
oil and Btu/106 ft3 for gas.
The boiler gas flow is the gas volume in ACFM leaving the boiler at the boiler-exit gas temperature. These determine
fan power and abatement train size. Boiler heat input in
Btu/hr and boiler efficiency in percent determine fuel use and plume rise. The last two parameters originally were to be used to determine abatement efficiencies while the model was used in connection with the generation expansion program of appen-dix B. Their use has now been deleted, but the parameters
remain as spares. Their values in no way affect model opera-tion at present.
SITE ASSUMPTIONS
It would be impossible to find two sites which exhibit identical meteorological characteristics with regards to at-mospheric dispersion of pollutants and pollutant background levels. To attempt to examine the air pollution characteris-tics of all possible sites which are otherwise feasible is equally impossible. Thus, a level of aggregation was assumed
so that all possible sites are classed into site types by topography, meteorology and background levels.
Six alternatives result: urban coastal, rural coastal, urban valley, rural valley, urban plain and rural plain. The alternative to be evaluated is prespecified and representative meteorological data are introduced into the model.
Although representative data are employed, a main
assump-tion is that if a plant is air environmentally feasible or
in-feasible at the representative site, it will be the same at all the sites in that class. While exceptions are sure to exist, model results should show trends helpful in ultimate site planning.
ABATEMENT METHOD ASSUMPTIONS
The height of the stack is the controllable design factor in all the abatement methods. Otherwise, each abatement method is parameterized before the model begins, to reflect its opera-tion and economics. Four abatement methods are considered by the model:
1) Wet limestone scrubbing 2) Catalytic oxidation
3) Magnesium oxide scrubbing
4) Tall stacks (and precipitators)
lack of operating experience surrounding their performance
data. The first three are chosen as the most promising methods
at this date,1 1 and the fourth, with no S02 control, is included
for comparison as a continuation of past plant construction practices. The fourth method also would be useful to investi-gate the effects of the failure of the first three methods to become commercially acceptable. The model assumes that the
parameters available for each method can represent the abate-ment effectiveness and operations adequately.
One factor of abatement operation which is not parameter-ized, or dealt with in this model is reliability of operation. This factor may eventually prove to be the most important
parameter. Since it is so undesirable to have a power plant unavailable unexpectedly, the system planner will be concerned about whether failure of part of the abatement process necessi-tates shutting down the whole plant. If the abatement devices of the model prove to be unreliable with frequent outages,
and this affects overall plant reliability, then they may not gain industry acceptance.
Reliability was not included in the model because it is basically a system level problem and the model works with
in-dividual plants. Reliability concerns will ultimately be hand-led at the level of the generation expansion planning model.
ECONOMICS ASSUMPTIONS
Five costs are determined for the stack height and abate-ment method finally used. These are the capital cost of the stack and equipment, the fixed operating costs, the variable operating costs, and two "resource costs", the water and land consumption of the plant abatement method. The power consump-tion and boiler efficiency change due to air polluconsump-tion control also are determined.
As with abatement operations, the parametric representa-tion is chosen because of the present uncertainty in costs, and it is assumed that the parameters chosen adequately repre-sent the abatement costs.
MODEL OPERATING LOGIC
Figure 2.1 indicates the procedures used in evaluating any prespecified PSA combination. The diagram represents the decision logic used to deal with a fossil fueled steam genera-ting plant. Gas turbines, mentioned in appendix B, would be handled in a similar way with different numerical values in
the model. The diagram is self explanatory. The three indi-cated segments, covering boiler and abatement operation, mete-orological modeling and abatement economics are treated in detail in the next three chapters.
0.-,. 4 w <o< _l _ _ z 0 !-U' a. 03 u 04 O I- O I-$ _ toC: .4 Cd 0 L,.. a- I.->: S~ ,.4 14 '-4 A :¢ u.
-MODEL EXAMPLE I
This example is intended to demonstrate to the reader
the evaluative capability of the model, emphasizing two things: the meteorological results and the abatement process
informa-tion produced. It should be noted that the feasibility deci-sion and the five cost quantities, as well as power consump-tion and boiler efficiency change, are automatically returned to the generation expansion planning program whether or not the model results are printed and that only these quantities are returned. The results are printed here via a print logic control variable to familiarize the reader with the informa-tion available.
A 250 MW coal fired plant is evaluated at a valley site
for each of the four abatement processes. In order to ensure
complete printouts, the model logic is overridden during the emissions standards testing. As can be seen on the next four pages, this logic override causes the wet limestone and tall stacks evaluations to printout that the PSA alternative both fails and passes the emissions test. The numerical values show that the plant actually does fail.
These outputs are intended to be self-explanatory and the reader will profit most by examining the different processes in order to make comparisons between methods. A few interest-ing results are immediately apparent. In general, the site's dispersion characteristics are good as all the ground level
JSO 3 r o_ 2: 2: P0 0 0- 0 O o o zoo oC bX00 OZ LI I II _ o 00001-zx C. 11 11 11 NN-0~ C 0 C 0 C < < C4 LC I z z C C z C: 4 -C-.J S<r1 C 41 C. LI . C. C . In0 N) 4 In 3 NJZ O. 2:2:24 Li v 02:2:_-O: In w C. v. ft t I G 1 00CC ZX In 444 Lit 0 a C ... *: D.. C. W ft Z *_ N Z~Z -i Z 0 0 I~ -In S. (I:IC-z In4 1C-. U- - 2NJ 1- 4C H N11-Z * N O1-~ * -O I _ 0 * e U 0 -. · .. 4o .. 4 : LI >UT- * V 0 * C '_ L. u . -~ C. .1-r In w : * *InO UJ * _NOCt * 0 · * YO _C 0:-* InU. nO * · : l o -* O- G 44 ': * Q10 : ' : ·*C .., * *j _ '~ ~-* · . · · : : 3 z 3 y' y eq I CO H o _C .oL o . . .I *n .. 010 ' N 0) 4 N W LC LiJ-iC L- C. C- .- CU-4 > 44.CC.·C00W- InL 2: C 2:J00 W W I- U-.; CC Li-vn N ct i> w42: In C. L C. In *. 0001.C.. . )ft 00In4-t0NC. J- 4.N.t N x -* N N N 0 C. U-~~~~~ I~~~~~~~ %. U-~~~~~ 0 C *n 0 ~f v -+ l Li .- + + U-s In *s Li -N LI U-_I4U - + U 0L ILC oC *1 .0 HL _n 0 0 1-Ce rC I en 4: In C.Z oC ¢Z 1- .I4 4 InN _ -° a - U U 01 v C C.> WC CL Z - Z.CL C _ Z vn4C > -4 C-> 4 C C In I C. Cf C I I-C IC...N0@@ In4* -4 C I C 114ID 1 . .. .,* Ci Wi-211- 1 7In- 07 In In O2:IC Li - LI J C. C. ULZ clC v4 -Li I U-S - 2i LiC F 40 - L C. O U--..JI 4) _-C 0_4 IC IC C IC C' ICIC CC O. ¢ i04 C N I 1N C. Y: c. 0 0 0 - 4 u 2: . O N O Z Z .Zl V.:)CG r .2 (U stsf sf (U * O n O Z 4 C .Of . C C t C v. ft In 4 0 ) 1 - -* V .tF *w * e4 00 C' _ O tI O G N-i-In Z In) w c.G C C 4o 1;-C Ui _ I C In C. 1- .JC C w c _ C. U -C U U .J C -- C U - o 1 ._ 4 4 C. C Z .JQ 04<> Li ,_, e 4i nL - > C u. U- C. C. v L U . 4 4e -4 c--C-a Jc C. 3..*J.C** . . 1In I 0 0 . .. N 2o I-IC. -N0 ! L InC000 4000 ' "f c. 0 <t U _ U-. IL Li * UW _ C -C C N . C. I n 0 -tz ""f Zz *. U 1 1- 0 x 2: C 0 0 c. CL -J 0 cc z-0 U X z t -V. 3 U ZIX X -JC i-I C & D CIC-_XN C X * 4 * LI * 2:. * 0. * 0. .1-UC. .- 4. .1-c .C.Z .44 * 0. *InIn .wz .4-*.-4In .:,In I-I. *C. *0.0 * I-* 2:. * 0. * 0. Oft C. * N 4. 0* 2. 1-ft II. In. 0. 7 *N4 o .oo 2:. Li C. ft 2:. C. Z* 1-ft C In . Li' - I In 4.C2:ft Li *ItL.i 7. ft I- ft 4 In . 1-G-i X C3 0 ~ I n ot f ft ILN 2 t 1:- W 4 o 0z C 1-_--_ -In> z ZZZ < C444 tJ . 4 ~ J *0 00 .000 0 ._00 *-00 0 C0 .000 0 000 * ! C .0O0 0 .0 0 0 0 000 0 .0 0 0
.-
tooo
ON .0 .00000000 00 * o * 0 0000 .0*000000*000000 e00000 : * N C. U .000000 .000000 .000000 . 0000O0oo§oo .0 00 .. 0. I 00 ) *OOOCOO000O0Co :.0000 00 .0 N I 00 .o0ow, .~~~~~ f In ·* S . N P - * * -C IO O Iaa. NN * * 'D . 4 - U - U -o . · ,. l 0 00_ I e 0 J. * 000000 W >. -A O O I 0 . * U _ 0t * . 0 . _ U.)
* :.:
O * 0 U0 It-0 It * . * LIZOCO 0 0- 0- IA * * -U l S 0f -'C ' C C Y 3 * U, o - N CZ . 0 . -' : C. -U i Zi U c, .< .* : U Z Z C<t< 11 0 " U NJ * z U -F , .O. l - * * I A I r Z Z L I UZ·O W C O0@O W -> , U- 0 0 Z w 0 0 4 .- It 0 - L 0 U. * 0 I 4 0 .I S Z Z * cc,.) - ' ' U- 0 I0 0 U 0, r 0 o w D VI * . u. 4 C : a IA M N a 3 ZX 0- · W NZ O x zJ * Z -' < <_ J J , CC W: *0 . I. V0 0 . W _WOW * U J O O OIY .I 0L0 . LLII 0 U ) z * C, Z O . - . * * -U -: .: 1 I 0 W-4 .U O U)J to <A X 1 '-I J 0 C0 L) 0
U., L ,,g gOO ,-VQ Z : Q -* z < fiUz *^N-&' Z 0 Xi . -Z _ I II 1 * 0 -Z Z Z.0 Z _ Lr ~_<: tL.D t * * ~ -.r C S. L
C N i tL 0 0 * (A1 4C4 OO .Z <'O I-OO
u_ 0 . 4 *. * < * 0- 0 0 .U x .~ * Z t N I A A I Z O *--1 0 _ -U 0-0.4-.o > ~~~~~. * Xb X ~r 1--Z. Z 0. N N C C e' C F - ' r N - .0- o . A Z - L V S ~ ~ UJ *- - ZZ wfDU U- U - * 1- I _ - UZ 0 < : ~ .. -... 1 . ) W U . * 0 - r 4 - 1 1 ( 0 . X .- 4 * O Ne o. ) * U .C 11 Z ( 0- 0-00 N * - -tL 44 0- 4 Z 1WZ W ; tt N .* J 0ZZU < * 000 * u..U... * N or 0 . _ o _o. * -* 0-0. * M eS U * _ _~ * 0U-U. . * · * · * V4 0 _ _ * 0-.1U -K * 0.4' L >/I * U- >_ * 0-11I * * U-U- J CZ_ U-~ * 4 I J · I.- _. X LA 1I * CL 0;V74_ · IA--A * 00> * / Z - . * Z-C U * 0 . * U- < 4. *.4 LU t * . X .- G * .- .4@ * N0 * ON ·* o * 00 _* u.ZIA X* *C . - · * a. -' e* l., -* L -- 0. * IA/, z * -. J . * z e, - e. *· *Z * · * · *O * · · . * NOO * OO s · ::
*
.~~
· · *_ * ^~ I.- Z · · : * · :K Z 3 O o e 4- U. 0 IA P- 0I 0 U, Vs0Q' 4 M0- -) U,0 W ~ O, Ll. C , W a- m W 0. 4 U- U - 4 .cL UC 1- .I- CU- C > O U> QU x C x Ji O U) , W_ f W > a 1:W WU I CI. VI "I Ue - -C. 1>0 U- IA N0.0-t- >U-4C 04 C. 0.0- X XX X XX XX X X X XxXX XX X I l.J IA C U-X. 0 0 I 1- 0 0 NM Nr O- O -N N 0- '. 0 N N e M U. U-. LZLI 0 0 0 S O :0 W *A I ,.,t ,411· '" rt - , u. > ,,v 0-- 04+-W IL< > _- 4 1 W - 4 I ' I -- 0. -I W - U- - U- 0-,,-0 0_<C<= Z 0 U U-O o ·- 0 ' 0 .0000 J 0 'ef 0 J -O0 0 0 ct - a:'N C. A0 l-l- 4K AWF a. sq I4 JC 0 .- *. . I .U-_ - Z 0 U I x C IL U be tH 0000 0 0000-o O0 z U, Z - Z '-U t- _x "' , 4 U-I U-I In - - W ..J J J tL < LS <. Cj ,.G' X XX XX XXX X X X 444 XXX X XXXX xxxxxx X 0- 0- 0-.. IA 0 C L) Z .. 0. 0 0. 4 . l N 00 .It O Nc U, O N in N 0 L'4 e_ · .= 0 O . 'A: In 0 C, U e.. 0-0)-- 1,- V' JU-L J - -OU* ZMCZ .-NN r tOOI 'IA NN 0 IN O O 0W00+* .' .1. ' 4 0 W0 CW W C 0- W 'O U.. 4 WU- S tY . C .U 0. 0 0i 0. 0. .,9 0- _ 0-0 N ON 0.U-> U-C ® 0.4 _o 0 - 0 4 O- . .-0 _ IA 0-0C U - C0.Z 0 . I . - . -U- 4 4 .J v U 4 0 -) 1 - U - 0 - 0 . 3 U- U U - - U C. Ne O '4 ' CA -*000 0 00 0 .o0 c O O0 .000CO 0 000 0c .0 0 C! 0 .000 0 .o ro 0 000000 .:ogo o .onOoo O 0000 0c · , M o · N a 0 In· .000000 eN 0. , . ,0 0 oooooo0 0.oooco
. OO -'O M * 0 C: *00g 000 '000000... .0 0 0 o o -,0 .o 0_ o28 X009 L7 * * .. 02 4 Lr z L 0 <:, x *i x x (D .. %. %. 02: o o2oo:o 0 aI 04_ oZN J 1 I 1 I 4 6O N u u c=I u Li 444 F I_ _ O x _ 0 n-Uj 11Hn11 ZiZ -. 0 VI O ) VI X L .J L 0 NI N OD X 1 N ) LIL 2S C Lisa D : -K . N 41 If I N <xUf N- -Zj N Z -42 _30 2: > 7 4s LU 0 00 0 0 * . . *2:0 N OOCO P-141N 4' O 0o - C00.0 . N N NCC V1 C C 0 ' 1L I0 N N 0tI C. NN ON _3 27 L Y Li n JI Z0C 0 -4 C L LiX ZJ _. N - 2: F -: : S 1.02 0 :0X 2:InC < _.K IL l_ N- -: J UJ 12 LULi L^* -J> 3. Y :2TZ14C w 2 a- =- * 0 0 0 0a * N CONP- * 00e * * 1-41-: ~0 :~ ,. ·: * · * . k -k. -* * V N - L U CN-2 . * ' - ' 0 1 - . * J .441 * 4LiWN- * Lir . -Z2: * _ 2 - 4 · i C~ Ul_ * . Lw U * 42 :> * 0-* Y LZci * V C V ~: :_ X * oc/ · * U. . _
z:
_ : * · V ,* Ldr7 · - . 2:. w': :'_ * 0 * 0 · _* 0 U * 2: u I * @Li * 4 1 -* O~ * .L * U- - 2 0 . * 411410 * O Ct7 . * O Z A.U * * O- 4 * 4 4 1 2 2 2 2 'L Y -IL UI . 0 . 4 . 04a01- 00CL 00- -41'AU OC U.N. C N -I. 4L C z U0 0L 4W 4 tLL UJ O! U0. 4 J L A.O IL C U 00 0 0 'A 0 4 1 0 OM C; >ofV20C i- I L.' 4 0 LU 41 0. W 4 n N- I. 0. 41 4 0 0 -O 0-141 2- 0 0¢ 1 0¢ 0 O N t N N NO1 N .0 D 1 * 1, 4_ N .~~~-- Li 4 0.~~~~~ -. 0.~ ~ ~ ~ . S~ -U O ONn 1N 4 V- -J N * + - . IL UN C S N D_ n ZN-40. 0. C * O 'N ra N C 0N *__ -0.-' 41 4 In * C C 4 On C-_41n0.CUe0G C C _ U2,,, j Z LU -> 1. : C4 0 0 C Li C e :U. - Z 4 U' O -C 0.0_ <.JC .Ji O In 2: 0.0 0. i C XC -. 1-0.4101-o Jo~ Z J * .. W U. U. 1. C I1 0U.Lw <* M i-0Li L nC3 Z -J IL U, IIIz 1 . LD< 2 4 ,,l~ .,.4.,.J0 .4 2 : L :1: U . J~~~~~ n - C: O2 :, -I 0U; ", e!' _% r~ (" C ->- -, N N J C 0 In In X X 1 ( 2 2 : 2 O C _ C IC C MP - - O N N P-4 _ b«JCVN O 1M 0- 4 4C N .N 4 -t "I VI C 2 .4 21 IU -.. j C cO -% % %%I2I I Z IA 0000000 'L U,. OL ° O CA 0 0 * L .0 4 4 4 4 4 V. U. Qe DU. W U .1 '4 4 4 * 0. Li Li * 0O 2: 'L U*3 0 F 0 1 1DNO N Z - - 0 N- In 4 N04 Z 0 - N 0 - L i 0 0 - - 1 .C NLJ 0 W - n O lU nN-C C N- Y 4 1 L UJ > C 0. I n 50 i .. J _ 2: C O O Li.> c 0. J 1- f 4 4 410.o .1C IL L -.IJ * 0 -~ 4 _ N 1-U LU N-@ 0.O : oo O0 . . 00 00 .000 000 .000 _olo 000OleeO *04'41 01.0 * 0O. * 0 · 0 .000 000 oo000 000 *000 000 *000 000 .,ta 0 00 '011 0 0 O oo o moo0-N .0000 000 *c000000.0000000*00005000 0 O U ' O00 .000.00e 0 : * CW *10 0 C O _' - 0 a, 0 *00 0 0 000 .0000000 * 0000000 '00e000t .*N31O 1^ N *.N 0 .0*0000000 1 .0000000O 00 000 : 00000000 7*InOOOCOON . *0- N-_ N N f0 1 · 1 . 00000000 .0041000000 I*O-t ONCON , * 01_ O *· % .. N . · U- . NJU. 000.· . 0L UI at U 0 ,,~ I,,N-. ,o, In.I.,- UU-Z D · N N o # 4 # 4.#. 0xLiX LLnC · LiJ . Ue -e:.. N IL N Cy U. 0,. lU l- m' C.~4ZU~ N- LU N-.- . 0 Z. I. I I O ~: 0' 20: 0 F gi mu.. N L* 2I 0 wN-N-Q 0.42 '-p-lwF Li L7 J N 1-04: -40QC: ZL . U * * O 0. ... 4 O W U 2: 2:2: . 4 -4 Xe. . · 4IA /)I Ml't' · NN * * 4L V * 2. I N # c . eod0 . 0 LU , *U - ..J* 0S *e I- " eez . . '2.. ~ : .4
..,
.4.
IA: $ LiLb ·. .. Ooo * I0.c tS OWU *U 0 _ *L -c O > *In C, o- a: I..J0 * . 2LO * I-O · LUb0 .u i o N . * .-. z Z .o L * It . ,, 2 -* .. ~ CL c c * cc I - j L ' .aI 0C 0 .4 1,-i U, ItI k- Li O I . cc -C .. UJ O * I Z $ O. i.- * V O. 1 - * D . U U4X .. UIA U * * 0.J Z 4.* *Y m'-0 ,-. 0.~*t e. . U% O N N IA *I * C0.U W-I- IA 9 4 ZI. x-., X W . -· 2: ZZ * : IA. O"w 1 · J, Li aLu4 * c -a: aa Li * · IA14 4, . -o: o .U. 0u~, U. ·- -.LU~~, I.L
0 Z~ . -. 0 4F C * IA Li Z 5 * r- I . -X -> U. IA LUt _ ZZ U * Li 4 44 .*- a: O~a ts . Ur eU G ' F F , L ~: U O 0 C quUUO .~to o V0O: I 1 . 0 a If "I-' -44 _ C cQ T O O O40 00 o, e n o, LU u,>- a' < Li C: C: O: C: N a:z Z 0.1-1-1-1-In c cr c N Li Z -0 0 11 N 11 11 0 1 z Z LI U tx 2 C ) 1- 0o LiL X<Z Li Li-Il... -2 _ ON 44 4 J : X X : -0 41172:?G t U- -tZ IA m P. 4 u 2 p-zJX c t JN2 0 2: 2: 2: II 0 N 2:2 :4L 02:2:2:11 2 *. .*
a:
lhI D n1 0 O a: a:~ z-> OA 444 Li. C: IAIKa: IA:Z 0~ -vC p-N 0 a. * ¢i ZO - - _.L .J tr Zi UlA -J ZO0 0x -4 0LiXiXZ-J t 1- IA4C - X t LU N -2 :E _: 4 L U IIA U.J. J 0 e 1- t_1 72:, - - _J IA - .*Z- J : *0000 * UI0U e NOCbN p. -· * ~- .-e a0 * _ N '.a * . * L)U. : ~' * Li -a * 41L * · * a:4I_ .-* O UiL U -* . J · * < z 4LiU TUJL * U 1-IA * 0aZ: *: , .Z- : (3. eZ 4.< _'1 2:.* * 1J·U * ·C· 4 . : O . 0 l.. * XOO · * _ .. ~A* -*C .. * _·L7- . 44IA2 Z *~ * .4 L .Q 0 Ul 000 IL C < C > 0-q > U eeeeesU,) "n U 2' UU0 LUW Ca CV, 1 Vt 4>1-U.A0q N U" - c * a: . .. . . 04 Ct .. a: 1-A eeleeeee1- 0: t OU:I a-: 0 0 ). ~ ' N IIv 0 z 4 0 0. L. 0 e U<N ' ~-_e + S -i x a,,- -. O · · · · · IA L O L -c LE Lu1- De 0 DIA 11 0 4 .N .o .- oJ 41 4 ULCz _ - - 4 -IA LU 0 L 4 Z LU a:L L _IL tD _ u 0L O O - O: 1-- Li - C - N_ c, 41 CF 3: Y bo N 0 tU U, L LU 07 I-_W 0UJ 1- LU &L X X X 1- LU Li ... N 0 0 N 4 *000·§oU', * 00 0 ._oO*000 * . · . .04 . o .0 0 .0 0 *0 0coo *0 0 e000 0 O 0 .000 .00, .4 .0000 *0000 *0000 .0000 .:o o0o_0 :§oooo .0, 0 .0000*0 000 .0 *0~000000 *000 .o*o.o*oOc00 .00000 . N _Z · ,.2. ... . * rr OJO.1 ,,- c/*07 7. I'-a:.t1:-...410N S 0**O*WL 40* O G~ a: *V 4 IA 1-- LU_ -- a:tz NC 4< IA ->4U-1-a: -J tI t 1-.JL Li LU LU1-L N C' U -Li _t 0 z a: wstandards are met. It must be emphasized that the sum of the pollution levels and the background levels must not exceed the standards. Plume rise is good, as indicated by the limited mixing depth value.
Wet limestone suffers from the excess particulate loading of limestone injection as shown by boiler particulate emissions. A lower particulate removal efficiency than the other methods also contributes to the plant's failure to meet emission stan-dards. Catalytic oxidation is the only process to make an operating profit through its sale of acid. But its high capi-tal investment requirements, by increasing fixed costs, nullify the cost advantage due to byproducts.
Magnesium oxide scrubbing in this run was placed at a dis-advantage by a high magnesium oxide makeup rate. The makeup costs are over 90% of the total variable operating costs. But even without makeup costs, byproduct credits would not offset operating expenses. The tall stack results point out the meth-od's basic weakness as the sulfur dioxide emission limits are not met. By increasing the stack height, the model was able to meet all the air quality standards, with the twenty-four hour standard apparently being the last one met. Of course,
this method has the lowest costs.
Following each abatement method output is a listing of the abatement parameter values used in the evaluation. These are not titled, but represent the exact data input by the model according to the form used in appendix D. Each line of data
is one input record, as it appears in the parameter data file (file 18) or on the input cards.
MODEL EXAMPLE II
This model is intended to demonstrate to the reader the sensitivity analysis capability of the model, emphasizing its application to sulfur dioxide air quality standards. From the first model example, it appeared that of the three hour and twenty-four hour standards, the latter was tighter and would be more critical in determining plant feasibility. This second model example examines the economic effects of variations in
these two standards.
The second model example evaluates a plant type similar to that of the first model, a coal fired plant at a valley site, but uses only one abatement method, catalytic oxidation. This is done to prevent the economic effects of different abate-ment methods from confusing the standards' effects. The same
process is repeated, using plant sizes of 1000 MW, 200 MW, and 100 MW, to see if the standards influence different plant sizes
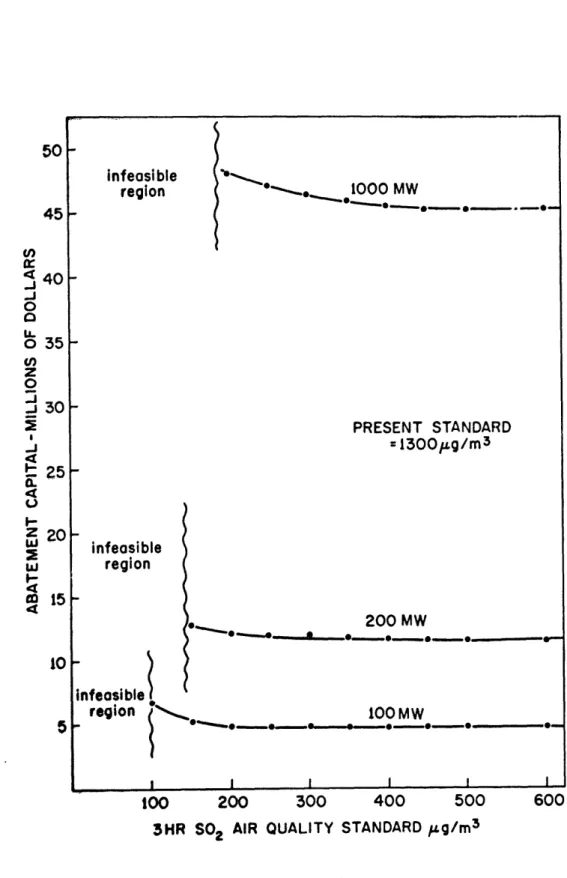
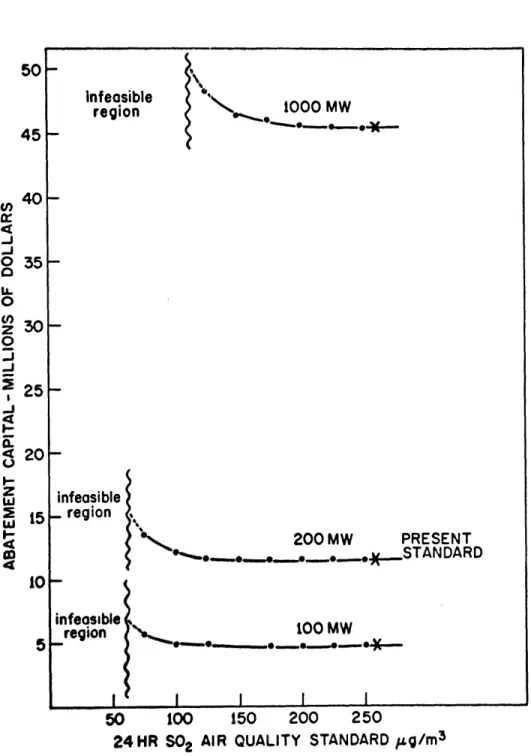
differently. The results, in terms of effects on the capital required for abatement, are shown in figures 2.2 and 2.3.
The figures demonstrate a definite growth in capital as the standards are tightened. There are two factors reflected in the shape of the curves. The flat portion represents the
too 200 300 400 50C
3HR S02 AIR QUALITY STANDARD pug/m3
Figure 2.2. 45 u') 40
J
0
L o 35 UI)z
0
-_ 30 4_
r5
4
0
I-z 2C wI.-4
CD 15 14 IC 600infeasible region infeasible _ region infeasible 100 MW region t MW ,.I I I I I 50 t00 150 200 250
24HR S02 AIR QUALITY STANDARD ,zg/m 3
Figure 2.3.
50 45 en 40 a:4O
-J _1 0 350
UA0
z 300
3
25-.
2
a. 20 -M 44
10 5 __ _ __.__ ___ 1____ __--depends on plant size and the cost of the abatement equipment. The capital required for the minimum necessary stack height of 100 m is also included. The increasing portion of the curve represents the model's constructing added stack height in an effort to meet the tightening standards. A background of
50 g/m3 has been assumed. Eentually the maximum practical
stack height is reached and the plant can no longer meet the standards. This defines the infeasible region. No additional abatement method investment can make the plant operate within its air pollution limits.
For both the three hour and twenty-four hour standards,
several trends are noticeable. The larger a plant is, the
more gradual is the increase in the cost curve as standards
are tightened. This is reasonable, if the higher emission
rates are considered. These would cause the plant to need extra stack sooner, at standard levels where the next incre-mental tightening of the standards is a smaller portion of the whole standard level. Thus, smaller stack height additions
are needed. For example, in the three hour case, the 1000 MW
plant first adds stack height at about 500 ig/m3, where the
next 100 g/m3 reduction is only a 20% change. The 100 MW
plant first adds stack height at 200 pg/m3, where the next
100 pg/m3 reduction is a 50% change. The 100 MW plant must
add stack more quickly as a result.
re-gion, as shown best in figure 2.2. This is directly related to two facts. There is the same maximum allowable stack height for all plants and the larger plants have greater stack emis-sions. Thus the lowest possible concentrations due to a large plant must be greater than those of a smaller plant.
There exist ranges of standards where no capital cost changes result from standards changes. This is due to the fact that the plant pays a base capital price for abatement equipment. This equipment may well put the plant pollution level far below the standard. Additional abatement in the form of added stack is not needed until standards reach the plant pollution level.
The final observation made from model example II is that for this PSA alternative, the twenty-four hour standard is
the more critical in terms of economics. All three plant sizes
have at least a range of 700 ig/m3, or 50% of the present
sul-fur dioxide three hour air quality standard, before stack height addition is needed. This is reflected in the long flat
por-tions of the three hour curves, extended to 1300 g/m3. In
the case of the twenty-four hour standard, it can be seen that
the margin is only 25 to 150 g/m3 before stack height is
need-ed, depending on the plant size considered. While this again
could be considered in the sense of 50% of the present standard,
background levels must be considered.
A 100 g/m3 background level of sulfur dioxide (a
hour standard since it would move along the flat part of the curve. A similar increment along the twenty-four hour curve would either require additional stack or put the plant in the
position where any additional standards change requires more stack. In using these curves, it should be remembered that
they represent a study assumin.g 50 g/m3 background levels.
Thus the 100 g/m3 background just mentioned will only move
50 g/m3 along the curves.
Examples of two of the possible applications of the model were given after providing a model overview and presenting
the model operating logic. The next three chapters will ex-plain in detail plant and boiler modeling, meteorological modeling and the inclusion of the abatement methods.
CHAPTER III
BOILER AND STACK EMISSIONS
The first section of the model will be discussed in this chapter, tracing the flow of air pollutants from their origin in the boiler until they are tested against the source emis-sions standards as they leave the stack. The use of emission factors to predict boiler emissions is explained first, fol-lowed by a discussion of the effects of the abatement process on the pollutant stream, and consideration of the emission standards. It is assumed that the reader is familiar with the general operation of the abatement methods. Those wish-ing an explanation should consult appendix D, which contains a summary of their operating principles and information con-cerning the chemical reactions involved. The present chapter also discusses the methods used to acquire abatement data and the commercial status of the four methods used in the model.
BOILER EMISSION FACTORS
The uncontrolled boiler output of sulfur dioxide and par-ticulates can be approximated through the use of boiler emis-sion factors. These factors, published by the Environmental
1
Protection Agency, are the results of source tests, material balance studies and engineering estimates. They predict the
utility boilers as a function of the amount of fuel being
burned and its sulfur and ash contents, given as a weight per-centage. The sulfur and ash contents are directly specified
as part of the plant specification, and the amount of fuel consumed is easily calculated from two other plant specifica-tions -- boiler heat input and fuel heat equivalent.
Because the boiler emission factors do not differentiate between sulfur dioxide and sulfur trioxide, and because sul-fur trioxide formation is just a few percent of sulsul-fur dioxide formation, all oxides of sulfur are considered to be sulfur dioxide. This assumption results in less than two percent error in the calculation of raw material consumption and by-product by-production in the abatement processes. And since pres-ent emission standards apply only to sulfur dioxide, the as-sumption of all sulfur oxides being sulfur dioxide in no way jeopardizes the plant's adherence to the standards.
When the plant and its fuel are being specified, the
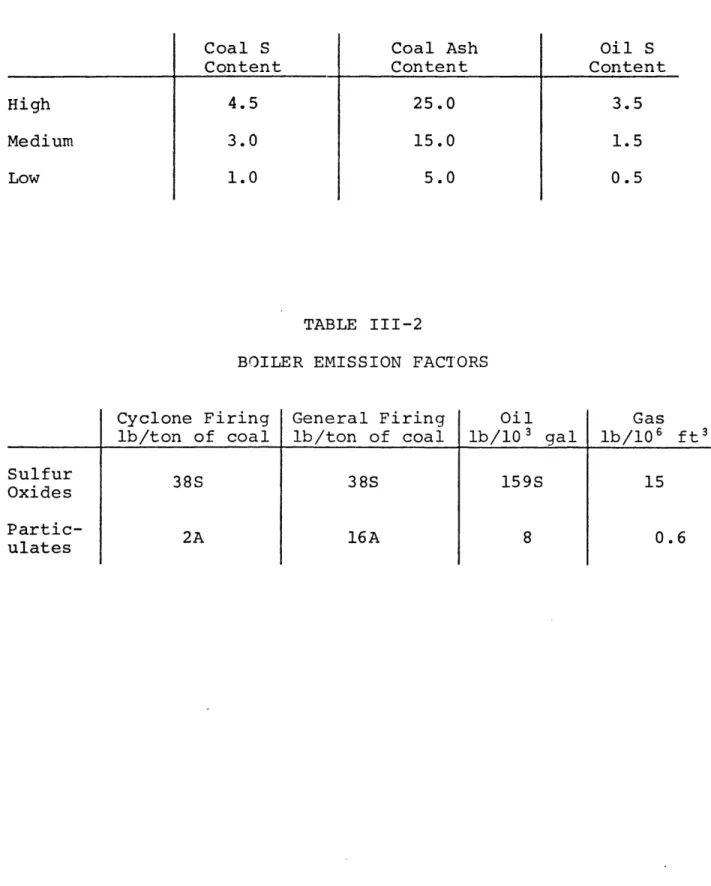
choice of sulfur and ash contents are limited to "high", "medi-um" or "low". Consideration of the properties of different coals and oils suggests the use of the numerical values of
33,34
table III-1. If these values are unacceptable for the
problem being studied, they are easily redefined in the model. For the type of boiler the model deals with, the follow-ing emission factors will apply. "S" represents the fuel sul-fur content in percent and "A" has the same definition with
TABLE III-1
REPRESENTATIVE SULFUR AND ASH CONTENTS
Coal S Content 4.5 3.0 1.0 Coal Ash Content 25.0 15.0 5.0 Oil S Content 3.5 1.5 0.5 TABLE III-2
BOILER EMISSION FACTORS
Cyclone Firing lb/ton of coal 38S General Firing lb/ton of coal 38S Oil lb/10 3 gal 159S Gas lb/106 ft3 15 16A High Medium Low Sulfur Oxides Partic-ulates . - S | ~~~~~~-· - g --2A 8 0.6
respect to ash content. The absence of an "A" or "S" factor indicates that the fuel type has such consistent emission pro-perties that the emission rate of that pollutant is essentially constant. The emission factors are shown in table III-2. The remaining unmentioned plant specification parameters are need-ed in later model steps, but do not affect the rates cf pollu-tant emission as determined by emission factors.
At this point the model has determined the flow of pollu-tants leaving the boiler and entering the abatement equipment. There are only two critical factors to be considered in rela-tion to the abatement process' effect on the flow of sulfur dioxide and particulates coming from the boiler. First is the possibility of the abatement process adding to the emissions already coming from the boiler. For example, limestone injec-ted into the boiler during the wet limestone scrubbing process increases particulate flows. Second is the efficiencies of sulfur dioxide and particulate removal accomplished by the process. These determine what quantities of pollutants escape as stack emissions and what quantities are removed to become process wastes or byproducts. The calculation of these addi-tional pollutants and of the process wastes and byproducts is explained in appendix D along with the previously mentioned explanations of process chemistry.
The emissions of sulfur dioxide and particulates, as de-termined by boiler emissions and abatement removal efficien-cies, are then expressed in terms of the plant heat input so
as to conform with the emission standards. If either of the standards, for sulfur dioxide or particulates, is exceeded, the plant-site-abatement (PSA) alternative is said to be en-vironmentally infeasible and the remainder of the model is not evaluated.
The abatement methods are one pass devices and little can be done to improve their removal efficiencies from their de-sign values. Because of the low concentrations of sulfur di-oxide and particulates in the flue gases, it is not economi-cally attractive to install abatement devices in series. Not only can removal efficiencies suffer when dealing with the extremely dilute gas at the tail end of the first abatement device, but also the cost per pound of pollutant removed can become ten or more times greater since the same volume of flue gas must be treated. Thus, there is no realistic alternative to declaring a PSA combination infeasible if it fails to meet the emission standards with the single abatement device.
If the standards are both met, the emission rates are used in the meteorological modeling portion of the model to check the plant's adherence to the air quality ground level standards.
ABATEMENT PROCESS DATA
As the reader will see in the next chapter on meteorologi-cal modeling, models of the atmosphere's dispersion characteris-tics are empirical and can result in large errors. But they
are used because they are the best tools available which en-joy industry wide acceptance. Unfortunately, no such models enjoying industry wide acceptance exist for the abatement methods used in this thesis. This portion of the chapter ex-plains how the particular methods were chosen and how data was obtained for them.
Approximately sixty means of sulfur dioxide removal are currently being or have recently been explored by industry, government and universities. Some of these simultaneously
remove particulates, some do not. Perhaps half a dozen methods for particulate removal are commonly used. All together, the possible combinations of sulfur dioxide and particulate re-moval equipment are far too numerous to be considered in one or even several models.
The problem of choosing a representative set of abatement methods was first approached by searching through the relevant literature. This narrowed the field considerably and the sec-ond phase of the search involved writing to about a dozen of the leading developers of sulfur dioxide removal equipment.
The companies were queried on process operations and eco-nomics in an effort to determine what factors affected removal efficiencies, power plant operation, capital investment, oper-ating costs and plume behavior. The replies were of varying quality and generally reflected more certainty about process operations than economics. Because of proprietary reasons, ongoing research or lack of operating experience, several
manu-facturers declined to supply certain operating and cost data. In the third phase, further literature searching was per-formed to clarify some of the manufacturers' replies and seve-ral utilities with involvement in prototype testing were con-tacted in hopes of complementing the manufacturers' data. Fi-nally, on the basis of the information gathered from all of these sources, and most importantly, on the basis of an EPA
recommendation,1 1 the following processes were chosen as
repre-senting the best available abatement systems:
a) wet limestone scrubbing b) catalytic oxidation
c) magnesium oxide scrubbing
"Best" in this case means holding the promise of achieving design aims, having had significant operating experience or contracts to evaluate the process under commercial operation, and being adaptable to relatively straightforward model repre-sentation.
It is possible that subsequent prototype testing and oper-ating experience may indicate that these processes are not
competitive and some other technology may gain acceptance as the abatement method of the late '70's and '80's. Or it may occur that the same experience may result in drastic process alterations. Either of these eventualities, or some of the arbitrary design decisions made in the specification of the models, may mean that the actual commercial abatement
equip-ment will differ greatly from the models. Due to the embry-onic state of the commercial flue gas desulfurization industry and the accompanying absence of accepted operating and costs models, there seems to be no way to protect against the possi-bility of model obsolescence. Thus the main thrust of the abatement model development has been to maintain flexibility while representing the significant features of each process as they now exist.
COMMERCIAL STATUS OF ABATEMENT PROCESSES
In addition to the above methods of abatement, a fourth was modeled: tall stacks. This method, employing electro-static precipitators with tall stack heights, is included for contrast and to examine alternatives, such as low sulfur fuel, for which flue gas desulfurization might be unnecessary. Of the four methods, only the tall stack-precipitator combination has had significant operating experience since this is the typical means of controlling air pollution in most existing power plants. The other methods have had prototype experience and limited operating experience but are still subject to sible design changes and new cost estimates. Despite the pos-sibility of such changes, many utilities are now contracting
to buy removal installations for future plants in the expec-tation that by the start up dates, present technical problems will be solved. The three sulfur dioxide abatement methods
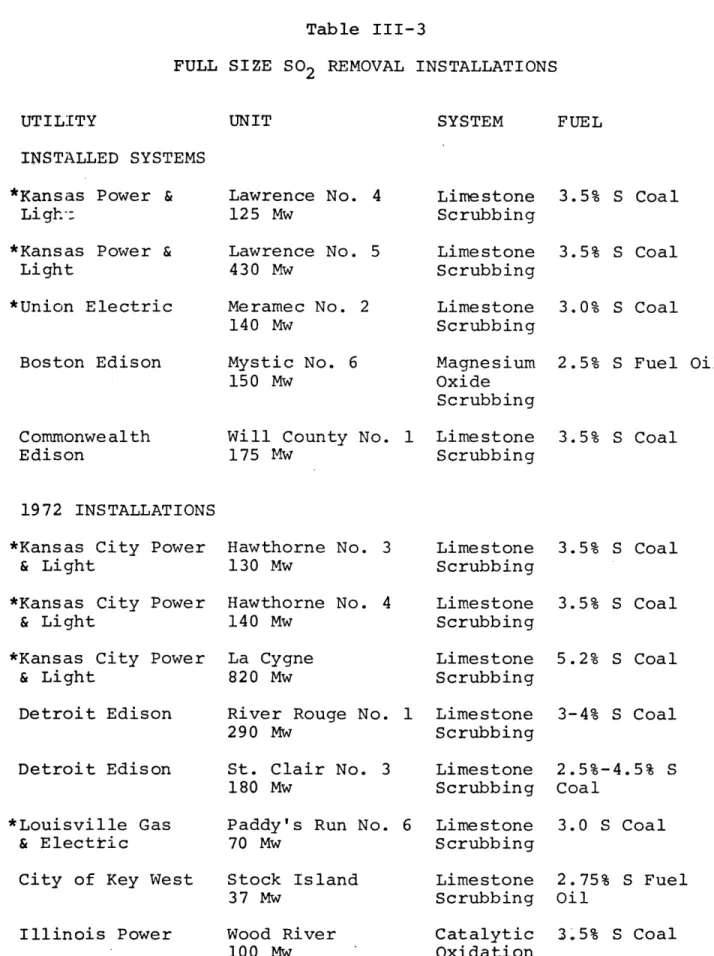
chosen account for nineteen of the twenty full size instal-lations operating or on order as of mid-1972.
Wet limestone scrubbing (see references 8-20) is offered by several companies, including Combustion Engineering,
Bab-cock & Wilcox, and Research-Cottrell, but Combustion Engineer-ing apparently leads in both operatEngineer-ing experience and orders for new systems. Thus its system design was chosen for use in the model as being representative of the general process. To date, plugging fouling and corrosion due to deposition of
calcium sulfate and other solids from the slurry have hampered operations. The problem of safe disposal of the waste pro-ducts in the settling pond also presents a formidable operat-ing problem for users. This method remains the most popular
11
abatement method being ordered as table III-3 shows.
Com-bustion Engineering's contracts are shown with an asterisk. Catalytic oxidation (see references 8-12 and 21-23) is exclusively offered by Monsanto Enviro-Chem. This process has been tested for several years on a prototype system for the Metropolitan Edison Company in Pennsylvania, and is being
tested with a full size installation by Illinois Power. It
has higher capital costs and is more difficult to retrofit onto an existing plant than wet limestone scrubbing. Hence contracts for this process are fewer. Monsanto should be able to demonstrate adequately operating performance with the 100 MW Illinois Power installation. That installation is also being monitored by the EPA to determine system performance and
re-Table III-3
FULL SIZE SO2 REMOVAL INSTALLATIONS
UNIT SYSTEM FUEL
INSTALLED SYSTEMS *Kansas Power &
Ligh:
*Kansas Power & Light *Union Electric Boston Edison Commonwealth Edison Lawrence No. 4 125 Mw Lawrence No. 5 430 Mw Meramec No. 2 140 Mw Mystic No. 6 150 Mw
Will County No. 1
175 Mw Limestone Scrubbing Limestone Scrubbing Limestone Scrubbing Magnesium Oxide Scrubbing Limestone Scrubbing 3.5% S Coal 3.5% S Coal 3.0% S Coal 2.5% S Fuel Oil 3.5% S Coal 1972 INSTALLATIONS *Kansas City Power
& Light
*Kansas City Power
& Light
*Kansas City Power
& Light
Detroit Edison
Detroit Edison
*Louisville Gas
& Electric
City of Key West
Illinois Power Hawthorne No. 3 130 Mw Hawthorne No. 4 140 Mw La Cygne 820 Mw
River Rouge No.
290 Mw
St. Clair No. 3 180 Mw
Paddy's Run No.
70 Mw Limestone Scrubbing Limestone Scrubbing Limestone Scrubbing 1 Limestone Scrubbing Limestone Scrubbing 6 Stock Island 37 Mw Wood River 100 Mw Limestone Scrubbing Limestone Scrubbing Catalytic Oxidation 3.5% S Coal 3.5% S Coal 5.2% S Coal 3-4% S Coal 2.5%-4.5% S Coal 3.0 S Coal 2.75% S Fuel Oil 3.5% S Coal UTILITY
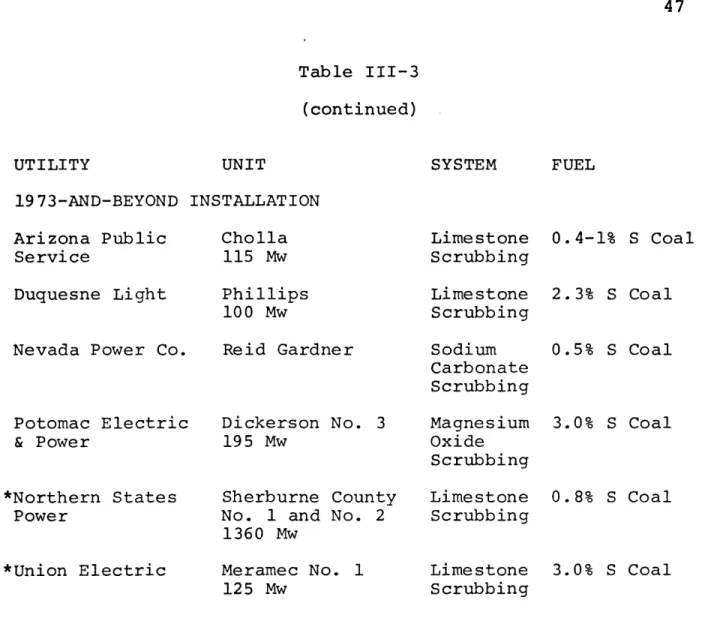
Table III-3 (continued) SYSTEM FUEL 19 73-AND-BEYOND INSTALLATION Arizona Public Service Cholla 115 Mw Limestone Scrubbing 0.4-1% S Coal Duquesne Light
Nevada Power Co.
Potomac Electric & Power *Northern States Power *Union Electric Phillips 100 Mw Reid Gardner Dickerson No. 3 195 Mw Sherburne County No. 1 and No. 2 1360 Mw Meramec No. 1 Limestone Scrubbing Sodium Carbonate Scrubbing Magnesium Oxide Scrubbing Limestone Scrubbing Lime stone 125 Mw Scrubbing 2.3% S Coal 0.5% S Coal 3.0% S Coal 0.8% S Coal 3.0% S Coal UTILITY UNIT
sults should be available in late 1973. A major problem ap-pears to be the 77.7% concentration of the byproduct acid, which makes it difficult to find a byproduct market, and ad-versely affects credits for the process.
The magnesium oxide scrubbing system of the model (see references 8-12 and 24-27) i marketed by Chemico-Basic in a joint effort. Already installed on a Boston Edison plant, this process is being tested by the EPA and the utility. Re-sults should become available also in late 1973. The Essex Chemical Company operates the magnesium oxide recovery plant in Rhode Island. In 1973 Potomac Electric & Power Company will complete installation of the Chemico-Basic system on
another plant to gain system operating data and to test fur-ther the concept of centralized recovery using crystals from several power plants. Initial problems at the Boston Edison plant involved poor centrifuge performance which resulted in plugging and deposits in the scrubbing liquid system.
All of the three abatement processes which remove sulfur dioxide should begin producing representative operating and cost data by the end of this year, if the new installations solve their initial difficulties. For the present, predicted design data and prototype results give the best feeling for their performance. Performance and costs of precipitators are well established. Stack cost data is highly dependent on the exact site and stack design used, and for this model TVA data was used to determine the parameters of the stack