Publisher’s version / Version de l'éditeur:
Vous avez des questions? Nous pouvons vous aider. Pour communiquer directement avec un auteur, consultez la première page de la revue dans laquelle son article a été publié afin de trouver ses coordonnées. Si vous n’arrivez pas à les repérer, communiquez avec nous à PublicationsArchive-ArchivesPublications@nrc-cnrc.gc.ca.
Questions? Contact the NRC Publications Archive team at
PublicationsArchive-ArchivesPublications@nrc-cnrc.gc.ca. If you wish to email the authors directly, please see the first page of the publication for their contact information.
https://publications-cnrc.canada.ca/fra/droits
L’accès à ce site Web et l’utilisation de son contenu sont assujettis aux conditions présentées dans le site LISEZ CES CONDITIONS ATTENTIVEMENT AVANT D’UTILISER CE SITE WEB.
Client Report (National Research Council of Canada. Construction), 2015-05-06
READ THESE TERMS AND CONDITIONS CAREFULLY BEFORE USING THIS WEBSITE.
https://nrc-publications.canada.ca/eng/copyright
NRC Publications Archive Record / Notice des Archives des publications du CNRC : https://nrc-publications.canada.ca/eng/view/object/?id=ccfd8dff-949f-4df5-b140-d0caed5ad4fa https://publications-cnrc.canada.ca/fra/voir/objet/?id=ccfd8dff-949f-4df5-b140-d0caed5ad4fa
NRC Publications Archive
Archives des publications du CNRC
For the publisher’s version, please access the DOI link below./ Pour consulter la version de l’éditeur, utilisez le lien DOI ci-dessous.
https://doi.org/10.4224/23002858
Access and use of this website and the material on it are subject to the Terms and Conditions set forth at
Performance evaluation of proprietary drainage components and
sheathing membranes when subjected to climate loads, task 7:
summary report on experimental and modelling tasks and
recommendations
Lacasse, Michael A.; Armstrong, M.; Cornick, S. M.; Maref, W.; Moore, T.;
Mukhopadhyaya, P.; Saber, H. H.
Construction
Performance Evaluation of Proprietary
Drainage Components and Sheathing
Membranes when Subjected to Climate
Loads
Task 7 — Summary Report on Experimental
and Modelling Tasks and Recommendations
Michael A. Lacasse, M. Armstrong, S. M. Cornick,
W. Maref, T. Moore, P. Mukhopadhyaya, H. H. Saber
PERFORMANCE EVALUATION OF PROPRIETARY DRAINAGE COMPONENTS AND SHEATHING MEMBRANE
Table of Contents
Table of Contents...i
List of Figures ...iii
List of Tables... v
Acknowledgements...vii
Summary ...ix
1.0 Background and Introduction... 1
2.0 Project Overview and Summary Description of Tasks ... 2
3.0 Description of Wall Assemblies & Hygrothermal Property Characterization... 4
3.1. Description of Wall Assemblies (Task 1)... 4
3.1.1 Reference Wall Assembly... 4
3.1.2 Client Wall Assemblies ... 6
3.2 Task 2 (Hygrothermal Property Characterization) ... 8
3.3 Defining Climate Loads on Wall Assembly & Drainage Systems (Task 5) ... 9
3.3.1 Weather data for hygrothermal simulation ... 9
3.4 Response of Wall Assemblies & Drainage Systems to Climate Loads (Task 5)... 11
3.4.1. From climate loads to wind-driven rain loads acting on cladding and wall assembly ... 11
3.4.2 Water entry behind cladding due to permeation of cladding and deficiencies... 11
3.4.3 Water retention in respective drainage systems ... 11
3.4.4 Moisture loads in drainage cavity at given storey heights ... 13
3.4.5 Distribution of moisture loads within drainage cavity... 13
4.0 Defining Performance Attributes... 14
4.1 Locations of Interest in Assessing Performance of Wall Assemblies... 14
4.2 Performance criteria... 15
4.2.1 RHT index ... 16
4.2.2 Mould index... 16
4.2.3 Comparison of RHT index to Mould index ... 16
5.0 Overview of Hygrothermal Simulation Model, hygIRC-C ... 17
PERFORMANCE EVALUATION OF PROPRIETARY DRAINAGE COMPONENTS AND SHEATHING MEMBRANE
REPORT A1-000030.09 ii
Table of Contents
6.0 Summary of Results Derived from Hygrothermal Simulation ... 18
6.1 Results... 18
6.2 Discussion of Results... 20
Client Wall assemblies not performing as well as Reference wall ... 20
Client A wall drainage system. ... 20
Client D wall drainage system. ... 21
Client G wall drainage system l. ... 21
Client I wall drainage system s. ... 22
7.0 Recommendations... 23
8.0 Technical Guide Evaluation Procedure & Test Protocols ... 23
8.1 Technical Guide Evaluation Procedure... 23
8.2 Test Protocols ... 27
PERFORMANCE EVALUATION OF PROPRIETARY DRAINAGE COMPONENTS AND SHEATHING MEMBRANE
List of Figures
Figure 1 – Project Overview ... 3
Figure 2 – (a) Vertical Sectional views of West and East coast solutions for stucco installation with capillary break; (b) Horizontal sectional view of East coast solution ... 5
Figure 3 – Water vapour permeance of sheathing membranes as a function of RH used in respective Client drainage systems; δ = thickness of membrane or insulation product... 8
Figure 4 – Reference and Client wall system Drainage-Retention Curves... 12
Figure 5 - Moisture loads within drainage cavities at given storey height ... 13
Figure 6 – Illustration of moisture load distribution within drainage cavity ... 14
Figure 7 – Locations of interest within wall assemblies in assessing relative performance ... 15
PERFORMANCE EVALUATION OF PROPRIETARY DRAINAGE COMPONENTS AND SHEATHING MEMBRANE
PERFORMANCE EVALUATION OF PROPRIETARY DRAINAGE COMPONENTS AND SHEATHING MEMBRANE
List of Tables
Table 1 – 2010 National Building Code requirements for Capillary Breaks in Coastal areas (degree-days < 3400 and MI > 0.9, or degree days ≥ 3400 and MI > 1.0) Table 2 - Common components of the wall assemblies and exceptions
Table 3 – Summary of Reference and Client Wall Assembly Components Table 4 – Climate Characteristics of Tofino and
Vancouver, BC and St. John’s, NL over 2-year simulation period
Table 5 –Summary of Results Obtained for Depths of Venting and Drainage Cavities Table 6 - Description of Mould Index (M) levels [18, 19, 20]
Table 7 - Mould growth sensitivity classes and some corresponding materials [20]
Table 8 – Summary of Simulation Results of Reference and Respective Client Wall Assemblies Table 9 - Recommendations for incorporation of sheathing membrane and “venting” strategy for
respective Client wall assemblies
Table 10 - Industry related test methods required to characterise the performance of a proponent’s drainage system to that of the Referenced wall drainage system
PERFORMANCE EVALUATION OF PROPRIETARY DRAINAGE COMPONENTS AND SHEATHING MEMBRANE
PERFORMANCE EVALUATION OF PROPRIETARY DRAINAGE COMPONENTS AND SHEATHING MEMBRANE
Acknowledgements
The author of this wishes to extend thanks to the Air Barrier Association of American (ABAA) for having managed and arranged support for this project and in particular, to Mr. Laverne Dalgleish for his highly proficient handling of all technical and non-technical issues that arose over the course of the project. As well, acknowledgment is made of project support, technical meeting participation and the many and very useful contributions made by the respective project partners, and that included:
Benjamin Obdyke Incorporated
Canadian Concrete Masonry Producers Association Cosella-Dorken
DuPont Tyvek Weatherization Systems HAL Industries Incorporated
Home Protection Office of British Columbia – HPO Keene Building Products™
GreenGuard® Building Products (formerly Pactiv Building Products) Roxul Incorporated
STO Corporation
TYPAR® Weather Protection System (Polymer Group Incorporated)
Our thanks are also extended to our colleagues within NRC-Construction for their technical support, advice, and feedback during the course of this project and who helped support the work described in this Task report including: K. Abdulghani, M. Armstrong, S. Bundalo-Perc, S. M. Cornick, B. Di Lenardo, G. Ganapathy, W. Maref, P. Mukhopadhyaya, H. H. Saber, M.C. Swinton and D. Van Reenen.
PERFORMANCE EVALUATION OF PROPRIETARY DRAINAGE COMPONENTS AND SHEATHING MEMBRANE
PERFORMANCE EVALUATION OF PROPRIETARY DRAINAGE COMPONENTS AND SHEATHING MEMBRANE
Summary
A Reference assembly and a series of 11 client wall assemblies were developed as part of the project “Performance Evaluation of Proprietary Drainage Components and Sheathing Membranes when Subjected to Climate Loads”.
The purpose of this project was to assess the performance of walls with drainage components and sheathing membranes (drainage system) in their ability to provide sufficient drainage and drying in Canadian climates with a moisture index (MI) greater than 0.9 and less than 3400 degree-days, or MI greater than 1.0 and degree days ≥ 3400 (primarily coastal areas). In these regions, the 2010 National Building Code of Canada (NBC) requires a capillary break behind all Part 9 claddings and conforming to the requirements given in § 9.27 (Cladding) of the NBC. Currently, acceptable solutions to the NBC capillary break requirement include:
(a) A drained and vented air space not less than 10 mm deep behind the cladding;
(b) An open drainage material behind the cladding, not less than 10 mm thick and with a cross-sectional area that is not less than 80% open;
(c) A cladding loosely fastened, with an open cross section (i.e. vinyl, aluminum siding);
(d) A masonry cavity wall or masonry veneer constructed according to § 9.20 (i.e. 25 mm vented air space).
In this project, the performance of proposed alternative solutions for the capillary break was compared through laboratory evaluation and modeling activities to the performance of a wall built to minimum NBC requirements (Reference wall assembly). The proposed drainage system would be deemed an alternative solution to the capillary break requirement in the NBC for use with current code compliant Part 9 claddings provided it exhibited better or equal moisture performance as compared to a NBC-compliant Reference wall assembly.
In This Report — Results from hygrothermal simulation are summarised in which the response of a
series of 11 Client walls are compared to a Reference wall when subjected to the climate conditions of Tofino, BC, Vancouver BC, and St. John’s NL. Results from simulation of the Client’s and the Reference wall are provided over a two year simulation period to the selected Canadian locations and comparisons are made on the basis two performance criteria; the: (i) Mould index (MIDX) criterion (risk to
mould growth), and; (ii) Relative humidity-temperature RHT(x) criterion (risk to the growth of wood rot fungi).
Summary information has also been provided on the inputs required to complete hygrothermal simulations, including:
A description of the reference wall assembly
Descriptions of wall assemblies and their respective drainage component characteristics Hygrothermal property characteristics
PERFORMANCE EVALUATION OF PROPRIETARY DRAINAGE COMPONENTS AND SHEATHING MEMBRANE
REPORT A1-000030.09 x
Defining the moisture loads acting on components within the wall assembly in consideration of the amount of water entry to and drainage from wall assemblies
Water retention in drainage systems
Defining performance attributes of wall components in terms of selected performance criteria including the mould index and RHT index.
Recommendations — On the basis of the results derived from simulation, recommendations are made as to the appropriate number of layers of sheathing membrane and air exchange strategy to include in specifications of wall assemblies to ensure that the values for Mould Index (MI) and RHT(x) index are below those of the Reference wall components.
PERFORMANCE EVALUATION OF PROPRIETARY DRAINAGE COMPONENTS AND SHEATHING MEMBRANE
Performance Evaluation of Proprietary Drainage Components and
Sheathing Membranes when Subjected to Climate Loads –
Task 7 – Summary Report on Experimental and Modelling Tasks
and Recommendations
Authored by:
M. A. Lacasse, M. Armstrong, S. M. Cornick, W. Maref, T. Moore, P. Mukhopadhyaya and H. H. Saber
A Report for the
AIR BARRIER ASSOCIATION OF AMERICA (ABAA)
1600 BOSTON-PROVIDENCE Highway
WAYPOLE, MA 02081
USA
ATT: Mr. Laverne Dalgleish
National Research Council Canada Ottawa ON K1A 0R6 Canada
May 6, 2015
This report may not be reproduced in whole or in part without the written consent of both the client and the National Research Council of Canada.
PERFORMANCE EVALUATION OF PROPRIETARY DRAINAGE COMPONENTS AND SHEATHING MEMBRANES
Performance Evaluation of Proprietary Drainage Components and
Sheathing Membranes when Subjected to Climate Loads –
Task 7 –
Summary Report on Experimental and Modelling Tasks
and Recommendations
Final Report Forming Part of Task 7
M. A. Lacasse, M. Armstrong, S. M. Cornick, W. Maref, T. Moore, P. Mukhopadhyaya and H. H. Saber
1.0 Background and Introduction
The objective of this project was to assess the hygrothermal performance of wall assemblies incorporating drainage components. More specifically, it was of interest to evaluate the ability of wall assemblies to provide sufficient moisture dissipation through the process of drainage and drying of water from these components when subjected to Canadian climates having a moisture index (MI) greater than 0.9 and less than 3400 degree-days, or MI greater than 1.0 and degree days ≥ 3400 (primarily coastal areas).
In these climates, the 2010 National Building Code of Canada (NBC) requires a capillary break behind all Part 9 claddings [1]. Currently, acceptable solutions to the NBC requirement for a capillary break
include:
a) A drained and vented air space not less than 10 mm deep behind the cladding;
b) An open drainage material behind the cladding, not less than 10 mm thick and with a cross-sectional area that is not less than 80% open;
c) A cladding loosely fastened, with an open cross section (i.e. vinyl, aluminum siding);
d) A masonry cavity wall or masonry veneer constructed according to § 9.20 (i.e. 25 mm vented air space).
In this project, the hygrothermal performance of proposed alternative solutions for the capillary break was compared using laboratory testing and modeling activities to the performance of a wall (NBC code-compliant Reference wall) built to minimum NBC requirements using the following performance criteria:
(a) RHT criterion, and; (b) Mould index criterion.
If a proposed wall system incorporating a drainage component exhibited a level of performance equal to or better than the NBC-compliant Reference wall, it would be deemed an alternative solution to the 2010 NBC requirement for a capillary break and could be used with all presently recognized code compliant Part 9 claddings as acceptable solutions [1].
TASK 7 – SUMMARY REPORT OF EXPERIMENTAL AND MODELING TASKS AND RECOMMENDATIONS
REPORT A1-000030.09 2
The hygrothermal performance of wall assemblies incorporating drainage components was assessed on the basis of the results obtained from numerical simulation of a NBC code-compliant Reference wall assembly when subjected to environmental loads for selected locations in Canada and conforming to interior boundary conditions as described in the ASHRAE Standard S-160 [2].
In this report, an overview of the approach to assess the hygrothermal performance of wall assemblies is provided and a summary is given of results from hygrothermal simulation for each of the client (partner) wall assemblies (A to K, inclusive). The details of the results from hygrothermal simulation of the Reference wall and Client walls are given in three companion reports (A1-000030.07; A1-000030.08; A1-000030.10) [3].
2.0
Project Overview and Summary Description of Tasks
The project was realised through several tasks [3], for which an overview is provided in Figure 1, and in which is depicted the interrelation amongst the different tasks, and as well, examples of the outputs from the project (e.g. industry applicable test methods; drainage-retention tests). Given that the basis for assessing performance of the wall assemblies incorporating drainage components was the results derived from hygrothermal simulation, the majority of the tasks relate to preparing information suitable for input to the hygrothermal simulation model, hygIRC-C.
Task 1, seen in Figure 1, relates to defining the respective Client wall assemblies, the Reference wall and related components, and from which specification details were developed; from this information, the configuration of the respective walls was generated that that was suitable for input to the model. Results from this work are provided in the Task 1 report (Appendix 1).
In Task 2, hygrothermal properties of key components of the wall assembly were evaluated and are reported in the Task 2 report [3]; these properties were likewise input to the model.
Task 3 of the project concerns the benchmarking exercise, whereby experimental results were compared to that obtained from the simulation model, and assumptions related to the physics of the phenomena being modeled were verified prior to input to the model. A description of the hygrothermal simulation model and previous work undertaken to benchmark the model are provided in the Task 3 report [3]. The third and fourth Tasks are linked together; in Task 4, experimental work was carried out on the cavity component of a generic wall assembly to permit benchmarking the variations in air flow in the cavity, as induced mechanically with an air pump, to that simulated with the model. A detailed description of the test apparatus, instrumentation, and methods used to benchmark the response of the model is provided in the Task 4 report [3], together with the results from air flow measurements of several different cavity sizes, as well as measurements on cavities in which were placed different drainage components.
2ASHRAE Standard S-160
PERFORMANCE EVALUATION OF PROPRIETARY DRAINAGE COMPONENTS AND SHEATHING MEMBRANES
Figure 1 – Project Overview
Task 5 relates to work undertaken to define climate loads and to provide an estimate of water entry through the specified cladding and moisture retention within the cavity located behind the cladding, in relation to a range of anticipated wind-driven rain loads. In the definitive task, Task 6, a parametric study was undertaken to assess the performance of the various wall assemblies, many incorporating drainage components to manage moisture loads to the drainage cavity. Results provided in the Task 6 report [3] form the basis for determining whether wall assemblies incorporating drainage components exhibit adequate performance as compared to the NBC-compliant Reference wall.
The final Task, Task 7 (current Report), although not shown in the figure, is comprised of: A summary of the hygrothermal results;
A brief description of the approach and related industry applicable test methods used to evaluate the respective Client drainage systems, and, on the basis on the simulation results;
Recommendations of appropriate choices for sheathing membrane and venting strategies for the different client drainage systems.
Each of these tasks is briefly summarised in the subsequent sections, although not in numerical order, and thereafter, a summary of the results is presented and comments are provided on the response of the respective Client drainage system to moisture loads and their capability in meeting minimum NBC performance requirements as established by the response of the Reference wall assembly.
TASK 7 – SUMMARY REPORT OF EXPERIMENTAL AND MODELING TASKS AND RECOMMENDATIONS
REPORT A1-000030.09 4
3.0
Description of Wall Assemblies & Hygrothermal Property
Characterization
3.1. Description of Wall Assemblies (Task 1)
The approach used in this evaluation was a comparison of the various Client wall assemblies incorporating wall drainage components and sheathing membranes against that of a Reference wall assembly with respect to their hygrothermal performance. A brief description of the Reference wall assembly and client assemblies follows.
The Reference wall assembly was considered capable of providing sufficient drainage and drying in Canadian climates of coastal areas as described in Table 1. In these regions, the 2010 National Building Code requires a capillary break behind all Part 9 claddings.
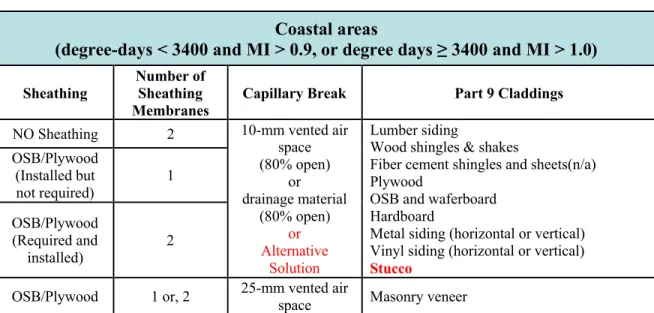
Table 1 – 2010 National Building Code requirements for Capillary Breaks in Coastal areas (degree-days < 3400 and MI > 0.9, or degree days ≥ 3400 and MI > 1.0)
3.1.1 Reference Wall Assembly
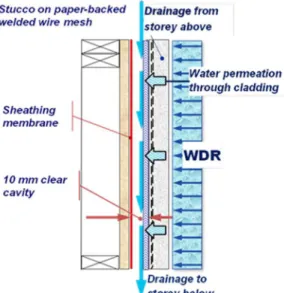
The reference wall assembly was developed based on minimum code requirements. Stucco cladding was chosen from among the Part 9 claddings (listed in Table 1), as the “worst case scenario” for water
penetration. This selection was based on previous work at NRC on the moisture management for exterior wall systems [4], in which it was demonstrated that stucco resulted in the highest moisture load behind the primary line of protection, due to its absorptive properties, and rain penetration at cracks.
Two alternative code compliant solutions for stucco installation were considered (see Figure 2):
A solution predominantly practiced on the West Coast, with paper-backed welded wire mesh lath, and a 10 mm clear cavity;
4NRC, Final Report from Task 8 of MEWS Project (T8-03) - Hygrothermal Response of Exterior Wall Systems to
Climate Loading: Methodology and Interpretation of Results for Stucco, EIFS, Masonry and Siding-Clad Wood-Frame Walls; Research Report, NRC Institute for Research in Construction, 2002-11-01
Coastal areas
(degree-days < 3400 and MI > 0.9, or degree days ≥ 3400 and MI > 1.0)
Sheathing
Number of Sheathing
Membranes Capillary Break Part 9 Claddings
NO Sheathing 2 10-mm vented air space (80% open) or drainage material (80% open) or Alternative Solution Lumber siding
Wood shingles & shakes
Fiber cement shingles and sheets(n/a) Plywood
OSB and waferboard Hardboard
Metal siding (horizontal or vertical) Vinyl siding (horizontal or vertical)
Stucco OSB/Plywood (Installed but not required) 1 OSB/Plywood (Required and installed) 2
PERFORMANCE EVALUATION OF PROPRIETARY DRAINAGE COMPONENTS AND SHEATHING MEMBRANES
A solution predominantly practiced on the East Coast, with expanded metal lath (no paper backing) installed on 19 mm strapping.
The East Coast solution was selected for the reference wall assembly, and deemed to be the “worst case scenario” due to the ability for stucco to pass through the metal lath and into the drainage cavity. Unlike the West Coast solution, this East Coast wall has no layer of building paper behind the lath to reduce the possibility of stucco compromising the required clear 10 mm capillary break between the stucco cladding and back-up wall.
A cross sectional view of the selected NBC code-compliant reference wall assembly is presented in Figure 2 and full details of the reference wall assembly and components are provided in the
Task 1 report [3].
Figure 2 – (a) Vertical Sectional views of West and East coast solutions for stucco installation with capillary break; (b) Horizontal sectional view of East coast solution
( ¾-in.)
(a)
TASK 7 – SUMMARY REPORT OF EXPERIMENTAL AND MODELING TASKS AND RECOMMENDATIONS
REPORT A1-000030.09 6
The NBC [Error! Bookmark not defined.] additionally requires the wall to be vented and flashed at the bottom of the wall having a maximum of 3.5 storeys. Whereas the constructed drainage system of wall assemblies for lab evaluation were 1.83 m (6 ft.) in height, subsequent modeling activities took into account the performance of the full 3.5 storey assembly, including the influence of associated rain and wind loads on hygrothermal performance.
3.1.2 Client Wall Assemblies 3.1.2 Client Wall Assemblies
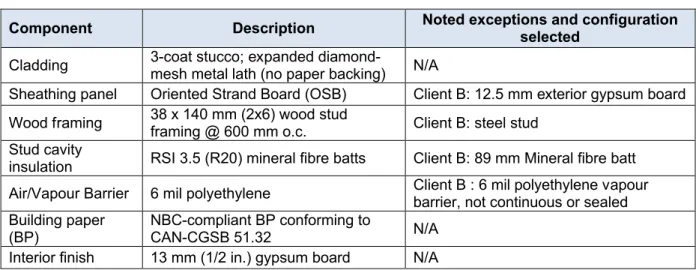
Client assembly designs were based on consultations between the individual clients and NRC-Construction. A list of common components of most of the wall assemblies is given in Table 2 whereas the list of wall assemblies and their respective characteristic drainage component are provided in Table 3.
Of note is that all client walls featured the same stucco cladding as the Reference wall. The other common elements, with exceptions noted for the Client B wall, included the: sheathing panel, frame and stud cavity insulation, air and water vapour barrier and interior finish. Where building paper (BP) was used as protection for the sheathing membrane, this was a NBC-compliant BP conforming to
CAN-CGSB 51.32.
In Table 3, a description is provided for each of the respective client wall assemblies, of the drainage layer, the layer separating the cladding from drainage layer (i.e. typically none, but could be building paper or a polymer-based fabric serving to restrict ingress of stucco to drainage cavity), the sheathing membrane, used to protect the wood-based sheathing panel (typically OSB), and the drainage cavity “venting” strategy. In this report, for the purposes of describing the different “venting” strategies, “vented” is a drainage system closed at the of top of the system but “vented” at its base, whereas, “ventilation” implies that the drainage system cavity is open at the top and base of the wall. Given that this cladding was chosen as a “worst case scenario”, and if it were determined that the
drainage element of the Client assembly demonstrated the ability to manage the water loads introduced by the stucco cladding, the drainage element of the Client assembly was deemed an alternative drainage solution suitable for use with currently acceptable code compliant claddings, as given in Table 1. In the Task 1 report, cross sectional diagrams are provided for each wall assembly together with a table describing the elements that differ from the NBC code-compliant reference wall assembly.
Table 2 - Common components of the wall assemblies and exceptions
Component Description Noted exceptions and configuration selected
Cladding 3-coat stucco; expanded diamond-mesh metal lath (no paper backing) N/A
Sheathing panel Oriented Strand Board (OSB) Client B: 12.5 mm exterior gypsum board Wood framing 38 x 140 mm (2x6) wood stud framing @ 600 mm o.c. Client B: steel stud
Stud cavity
insulation RSI 3.5 (R20) mineral fibre batts Client B: 89 mm Mineral fibre batt Air/Vapour Barrier 6 mil polyethylene Client B : 6 mil polyethylene vapour barrier, not continuous or sealed Building paper
(BP) NBC-compliant BP conforming to CAN-CGSB 51.32 N/A Interior finish 13 mm (1/2 in.) gypsum board N/A
Table 3 – Summary of Reference and Client Wall Assembly Components Assembly
Layer separating cladding from
drainage layer Drainage layer
Sheathing
membrane Venting Strategy*
Reference (R) None Air space created by 19x38 mm wood strapping 1 layer ofBP V at wall base every 3.5 storeys
Client A BP ** SBPO*** sheathing membrane R
Client B R (none) 10 mm air space created by 19 mm wood strapping;
76 mm water repellent insulation board
Fluid applied
air barrier R
Client C BP 10 mm open matrix nylon mesh matting bonded to
PP†nonwoven sheathing membrane R Client D BP Cross woven, micro-perforated polyolefin sheathing membrane with
polyolefin coating R
Client E PP11 mm HDPE‡ dimpled rain screen membrane†fabric (stucco screen) bonded to R Option 1: Option 2: RVTD* top &
base every 2 storeys
Client F R (none) Nominal 25 mm Air space created by 20 ga. Z-ties, R R
Client G Non-woven PP† fabric (stucco screen) /bonder to 10 mm PP†
3-dimensional extruded mono-filament mesh R R
Client H R (none) 52 mm porous PS†† insulation board Fluid applied air barrier R
Client I R (none) 3.8 mm corrugated 2 ply, corrugated asphalt impregnated drainage board (Grade D) § R VTDtop & base
every storey
Client J BP (Grade D)§ Air space created by 9.5 mm (3/8 in.) plywood strapping 2 layers ofBP R
Client K BP (Grade D)§ Air space created by 19 mm (3/4 in.) plywood strapping 2 layers ofBP R R – Reference wall; * V – “Vented”; VTD– “Ventilated”; ** BP – Building paper confirming to CAN-CGSB 51.32; *** SBPO – Spun
bonded polyolefin; † PP – polypropylene; ‡ HDPE – high-density polyethylene; †† PS – polystyrene; § Grade D – Building paper conforming to US Federal specification UU-B-790a, Type 1 (barrier paper), Grade D (water-vapor permeable), Style 2 (uncreped, not reinforced, saturated)
TASK 7 – SUMMARY REPORT OF EXPERIMENTAL AND MODELING TASKS AND RECOMMENDATIONS
REPORT A1-000030.09 8
3.2 Task 2 (Hygrothermal Property Characterization)
To carry out hygrothermal performance assessments of wall assemblies using the numerical simulation tool hygIRC-C, the hygrothermal properties of all materials used for the construction of the different wall assemblies were required as input to the model. Given that a number of the hygrothermal properties of materials of the respective wall assemblies were available in NRC’s material properties database, only the hygrothermal properties and air flow characteristics of materials that were not available were completed as part of this study; these components have been highlighted in Table 3.
A detailed account of the tests methods used to characterise and the resulting values obtained from tests of the hygrothermal properties of wall assembly components and air flow characteristics of the drainage components are given in the Task 2 report (A1-000030.02) [3].
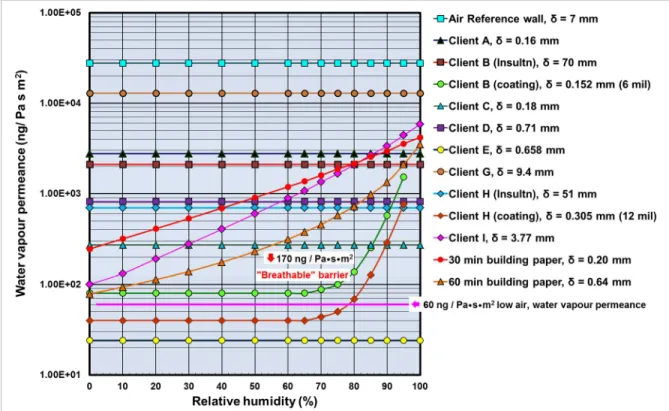
One of the key properties that significantly affects whether there is moisture uptake of wood-based sheathing panels is the protection of those panels with a sheathing membrane. The hygrothermal properties of importance to the control of moisture flow within and across building components are the liquid diffusivity and water vapour permeance (WVP).
Shown in Figure 3 are values for WVP of the sheathing membranes as a function of RH and used in the respective Client drainage systems. Information is also provided for values of WVP for NBC-compliant building paper (30 min.), 60 min. building paper, a less water vapour permeable building paper and, as a reference value to all these products, the limit at which a product is deemed “breathable”, i.e. 170 ng/Pasm2. The value of the WVP of air in the 7 mm cavity of the reference wall is also provided.
Figure 3 – Water vapour permeance of sheathing membranes as a function of RH used in respective Client drainage systems; δ = thickness of membrane or insulation product
PERFORMANCE EVALUATION OF PROPRIETARY DRAINAGE COMPONENTS AND SHEATHING MEMBRANES
The product having the least value of WVP was that of Client E (~24 ng/Pasm2), whereas that having
the greatest value was that of the stucco restraining fabric of Client G (12900 ng/Pasm2).
Non-absorptive products, typically those that are polymer- or glass fibre-based, display constant values for WVP and no or little absorptive capacity if thin sheet materials. Several of these products (7 of 12) are evident in Figure 3. Paper-based products can be recognised by the continuous variation in WVP of the product with RH. Those products that exhibit both constant values and variations in relation to the RH (Client B and H – coating) are polymer-based water vapour barrier products typically used in exterior insulation finish systems.
When interpreting results of hygrothermal simulation for the respective drainage assemblies, it is useful to recall the type of sheathing membrane (SM) used to protect the sheathing panel, and the prevailing RH conditions at the interface between the SM and the exterior face of the panel. This provides an indication of whether moisture loads within the drainage cavity will likely affect the RH conditions (vz. moisture content) on the exterior surface of the sheathing panel, and in turn, alter the performance of the wall assembly.
The test methods used to determine the hygrothermal properties of drainage system components form part of the industry applicable test methods; these industry applicable test methods will form part of the CCMC technical guide.
3.3
Defining Climate Loads on Wall Assembly & Drainage Systems (Task 5)
For this Task there were two primary objectives that included determining the: Climate loads to be used for testing wall assemblies;
Weather data for the hygrothermal simulation task of the project (Task 6).
The information on climate loads for testing wall configurations is summarised in the companion report to Task 6 [3] and detailed information is provided in the Task 5 report on climate loads [3].
3.3.1 Weather data for hygrothermal simulation
This portion of the task required providing the Moisture Design Reference Years (MDRYs) data for the hygrothermal simulation task (Task 6) of the project. After reviewing several published methods for selecting weather years for hygrothermal simulation, and following completion of a comparison study, it was concluded that the MI MEWS method was appropriate to use for this project. Accordingly, rankings were produced for all the years in the climate record for each location selected. Three years, wet
(maximum), average (median), and dry (minimum), were generated and converted to an acceptable format for hygrothermal analysis. Of these sets, hygrothermal simulations for selected locations were undertaken for an average (median), followed by a wet (maximum) year. The locations of interest were:
Tofino (Extreme coastal climate having MI = 3.4).
Vancouver (West coast climate – wet and mild; MI = 1.44), and; St. John’s (East coast climate – wet and cool; MI = 1.47);
TASK 7 – SUMMARY REPORT OF EXPERIMENTAL AND MODELING TASKS AND RECOMMENDATIONS
REPORT A1-000030.09 10
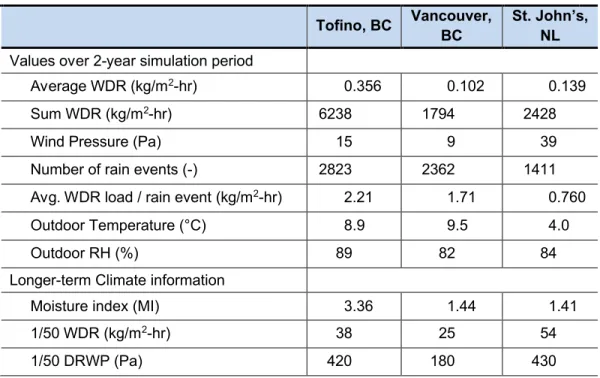
Some climate information for each of these locations is provided in Table 4l values are given of the: average maximum WDR intensity; cumulative total WDR; number of rain events; average WDR load per rain event; wind pressure (Pa); average outdoor temperature (°C) and RH (%). Each of these values is for a 2 year period for which the first year was an average year and the second a “wet” year. In addition, information has been provided on longer-term climate information and includes the moisture index (MI), the 1/50 WDR intensity, and the 1/50 driving-rain wind pressure (DRWP; Pa). This information perhaps permits appreciating the differences amongst the different climate loads for these three locations and to which wall assemblies were subjected in simulations.
It is clearly apparent that Tofino (MI = 3.36) has the most severe climate in respect to WDR loads (6238 kg/m2hr) as the cumulative total WDR is ca. 2.5 and 3.5 times more significant than that of St. John’s
(2428 kg/m2hr) and Vancouver (1794 kg/m2hr), respectively. This is likewise reflected in respect to the
rain events for which Tofino (2833) has twice the number of events as that of St. John’s (1411), although it is the same order of magnitude as Vancouver (2362).
The average values for outdoor relative humidity over a 2-year period (Average year followed by a wet year; RH not consider is temperature < 5°C) are all in the same order of magnitude for the three locations; however, the highest value is found in Tofino (89% RH), thereafter the next highest is St. John’s (84% RH), followed by Vancouver (82% RH). Hence, for any of these coastal locations, the ability of moisture to dissipate from wetted wall assemblies is limited by the capacity of the ambient air to absorb moisture. Evidently, this is more difficult to achieve in climates having higher average relative humidifies. A detailed description of the WDR intensities for the locations studied can be found in the companion Task 6 report [3].
Table 4 – Climate Characteristics of Tofino and
Vancouver, BC and St. John’s, NL over 2-year simulation period
Tofino, BC Vancouver,
BC
St. John’s, NL
Values over 2-year simulation period
Average WDR (kg/m2-hr) 0.356 0.102 0.139
Sum WDR (kg/m2-hr) 6238 1794 2428
Wind Pressure (Pa) 15 9 39 Number of rain events (-) 2823 2362 1411 Avg. WDR load / rain event (kg/m2-hr) 2.21 1.71 0.760
Outdoor Temperature (°C) 8.9 9.5 4.0 Outdoor RH (%) 89 82 84 Longer-term Climate information
Moisture index (MI) 3.36 1.44 1.41 1/50 WDR (kg/m2-hr) 38 25 54
PERFORMANCE EVALUATION OF PROPRIETARY DRAINAGE COMPONENTS AND SHEATHING MEMBRANES
3.4
Response of Wall Assemblies & Drainage Systems to Climate Loads (Task 5)
3.4.1. From climate loads to wind-driven rain loads acting on cladding and wall assembly
The scenario considered in estimating the hygrothermal response of wall assemblies and drainage systems to climate loads takes into account the wind-driven rain (WDR) and driving-rain wind pressure (DRWP) loads acting on the walls.
Detailed descriptions and the governing equations for WDR and DRWP are included in the companion Task 6 report [3].
3.4.2 Water entry behind cladding due to permeation of cladding and deficiencies
At each story, a portion of wind-driven rain (WDR) deposited on the surface of the cladding may enter the drainage system behind the cladding due to water permeation through the cladding itself, or through imperfections at the periphery of the cladding at through-wall penetrations such as at ventilation ducts, pipes or windows.
The experimental procedures and the empirical relationships derived from experiment, as relate to water entry behind cladding, are provided in the companion Task 6 report [3].
3.4.3 Water retention in respective drainage systems
Once water enters the cavity, it may thereafter drain from the cavity or be retained, depending on the size of the cavity and the propensity of the sheathing membrane to promote drainage or retain water. Thus, tests were also carried out to characterise the drainage-retention of each drainage system.
The depth of drainage cavities for all the different wall assemblies was first determined from the fabrication of mock-ups that incorporated the stucco cladding and drainage system of the respective Client wall assemblies and in accordance with the specifications of each of the wall assemblies as provided in Table 3, and the Task 1 Report [3]. The fabrication work was undertaken by professedly knowledgeable and experienced stucco contractors. After curing for 28 days, the specimens were then cut at the centre vertically and horizontally so that the interior gaps could be measured to estimate the cavity depth.
The results provided in Table 5 show the nominal cavity depth, the cavity derived from measurement of the digitized profile of the cavity and the cavity depth used in the numerical simulations and for the fabrication of drainage-retention test specimens. In instances where the measured depth was larger than the nominal depth, the nominal cavity depth was used in the numerical simulations and for the fabrication of drainage-retention test specimens.
Test specimens were then fabricated to determine the drainage-retention characteristics of each drainage system (Table 3). The test specimens of width and height, respectively of 1220 mm by 1830 mm (4ft by 6ft), were dosed with water to the drainage cavity along the entire width of the cavity (i.e. 1220 mm) and at constant rates of 3, 4, 5, 6 and 8L/hour for a duration of one hour. The dosage levels were determined from maximum water entry rates that could occur in selected Canadian locations as provided in the Task 5 Report on climate loads [3]. The quantities of water that drained from the system were monitored gravimetrically during the test, and were subsequently used to determine the retention rate of the drainage system.
TASK 7 – SUMMARY REPORT OF EXPERIMENTAL AND MODELING TASKS AND RECOMMENDATIONS
REPORT A1-000030.09 12
Table 5 – Summary of Results Obtained for Depths of Venting and Drainage Cavities
NRC Client # Nominal Cavity Depth (mm) Cavity Depth Stucco Applied* (mm)
Cavity Depth for Simulation (mm) Benchmark 10 7 7 Client A 2 2 2 Client B 89 75 75 Client C 10.5 16 10.5 Client D 2 2 2 Client E 10.6 15 10.6 Client F 25 25 25 Client G 9.3 12 9.3 Client H 51 51 51 Client I 3.8 8 3.8 Client J 9.5 - 5.5 Client K 19.5 - 15.5 * Distance between sheathing membrane and inboard of stucco cladding
PERFORMANCE EVALUATION OF PROPRIETARY DRAINAGE COMPONENTS AND SHEATHING MEMBRANES
The drainage-retention relation was based on the percentage of water that remained in the cavity for a given water entry rate (mL/h-m2); the drainage-retention curves determined for each of the Client
drainage systems are shown in Figure 4.
The results of the drainage retention tests suggest that for greater amounts of water deposited in the drainage cavity, a smaller proportion (% retained) of that dosage is retained in the cavity as compared to the greater proportion retained for lower dosage rates. Further details can be found in the companion Task 6 report [3].
The test methods developed for characterising the depth of the drainage cavity for a stucco cladding as well as that for characterising the water drainage-retention characteristics of the drainage system both form part of the industry applicable test methods; these industry applicable test methods will form part of the CCMC technical guide.
3.4.4 Moisture loads in drainage cavity at given storey heights
Having determined the water entry rates to the drainage systems on the basis of correlations developed for WDR rain loads acting on the cladding, and having assessed the quantity of moisture that might drain from a cavity given the dosage to the cavity, the moisture load within the cavity was then estimated for each storey level. The moisture load for a given storey arises from the: (i) percentage of WDR that enters from permeation of water through the cladding and through deficiencies, and; (ii) from the water that drains from the storey above as illustrated in Figure 5.
Further details on how the total moisture load for a storey is calculated can be found in the companion Task 6 report [3].
Figure 5 - Moisture loads within drainage cavities at given storey height 3.4.5 Distribution of moisture loads within drainage cavity
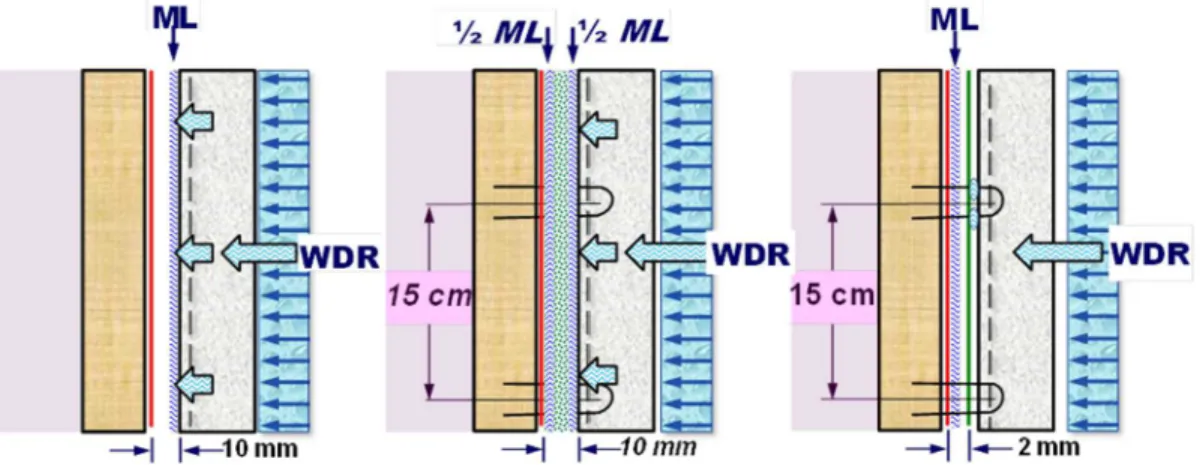
The manner in which moisture loads (ML) within a cavity were distributed depended on the presence of a nominal capillary break, as might be assumed for those drainage systems having cavity depths of at least 10 mm. In these instances, the ML was applied to the backside of the cladding (Figure 6, left-most figure).
TASK 7 – SUMMARY REPORT OF EXPERIMENTAL AND MODELING TASKS AND RECOMMENDATIONS
REPORT A1-000030.09 14
When the drainage cavity included a drainage component of at least 10 mm in depth, for these components, it was assumed that 50 % of the ML remained on the backside of the cladding whereas the remaining 50% found its way to the surface of the sheathing membrane (Figure 6, middle figure). For those drainage components having a depth of less than 5 mm, it was assumed that 100 % of the ML found its way to the surface of the sheathing membrane (Figure 6, right-most figure).
It was surmised that in the case of a clear cavity, the capillary break would prevent any significant ML from reaching the sheathing membrane, whereas in the presence of a drainage component of at least 10 mm in depth (and having interconnecting pathways from front to back), it was reasoned that there was an equal risk that the ML would remain on the backside of the cladding, or migrate to the surface of sheathing membrane over a storey height. For those drainage components having a depth of less than 5 mm, water that permeated the cladding would ultimately find its way to the drainage space at fastener locations and thereafter readily bridged the gap between the sheathing membrane and the drainage component thereby wetting the surface of the sheathing membrane.
Figure 6 – Illustration of moisture load distribution within drainage cavity
4.0 Defining Performance Attributes
The definition of performance attributes of specific components of the wall assembly is described in this section and how the code compliant Reference wall was assessed in relation to the Client wall assemblies incorporating drainage components. Of particular interest are the locations within the wall assembly that were used to assess the performance of wall assemblies.
4.1 Locations of Interest in Assessing Performance of Wall Assemblies
As illustrated in Figure 7, within the wall assembly there are locations that are of interest, given that these may be prone to moisture uptake and given appropriate temperature conditions and an adequate gestation period, that give rise to the risk of formation of mould or, in the case of wood-based components, wood rot fungi. Focus is placed at the sheathing membrane, the sheathing panel (OSB), and the insulation within the stud cavity of the wall. There is heightened risk to the formation of mould (or wood rot in the case of wood-based components) at these locations given their proximity to the sheathing membrane and drainage cavity where the moisture loads have been applied.
PERFORMANCE EVALUATION OF PROPRIETARY DRAINAGE COMPONENTS AND SHEATHING MEMBRANES
Figure 7 – Locations of interest within wall assemblies in assessing relative performance
Accordingly, emphasis has been placed on determining the local temperature and relative humidity conditions, as might be extracted from the information provided from simulating the response of the wall assembly to selected climates, at the following four (4) locations in the wall section and as given in Figure 7:
Interface between the exterior surface of the sheathing panel (OSB or exterior grade gypsum board) and cavity
Exterior portion of sheathing panel of depth 1 mm
10 mm portion of sheathing panel (remaining portion of 11 mm panel)
Interface between the interior surface of the sheathing panel (OSB/ exterior grade gypsum board) and fibrous insulation
Further details on the locations of interest can be found in the companion Task 6 report [3].
4.2 Performance criteria
Two (2) criteria were used to assess the performance of wall assemblies: (i) RHT index, as was used previously in other projects for which the performance of wall assemblies was sought [4], and; (ii) the Mould Index developed by Hukka and Viitanen [5], Viitanen and Ojanen [6] and Ojanen et al. [7]. Each of these criteria is described in turn. Details in respect to calculating the value of both these indices can be found in the companion Task 6 report [3].
5Hukka, A., and Viitanen, H. A. (1999), A mathematical model of mould growth on wooden material, Wood
Science and Technology, Volume 33, Issue 6, pp 475-485
6Viitanen and Ojanen (2007), Improved Model to Predict Mold Growth in Building Materials, Proceedings of the
Buildings X International Conference on the Thermal Performance of the Exterior Envelopes of Whole Buildings (December 2-7), Clearwater Beach, Florida, 8 p.
7Ojanen, T., Viitanen, H.A., Peuhkuri, R, Lähdesmäki, K., Vinha, J., and Salminen, K., "Mold Growth Modeling of
Building Structures Using Sensitivity Classes of Materials", 11thItnl. Conference on Thermal Performance of
TASK 7 – SUMMARY REPORT OF EXPERIMENTAL AND MODELING TASKS AND RECOMMENDATIONS
REPORT A1-000030.09 16
4.2.1 RHT index
The RHT index is a measure of the risk of formation of mould on surfaces or wood rot of wood-based components given the relative humidity and temperature profile over a specified time period over which the index is used. The value of the index is the sum of the product of the relative humidity and
temperature at specfided values of relatrvie humidity (e.g. 80, 92, 95, 97% RH) and for temperatures of at least 5°C. The value of the index increases monotonically and thus represents at the end of the period, the maximum cumulative value of the index.
4.2.2 Mould index
The development of the mould index has been on-going for several years with the most recent work, as was used in this project, having being provided by Ojanen et al. [7].
A description of the mould index levels in terms of growth rate is provided in Table 6, whereas the mould growth sensitivity classes for specified materials and corresponding minimum levels of relative humidity needed for mould growth are provide in Table 7. The mould index levels range in value from 0 to 6, with 0 being equivalent to no growth and 6 indicating 100% coverage of either heavy or tight mould growth. The visual identification of mould growth on surfaces is given an index level value of 3.
As provided in Table 7, the sensitivity of different construction materials to the formation of mould growth was divided into four (4) classes: very sensitive, sensitive, medium resistant and resistant. For this project, the sensitivity class for the sheathing panel (e.g. OSB) was considered “Sensitive”, and are the only values on which the relative performance of the respective wall assemblies was determined. Results for the “Medium Resistant” sensitivity class of materials are not reported in the main body of the reports but have been provided in a separate report of simulation results and companion to the Task 6 report [3] on the Client wall assemblies.
4.2.3 Comparison of RHT index to Mould index
A comparison between the limits of applicability of the RHT index to that of the mould index for the “sensitive” and “very sensitive” class of materials is provided in the companion Task 6 report [3].
Table 6 - Description of Mould Index (M) levels [5, 6, 7]
M Mould Index (M) - Description of Growth Rate
0 No growth
1 Small amounts of mould on surface (microscope), initial stages of local growth
2 Several local mould growth colonies on surface (microscope)
3 Visual findings of mould on surface, < 10% coverage, or < 50% coverage of mould (microscope)
4 Visual findings of mould on surface, 10%–50% coverage, or > 50% coverage of mould (microscope)
5 Plenty of growth on surface, > 50% coverage (visual)
6 Heavy and tight growth, coverage about 100%
Table 7 - Mould growth sensitivity classes and some corresponding materials [7]
Sensitivity Class Materials RHmin(%)*
Very Sensitive Pine sapwood 80
Sensitive Glued wooden boards, PUR with paper surface, spruce 80
Medium Resistant Concrete, aerated and cellular concrete, glass wool, polyester wool 85
Resistant PUR with polished surface 85
PERFORMANCE EVALUATION OF PROPRIETARY DRAINAGE COMPONENTS AND SHEATHING MEMBRANES
5.0
Overview of Hygrothermal Simulation Model, hygIRC-C
The NRC’s hygrothermal model, hygIRC-C was used in this project to predict the hygrothermal performance on the basis of the risk of moisture related effects within wall assemblies having different drainage components when these walls were subjected to different climatic conditions as might occur across Canada. It is important to emphasize that the predictions by such a model for the airflow,
temperature, and moisture (or relative humidity) distributions within a wall assembly, when subjected to a pressure differential (and resulting air leakage rate) across the assembly, are necessary to accurately determine the moisture response in different layers of the wall assembly.
The hygIRC-C model simultaneously solves the highly nonlinear and coupled two-dimensional and three-dimensional Heat, Air and Moisture (HAM) equations for both porous and non-porous media that define values of heat, air and moisture transfer across the various building component layers. The HAM equations were discretized using the Finite Element Method (FEM) as provided in the COMSOL Multi-physics software package that was used as a solver.
A detailed description of the governing equations used in the hygrothermal model, hygIRC-C, can be found in the companion Task 6 report [3].
5.1 Hygrothermal Simulation Model Validation
The hygIRC-C model has been extensively validated in a number of other projects in which the thermal and hygrothermal performance of different systems and components of the building envelope (e.g. roofing, wall and fenestration systems) were evaluated; a review of the different projects in which the model was benchmarked is given in the Task 3 Report [3].
Additionally in this project, two specific benchmarking exercises were conducted to verify whether proper assumptions had been made regarding the mathematical and numerical representation of physical phenomena within the hygIRC-C model and that permitted capturing the hygrothermal response of components within wall assemblies; these included benchmarking the:
1. Moisture dissipation from a nominally saturated stucco plate conforming to NBC-compliant stucco construction details when subjected to ambient laboratory conditions; the results from this work, reported in the Task 3 Report [3], indicated that the model correctly estimated the degree and rate of moisture dissipation over time with a variation in values of moisture content not exceeding ± 5% from that predicted by the simulation model.
2. Air flow through clear cavities and cavities incorporating highly porous media used as drainage components in wall assemblies; the results from these tests are provided in the Task 4 Report [3]. Clear Cavities — A comparison of test results to those derived from simulation showed that the
majority of air velocity measurements were within the margin of uncertainty associated with the results derived from simulation for air velocity profiles obtained of cavities having depths of 10, 20 and 25 mm.
TASK 7 – SUMMARY REPORT OF EXPERIMENTAL AND MODELING TASKS AND RECOMMENDATIONS
REPORT A1-000030.09 18
Non-homogenous highly porous media (drainage components) — The air permeability, , was shown to be pressure dependent and deviations from the test values were minimized provided the value for was selected in relation to the pressure difference acting along the length of the cavity incorporating the drainage media. As such, values for the effective permeability coefficient, and corresponding values for the permeability factor, F, were provided in relation to the pressure difference across the drainage components.
The test method developed for characterising the air permeability of drainage components form part of the industry related test methods required to characterise the performance of a proponent’s drainage system to that of the Referenced wall drainage system.
6.0
Summary of Results Derived from Hygrothermal Simulation
6.1
Results
Details of results from hygrothermal simulation have been presented in the Task 6 reports [3] in which the response of the respective Client walls to climate conditions of Tofino, BC, Vancouver BC, and St. John’s NL have been provided. The results permitted comparisons of the response of the respective Client walls to the Reference wall on the basis of information on value for the mould index and RHT index within discrete portions of the assembly. A summary of the simulation results from each of the client wall assemblies and the Reference wall assembly is provided in Table 8.
For each of the Client wall assemblies described in Table 8, information is given on the Client’s drainage system including the drainage layer, and whether or not a layer was used to separate the cladding from the drainage layer, the cavity depth, sheathing membrane type, venting strategy, and placement of the
moisture load (ML). Such information permits assessing the expected response of wall components to moisture loads within the drainage cavity.
Thereafter, the results from simulation of the Client’s and the Reference wall are provided over a two year period to climate conditions of Tofino, BC, Vancouver, BC, and St. John’s, NL. For each of these
locations, results are provided using the two performance criteria; the: (i) Mould index (MIDX) criterion
(risk to mould growth), and; (ii) Relative humidity-temperature RHT(x) criterion (risk to the growth of wood rot fungi).
The average and maximum values of the mould index (MIDX) obtained from simulations for the 1 mm
“OSB-sliver”, for each of the locations and for each Client wall as well as the reference wall is provided in Table 8; the average value is atop the maximum value. Likewise, the corresponding values for the RHT(x) index, specifically, RHT(92) and when available, RHT(95) are also provided; the value of RHT(92) is atop that of RHT(95). The values provided for the respective Client walls are those that were the lowest attainable for a given solution amongst the different solutions simulated.
The respective values for MIDXand RHT(x) that have been highlighted in Table 8 indicate when these
Table 8 – Summary of Simulation Results of Reference and Respective Client Wall Assemblies
Assembly Layer separating cladding from drainage layer
Drainage layer membraneSheathing “Venting”Strategy Placement of ML*
M
IDX AverageM
IDX MaximumRHT(92) RHT(95) Tofino Van. St. J Tofino Van. St. J
Reference (R) None Air space created by 19x38 mm wood strapping @ 400 mm o.c. 1 layer of BP Vented at base of 3.5 storeys BC 3.94.5 3.54.3 3.14.2 43537 1922 1930
Client A BP SBPO sheathing membrane R SM 4.35.2 3.5 3.54.7 1220490 2246 35846
4.4
Client B R (none) 76 mm water repellent insulation board10 mm air space Fluid applied air barrier R BC 3.54.0 3.23.9 2.83.8 3590 6- 34
-Client C BP Nylon mesh (10 mm; open matrix) bonded to PP nonwoven sheathing membrane R 50% SM 2.53.7 3.11.9 1.72.9 190 0- 0
-Client D BP Cross woven, micro-perforated polyolefin sheathing membrane with polyolefin coating R SM 4.15.3 4.13.0 3.74.9 1532798 720 459148
Client E PP fabric bonded to dimpled HDPE membrane R Option 2: VTLD**Option 1: R 50% SM 1.83.9 1.93.7 0.51.9 6VLTD0 40V 0VLTD0
Client F R (none) 25 mm Air space. R R BC 3.84.2 4.03.4 2.84.0 6160 167- 120
-Client G Non-woven PP fabric (stucco screen) / PP mat (10 mm; 3-dimensional extruded PP mono-filament mesh) R R 50% SM 4.04.8 3.2 2.9 50199 90VTLD0 420
4.1 4.1
Client H R (none) Porous PS insulation board (52 mm) Fluid applied R BC 2.54.1 2.91.3 1.12.7 3000 5270 0
-Client I R (none) 2-ply (3.8 mm) corrugated asphalt impregnated paper (Grade D) R VTLD top & bottom every storey SM 5.04.0 3.2 3.1 743227 930 1971 4.1 4.3
Client J BP 9.5 mm (3/8 in.) Air space. 2 layers ofBP R BC 2.23.2 1.93.0 1.02.4 00 0- 0
-Client K BP 19 mm (3/4 in.) Air space 2 layers ofBP R BC 3.44.1 3.14.0 2.83.9 2900 102- 70
-*ML: Moisture Load; BC: Behind Cladding; BP: Building paper conforming to CAN-CGSB 51.32; R – Same as Reference wall assembly; SM: Sheathing membrane; **VTLD - Ventilated top & bottom every 2 storeys
TASK 7 – SUMMARY REPORT OF EXPERIMENTAL AND MODELING TASKS AND RECOMMENDATIONS
REPORT A1-000030.09 20
6.2
Discussion of Results
The discussion of results as provided in Table 8 will primarily focus on those wall assemblies for which values of MIDXand RHT(x) exceeded that of the Reference wall (highlighted portions) or for which an
alternative to the proposed solution was sought to permit attaining the performance requirements of the Reference wall assembly for a given location. The remaining assemblies will not be considered.
Client Wall assemblies not performing as well as Reference wall
There were four (4) wall assemblies (A, D, G and I) that did not provide adequate hygrothermal
performance compared to the Reference wall for at least some of the locations for which simulations were completed; each of these is considered in turn.
Client A wall drainage system —For all of the locations for which simulations were completed the maximum values for MIDXand those for RHT(95) and RHT(92) exceeded that of the Reference wall and
the average values for MIDXwere equal to that of the Reference wall for the Vancouver location and
greater than the Reference wall for the locations of Tofino (BC) and St John’s (NL).
The drainage system is comprised of a SBPO sheathing membrane and building paper with a small gap between each layer of ca. 2 mm; the “venting” strategy is the same as the reference wall, i.e., “vented” at the base of a 3.5 storey wall. The sheathing membrane has a WVP of 2760 ng/Pasm2which is, amongst
the different products evaluated in this project, comparatively permeable to water vapour and ca. 1.5 orders of magnitude greater than a “permeable” membrane (i.e. 170 ng/Pasm2). The drainage system
incorporates, professedly, a “drainable membrane, and the drainage–retention characteristic of this product is superior to any other product or that of the Reference wall drainage system given that it retains the least amount of water in relation to amount of water dosed to the system.
For this system, the moisture load was placed on the sheathing membrane given that there was no clear capillary break in this system (i.e. at least 5 mm), but only a small gap (ca. 2 mm) between the adjacent membranes forming the drainage system.
Considering that the hygrothermal performance is governed by the degree to which water vapour can migrate across the sheathing membrane, and given as well that the moisture load was placed on the sheathing membrane, and allowing for the WVP of the membrane, the drainage system was nonetheless unable to provide a level of performance that was equal to or exceeded that of the Reference wall. Other solutions could have been suggested.
However, allowing that the gap between the SBPO sheathing membrane and building paper was only 2 mm, the possibility that an alternative “venting” strategy, that is “ventilation” as opposed to “vented”, be used to improve the hygrothermal performance was not deemed likely since in such a gap little air can circulate, and thus permit drying of the cavity.
An additional building paper could have been used to supplement that of the SBPO sheathing membrane; however, this solution was not simulated as it was considered unlikely that it would nonetheless provide adequate protection to the sheathing panel; alternative solutions could nevertheless be explored.
PERFORMANCE EVALUATION OF PROPRIETARY DRAINAGE COMPONENTS AND SHEATHING MEMBRANES
Client D wall drainage system —The average and maximum values for MIDXand those for RHT(95) and
RHT(92) derived from simulations exceeded that of the Reference wall for the locations of Tofino (BC) and St John’s (NL) and for the Vancouver (BC) location the respective values were less than the Reference wall.
The drainage system is comprised of a cross-woven, micro-perforated polyolefin sheathing membrane with polyolefin coating and building paper with a small gap between each layer of ca. 2 mm; the
“venting” strategy is the same as the reference wall, i.e., “vented” at the base of the 3.5 storey wall. The sheathing membrane has a WVP of 817 ng/Pasm2which is, amongst the different products evaluated in
this project, comparatively permeable to water vapour and ca. 5 times greater than a “permeable” membrane (i.e. 170 ng/Pasm2). The drainage–retention characteristics of this drainage system, and
incorporating this product, did not perform as well as the Reference wall drainage system given that it retained a greater amount of water as compared to the Reference wall drainage system (4thleast
performing of 9 products).
For this system the moisture load was placed on the sheathing membrane given that there was no clear capillary break in this system (i.e. at least 5 mm), but only a small gap (ca. 2 mm) between the adjacent membranes forming the drainage system. Given that the hygrothermal performance is governed by the degree to which water vapour can migrate across the sheathing membrane, and given as well that the moisture load was placed on the sheathing membrane, and allowing for the WVP of the membrane, the drainage system was unable to provide a level of performance that was equal to or exceeded that of the Reference wall assembly for the locations of Tofino (BC) and St John’s (NL).
For the Vancouver (BC) location, although the solution offered provided adequate protection compared to the Reference wall, local solutions, as provided by the Home Protection Office of BC, may provide more stringent hygrothermal performance requirements compared to that provided by the Reference wall and ought to be taken into consideration.
For the locations of Tofino (BC) and St John’s (NL), other solutions could have been suggested. However, considering that the gap between the cross-woven, micro-perforated sheathing membrane and building paper was only 2 mm, as was the case for the Client A drainage system, the possibility that an alternative “venting” strategy, that is “ventilation” as opposed to “vented”, be used to improve the hygrothermal performance was not deemed likely since in such a gap little or no air can circulate and thus permit drying of the cavity. An additional building paper could have been used to supplement that of the cross-woven, micro-perforated sheathing membrane; however, this solution, as was the case for the Client A drainage system, was not simulated as it was considered unlikely that it would nonetheless provide adequate protection to the sheathing panel; alternative solutions could nevertheless be explored.
Client G wall drainage system —The average and maximum values for MIDXand those for RHT(95) and
RHT(92) derived from simulations exceeded that of the Reference wall for the location of Tofino (BC) whereas for the St John’s (NL) and Vancouver (BC) locations, the respective values for MIDXand RHT(x)
were less than the Reference wall.
The drainage system is comprised of a 10 mm deep, 3-dimensional extruded PP mono-filament mesh and building paper (BP) as sheathing membrane and a highly permeable (WVP = 12900 ng/Pasm2) PP fabric