Actin kinetics shapes cortical network structure and mechanics
The MIT Faculty has made this article openly available.
Please share
how this access benefits you. Your story matters.
Citation
Fritzsche, M. et al. "Actin kinetics shapes cortical network structure
and mechanics." Science Advances 2, 4 (April 2016): e1501337
© 2017 The Authors, some rights reserved; exclusive licensee
American Association for the Advancement of Science
As Published
http://dx.doi.org/10.1126/sciadv.1501337
Publisher
American Association for the Advancement of Science (AAAS)
Version
Final published version
Citable link
http://hdl.handle.net/1721.1/113687
Terms of Use
Creative Commons Attribution 4.0 International License
C E L L B I O L O G Y 2016 © The Authors, some rights reserved; exclusive licensee American Association for the Advancement of Science. Distributed under a Creative Commons Attribution License 4.0 (CC BY). 10.1126/ sciadv.1501337
Actin kinetics shapes cortical network structure
and mechanics
Marco Fritzsche,1* Christoph Erlenkämper,2,3Emad Moeendarbary,4,5Guillaume Charras,6* Karsten Kruse2*
The actin cortex of animal cells is the main determinant of cellular mechanics. The continuous turnover of cortical actin filaments enables cells to quickly respond to stimuli. Recent work has shown that most of the cortical actin is generated by only two actin nucleators, the Arp2/3 complex and the formin Diaph1. However, our understanding of their interplay, their kinetics, and the length distribution of the filaments that they nucleate within living cells is poor. Such knowledge is necessary for a thorough comprehension of cellular processes and cell mechanics from basic polymer physics principles. We determined cortical assembly rates in living cells by using single-molecule fluorescence imaging in combination with stochastic simulations. We find that formin-nucleated filaments are, on average, 10 times longer than Arp2/3-nucleated filaments. Although formin-generated filaments represent less than 10% of all actin filaments, mechanical measurements indicate that they are important determinants of cortical elasticity. Tuning the activity of actin nucleators to alter filament length distribution may thus be a mechanism allowing cells to adjust their macroscopic mechanical properties to their physiological needs.
INTRODUCTION
The skeleton of animal cells is composed of polymers that continuously undergo turnover of their proteic components (1–4). This holds nota-bly for actin-based structures such as the cortex of animal cells, a sub-membranous shell that is the main determinant of cell shape and endows cells with their mechanical properties (5, 6). The cortex is a roughly isotropic polymeric network of semiflexible actin filaments [filamentous actin (F-actin)] cross-linked by specialized actin-binding proteins and containing motor proteins that generate stress within the network. The continuous turnover of cortical actin filaments enables animal cells to quickly respond to external stimuli and readily adapt to mechanical cues or biochemical signaling. In consequence, the cortex plays a central role in many biological processes such as cell division (7–9), motility (1, 3, 4), and tissue morphogenesis (5).
Despite its importance, our understanding of cortical organization and mechanical properties from the bottom-up is poor. In particular, the role of actin turnover kinetics for determining cortical network characteristics remains unclear. This is in part due to difficulties in deriving reaction constants for the turnover of individual actin fila-ments from fluorescence measurefila-ments on filament populations in living cells. Consequently, the relationship between actin turnover and cortex mechanics is largely unclear.
The major determinants of cortical mechanics are the density and lengths of the actin filaments, as well as the nature and density of the proteins cross-linking them (1–6, 8, 10–14). Direct measurement of the filament length distribution by fluorescence or electron tomogra-phy is currently impossible due to limited resolution and artifacts in-troduced by sample preparation, respectively. An alternative approach
is to measure the kinetics of the biochemical turnover processes that control cortical actin filament density and length. However, whereas a large body of work on actin turnover exists in vitro (15–17), little is currently known about F-actin turnover kinetics in living cells. To add further complication, two filament subpopulations with effective turnover rates differing by a factor of ~20 have been shown to constitute the cortex (1, 3, 4, 18). These subpopulations are generated by distinct nucleation pathways, necessitating either formins or the Arp2/3 com-plex. Recent work has confirmed that these nucleators alone generate most of the cortical actin (19). Although in vitro experiments indicate that these two nucleator types have very different kinetics of polymer elongation (15, 17), our understanding of how these kinetics lead to distinct filament turnover times in vivo remains rudimentary. Conse-quently, the derivation of cortical mechanical properties, cortex thick-ness, and cortical actin filament length distribution from polymer physics theories is currently not possible (20–22).
One common method for quantifying actin turnover kinetics in living cells is the use of fluorescence recovery after photobleaching (FRAP) experiments (23), in which a micrometer-sized region is ex-posed to high laser power and the recovery of fluorescence intensity is monitored over time (24, 25). Actin filaments can only gain and lose monomers from their two extremities, respectively referred to as the barbed and pointed ends. The exchange of individual monomers in the cortex thus depends on a monomer’s position in a filament, and the interpretation of coarse-grained measurements in terms of molec-ular reaction rate constants is challenging. Moreover, filaments can be severed, which does not lead to changes in the fluorescence, but in-creases the difficulty of interpreting the fluorescence data even further. Here, we used single-molecule fluorescence imaging and stochastic simulations to quantitatively characterize the molecular processes underlying cortical actin filament network assembly in vivo. From these data, we derived the average lengths of formin- and Arp2/3-nucleated cortical filaments. We found that less than 10% of the filaments, containing 20 to 25% of actin protomers incorporated in filaments, were nucleated by formins. Surprisingly, mechanical mea-surements showed that formin-generated filaments were the main 1MRC Human Immunology Unit, Weatherall Institute for Molecular Medicine, University of
Oxford, Oxford OX3 9DS, UK.2Theoretische Physik, Universität des Saarlandes, 66041 Saarbrücken, Germany.3Institut Curie, 26 Rue d’Ulm, 75248 Paris Cedex 05, France.4
Depart-ment of Biological Engineering, Massachusetts Institute of Technology, Cambridge, MA 02142, USA.5Department of Mechanical Engineering, University College London, London WC1E 7JE, UK.6London Centre for Nanotechnology, Institute for the Physics of Living Systems, and Department of Cell and Developmental Biology, University College London, London WC1H 0AH, UK.
*Corresponding author. E-mail: [email protected] (M.F.); k.kruse@physik. uni-saarland.de (K.K.); [email protected] (G.C.)
R E S E A R C H A R T I C L E
on February 9, 2018
http://advances.sciencemag.org/
determinant of actin-based cortical elasticity. Our computer simula-tions showed that cells could control the length of cortical actin fila-ments independently of their turnover kinetics. Because filament length distribution likely affects cortical mechanics, this suggests that cells can respond to external stimuli by adapting their mechanical properties without affecting their response time.
RESULTS
To quantify cortical actin assembly kinetics, we used a combination of experiments and stochastic simulations. We first used fluorescence single-molecule (FSM) microscopy (26, 27) on formins and actin monomers. From the measured displacements and lifetimes, we inferred the values of molecular assembly and disassembly rates through fitting of analytical functions describing single-molecule ki-netics and by comparison to stochastic simulations of single filaments. Finally, we used data from FRAP experiments in combination with stochastic simulations of a finite part of the cell cortex to determine relative protein abundances.
Formin kinetics assessed by FSM
We started by characterizing the filament elongation kinetics of the formin Diaph1 in steady-state cortices of cervical cancer HeLa cells and in blebbing melanoma M2 cells. In the latter case, we only considered cortical regions outside of blebs. We chose these two cell lines because they are from very different origins and the proteic composition and ultrastructural organization of their cortices are well characterized (19, 28, 29). Recent work has, in particular, shown that in these cells, actin filaments of the submembranous cortex are nu-cleated primarily by the Arp2/3 complex and the formin Diaph1 (19). After being activated at the membrane, formins nucleate actin fila-ments and remain attached to their barbed ends, where they assist subsequent elongation (17, 30, 31). When imaged with single-molecule techniques, individual formins bound to growing barbed ends can be tracked (30). In contrast, proteins not bound to an actin filament dif-fuse so fast that they cannot be tracked and only contribute to back-ground fluorescence (26). We used high–numerical aperture (NA) spinning disc confocal imaging to follow single molecules in an equa-torial focal plane midway through the cell, where the cortical actin network is approximately isotropic and perpendicular to the plane of focus (fig. S1, A to C, and sections SI and SIIB). Alternative methods, such as total internal reflection fluorescence microscopy, are limited to the basal plane, where cells form stress fibers and focal adhesion in addi-tion to cortex, making data analysis very challenging (fig. S1C). When we expressed Diaph1-GFP (green fluorescent protein) at low levels using truncated cytomegalovirus (CMV) promoters (26) and imaged cells, we could observe individual fluorescent particles moving in the plane of the cortex over several hundreds of nanometers (Fig. 1A and movies S1 to S3).
First, we ascertained that these represented single fluorescent mo-lecules by verifying that they photobleached in a single step (fig. S2A). To increase the number of observable single molecules per cell, we absolved ourselves from the biochemical processes of formin activa-tion by expressing a constitutively active Diaph1 (CA-Diaph1-GFP) (Fig. 1A). In contrast to Diaph1, CA-Diaph1 molecules are active without binding RhoA (32). We recorded the fluorescence intensity along the cortical layer and tracked the positions of local maxima over
time (Fig. 1B), restricting our analysis to molecules that appeared and disappeared during our observation. The distribution of CA-Diaph1-GFP lifetimes was exponential, with a detachment rate woff,F= 0.12 ± 0.1 s−1[Table 1 and fig. S3A, consistent with the studies by Kovar et al. (17) and Romero et al. (33)]. The lifetime distribution of full-length Diaph1 was not significantly different, with a detachment rate woff,F= 0.12 ± 0.1 s−1(P = 0.9), indicating that CA-Diaph1-GFP protein dy-namics were representative of active cortex-associated Diaph1-GFP (fig. S3B).
Because of constitutive activation, we expected that all traceable CA-Diaph1-GFP molecules should represent proteins engaged in fil-ament elongation. However, overall, only 75% of molecules moved di-rectionally along the cortical layer (Fig. 1, B and B2), whereas the rest appeared immobile (Fig. 1, B and 1B1). To understand the origin of this immobile fraction, let us first note that our setup recorded pro-jections into the focal plane of the molecule displacements (Fig. 1C). Whenever the recorded travel distances were smaller than our spatial resolution (pixel size, 133 nm), the particle appeared immobile (Fig. 1C). For an isotropic cortex, geometric and kinematic considerations show that 20 to 30% of molecules should appear immobile in our setup (section SIIB and fig. S5), matching the observed fraction of immobile molecules. We conclude that all observed molecules were moving but, because of the projection of trajectories into the focal plane, a portion appeared immobile. Note that fluorescent molecules can leave the focal volume, and this introduces an error of less than 5% (Supplementary Materials).
We then sought to infer the rate of formin-mediated filament elon-gation from the trajectories of single molecules. The displacements could result from the filament elongation activity of CA-Diaph1-GFP (30), the activity of molecular motors inducing cortical flows (34), thermal noise (27), or a combination of these. To collectively quantify the contributions from processes other than CA-Diaph1-GFP–induced polymerization, we incubated cells with the formin inhibitor SMIFH2 that prevents monomer addition to formin-capped filaments (35). SMIFH2 almost completely suppressed CA-Diaph1-GFP motility (Fig. 1E, inset, gray line). In contrast, inhibition of myosin II motor proteins by treatment with the Rho-kinase inhibitor Y27632 showed no visible impact on Diaph1 motility compared to control cells (Fig. 1E, inset, blue line). If thermal noise contributed significantly to the observed move-ment of Diaph1 molecules, the superposition of the distributions obtained from the SMIFH2 and Y27632 data should contain the con-tribution of thermal noise to both discon-tributions. This can be done by a convolution of the respective experimental distributions (section SIIC). There is no significant deviation of the measured distribution under control conditions from the convolution of distributions in the pres-ence of SMIFH2 and Y27632, respectively (Fig. 1E). We concluded that Diaph1 movement was mainly due to formin-mediated polymerization alone (Fig. 1E and section SIIC).
The recorded displacements did not appear to have a preferred direction of motion, confirming isotropy of filament orientation in the cortical plane. Furthermore, trajectories were straight, consistent with electron micrographs (Fig. 1D) (36). For a constant filament elongation rate and exponentially distributed binding times, the distribution of displacements should be exponential. Indeed, the distribution of projected displacements inferred from an exponential distribution of displacements in 3D for an isotropic cortex accurately fits the mea-sured distribution (Fig. 1E and eq. S14). From the fit, we obtained that, in HeLa cells, CA-Diaph1-GFP molecules polymerized, on average,
on February 9, 2018
http://advances.sciencemag.org/
the equivalent of a 3900-nm-long filament before detaching (M2 cells: 2500 nm).
Knowledge of the distribution of polymerized lengths, together with the formin detachment rate woff,F, allowed computation of the rate kon,F of formin-assisted subunit addition to barbed ends (eq. S13). To this end, we calculated the distribution of travel distances expected for
constant rates woff,Fand kon,F, and then fitted the resulting expression to the experimental distribution using kon,Fas a free parameter (Fig. 1E, black lines and circles). This yielded kon,F= 136 subunits per second (sub/s) for HeLa cells and kon,F= 102 sub/s for M2 cells (Fig. 1E), com-parable to values measured in vitro (17, 32). As an independent con-trol, we also determined kon,Fdirectly from the distribution of the
Fig. 1. Dynamics of formin molecules in the cell cortex. (A) Individual CA-Diaph1-GFP molecules appear as dot-like structures in the cortex of HeLa and M2 cells. Individual molecules are indicated by arrows. Scale bar, 10 mm; scale bars in zooms, 2 mm. SM, single molecule. (B) Top: Cortical section with CA-Diaph1-GFP. Scale bar, 1 mm. Middle: Kymograph of the section’s fluorescence intensity. a.u., arbitrary unit. (B1 and B2) The section contains seemingly mobile molecules (B1) and immobile molecules (B2). Bottom: Trajectories of CA-Diaph1 molecules. (C) Schematic illustrating the effects of projection of the three-dimensional (3D) molecule trajectories onto the 2D plane of observation. (D) Scanning electron micrograph of the actin cortex of a HeLa cell. Actin filaments appear to be isotropically distributed. (E) Distributions of projected travel distances of CA-Diaph1-GFP in HeLa cells obtained from measurements of 3000 molecules (triangles) and from deconvolving the raw distribution, with the distributions obtained after formin inhibition and Rho-kinase inhibition, respectively (circles, Supplementary Materials). The red line is a fit of travel distances obtained from theoretical analysis of actin assembly and disassembly, projected into the focal plane. We determined woff,F= 0.12 s−1. Inset: Inferred distribution of
filament lengths polymerized by individual formins in HeLa cells. The average length added by single formins is 3900 nm (M2 cells: 2500 nm).
R E S E A R C H A R T I C L E
on February 9, 2018
http://advances.sciencemag.org/
molecule velocities with the caveat that the data are much more noisy, and obtained kon,F= 140 sub/s (M2 cells: kon,F= 100 sub/s), consistent with the previous values.
Growth kinetics of Arp2/3-nucleated filaments by FSM of actin monomers
Next, we sought to quantify the growth kinetics of filaments due to monomer addition at free barbed ends to estimate the length of fila-ments nucleated by Arp2/3. This information cannot be obtained from tracking Arp2/3 complexes because they nucleate actin filaments at their pointed end, where they block monomer removal. Instead, we measured the lifetime and trajectories of single actin-GFP molecules, reporting on individual actin monomers within filaments (Fig. 2 and section SIB). Their large number led to a higher background signal than in the case of formins (Fig. 2A), but we were still able to track individual molecules. In contrast to the tracks of single formins, the trajectories of single actin protomers do not contain information about actin filament assembly, and thus, we did not analyze their distribution. However, consistent with what we found for formin-nucleated filaments, we found that myosin contractility did not appear to participate in protomer motion (fig. S6B). In contrast to CA-Diaph1-GFP (fig. S3, A and B), the distribution of actin-CA-Diaph1-GFP molecule lifetimes presented two distinct characteristic time scales, indicative of the two subpopulations of actin filaments previously reported to coexist in the cortex (Fig. 2B, inset) (18). Consistent with this, one of these subpopu-lations disappeared upon treatment with SMIFH2, indicating that they were nucleated by Diaph1 (Fig. 2C), whereas the other disappeared upon inhibition of the Arp2/3 complex with CK666 (Fig. 2D) (37, 38), con-sistent with the studies by Fritzsche et al. (18) and Bovellan et al. (19). The growth kinetics at free barbed ends cannot be directly inferred from the actin lifetime distributions. However, we can infer these rates by making assumptions about the underlying molecular mechanisms, and fit the corresponding predicted lifetime distributions to the data. To this end, we used mean-field theories and stochastic simulations of single filaments (section SIII). Because the molecular processes of de-polymerization, and in particular the relative importance of end-depolymerization and severing, have yet to be characterized in detail in vitro and in vivo (39–43), we decided to describe actin filament disassembly by using an effective disassembly rate koffthat com-prises the effects of all depolymerization mechanisms, including end-depolymerization and severing.
Explicitly, we considered growth at the barbed end and shrinkage at the pointed end. Barbed ends grow at a rate kon,Fif formin is bound and at rate kon,0otherwise. Filaments shrink at rate koffunless capped by an Arp2/3 complex (Fig. 2E). Formin detaches from filaments at a rate woff,Fand Arp2/3 at a rate woff,A. We will see below that this implies
that filaments grow on average as long as the nucleator is bound and shrink after it has been released.
At this point, three unknown parameters remain: koff, kon,0, and
woff,A. First, we determined the Arp2/3 release rate woff,Afrom the
distribution of actin lifetimes in cells treated with SMIFH2. In this case, only one characteristic time scale remained that equals 1/woff,A(Fig. 2C and section SIIIA). Similarly, after treatment with CK666, only one sub-population remained, allowing us to obtain koff(Fig. 2D, section SIIIB). The remaining unknown parameter kon,0can be determined by fitting the initial peak of the lifetime distribution in the presence of SMIFH2 (Fig. 2C). To this end, we performed stochastic simulations of single filaments (Materials and Methods and section SIIIC) to re-produce the peak value of experimental curves. Single-filament simu-lations using this value of kon,0yield lifetime distributions consistent with those measured in the presence of CK666 and under control conditions (Fig. 2, B and D). Explicitly, our simulation predicted kon,0= 28 sub/s (M2: kon,0= 21 sub/s), koff= 29 sub/s (M2: koff= 23 sub/s), and woff,A= 0.23 s−1(Μ2: woff,A = 1.1 s−1). These values are comparable to results from in vitro experiments (Table 1). Knowl-edge of the formin- and Arp2/3-mediated nucleation rates is not needed for obtaining the kinetic parameters because these rates affect filament abundance rather than turnover time scales.
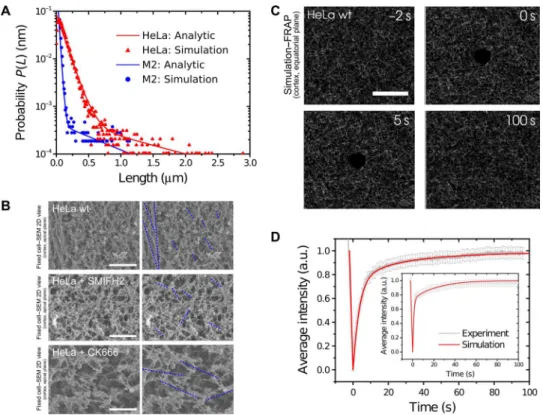
The actin turnover processes considered above imply an expo-nential distribution for the length of formin- and Arp2/3-nucleated filaments. Having obtained a full parametrization of actin turnover processes, we can use the simulations to calculate the average filament lengths. In HeLa cells, we calculated that formin-nucleated filaments had an average length of 1200 nm, whereas the average length of Arp2/3-nucleated filaments was 120 nm (M2 cells: 60 and 600 nm; Fig. 3A, full lines). The latter was consistent with results from elec-tron tomography (44) and numerical simulations of the lamellipo-dium (45), as well as with theoretical predictions based on the movement of single proteins at the cell surface (34, 45). We found overall shorter lengths in the blebbing melanoma cells that have a less stable cortex (Table 2). In our experiments, in both cell types, we found that 20 to 25% of the total protomers in F-actin (18) were incorporated in filaments nucleated by formins and the remainder in filaments nucleated by Arp2/3 (Table 2). As a consequence, shorter filaments are more abundant than longer ones. Consistent with this finding, scanning electron micrographs of the cortex of wild-type HeLa cells show the presence of both long and short filaments, with the former being visibly less abundant (Fig. 3B). Treatment with the formin inhibitor SMIFH2 appeared to lead to a decrease in long filaments, and treatment with CK666 appeared to lead to a decrease in short fila-ments (Fig. 3B), consistent with the studies by Bovellan et al. (19) and Eghiaian et al. (46).
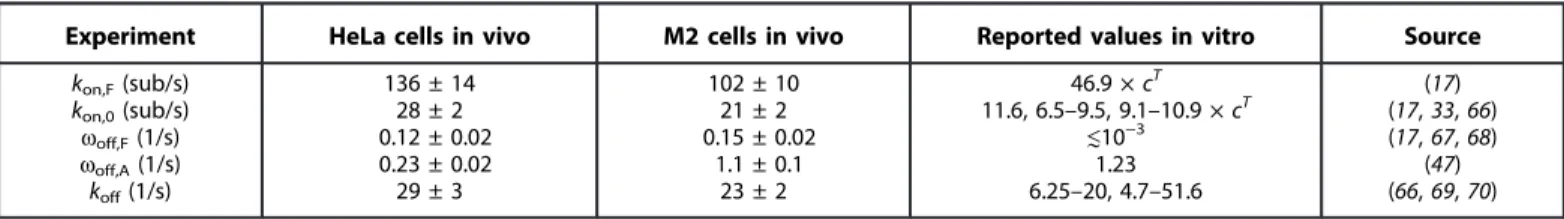
Table 1. Summary of parameters of filament growth kinetics inferred from FSM experiments and single-molecule simulations compared with values in vitro from the literature for CA-Diaph1 and actin molecules. In the fourth column, cTis the concentration of ATP-actin.
Experiment HeLa cells in vivo M2 cells in vivo Reported values in vitro Source
kon,F(sub/s) kon,0(sub/s) woff,F(1/s) woff,A(1/s) koff(1/s) 136 ± 14 28 ± 2 0.12 ± 0.02 0.23 ± 0.02 29 ± 3 102 ± 10 21 ± 2 0.15 ± 0.02 1.1 ± 0.1 23 ± 2 46.9 × cT 11.6, 6.5–9.5, 9.1–10.9 × cT ≲10−3 1.23 6.25–20, 4.7–51.6 (17) (17, 33, 66) (17, 67, 68) (47) (66, 69, 70) on February 9, 2018 http://advances.sciencemag.org/ Downloaded from
Stochastic simulations of the homeostatic actin cortex Our quantitative analysis of molecular cortical actin turnover revealed clear differences in the kinetics of turnover of filaments nucleated by formins and by Arp2/3. Previously, FRAP experiments on cortical actin turnover had suggested the existence of two kinetically distinct filament subpopulations representing relative fractions f1and f2of the total num-ber of actin protomers bound in filaments whose fluorescence recovered with the rates wd,1and wd,2(18). Thus, we wanted to check whether the processes considered above can reproduce these FRAP experiments.
We set up stochastic simulations of cortical actin turnover in a finite volume that comprised the processes described above, as well as actin nucleation by Diaph1 and the Arp2/3 complex at molecular rates nF and nA, respectively (Materials and Methods). The finite cortex
simu-lations also consider explicitly the concentration cactof free globular actin (G-actin), the concentration of Diaph1 cform, and the concentra-tion of Arp2/3 complexes carp, such that we have a closed description of cortical actin turnover. The total rate of actin assembly is then a function of the molecular rates determined above, as well as the G-actin concentration and the concentration of free barbed ends (Materials and Methods). The simulations thus contain three new a priori un-known parameters: nAcarp, nFcform, and cact.
From the FRAP experiments, we obtained three quantities that we could compare with the simulation results: the fraction of Arp2/3- to formin-generated filaments (f1/f2) and the rates of fluorescence recovery of the two subpopulations (wd,1and wd,2), which were determined by fitting a weighted sum of two exponentials to the FRAP data (18). We
Fig. 2. Dynamics of actin-GFP molecules in the cell cortex. (A) Individual actin-GFP molecules appear as dot-like structures in the cortex of HeLa and M2 cells. Arrows indicate individual molecules. (B to E) Distribution of actin-GFP molecule lifetimes in wild-type (wt) HeLa cells (B), after application of the formin inhibitor SMIFH2 (C), and after application of the Arp2/3 inhibitor CK666 (D). Circles, experimental values; triangles, values from single-filament simulation of the processes illustrated in (E). Red lines give an analytical approximation of the latter. Parameter values are woff,A= 0.23 s−1, koff= 29 sub s−1,
and kon,0= 28 sub s−1. Insets give a log-linear presentation of the data. (C and D) Insets: Data from untreated cells are given in gray for comparison. (E)
Illustration of the molecular processes accounted for in the quantitative analysis of actin molecule dynamics. This included free and formin-mediated, barbed-end elongation at rates kon,0and kon,F, release of an elongation factor from the barbed end at rate woff,F, release of a capping factor from the
pointed end at rate woff,A, and filament pointed-end disassembly at rate koff. These processes capture the dynamics of filaments with free barbed ends, as
well as the effects of formin-mediated elongation, Arp2/3-complex capping, and of factors involved in filament disassembly.
R E S E A R C H A R T I C L E
on February 9, 2018
http://advances.sciencemag.org/
found that the finite cortex simulations of a FRAP experiment, where a circular region of 1-mm radius was bleached within a total area of 26.6 × 26.6 mm2(Fig. 3C and movie S4), reproduced the functional form of fluorescence recovery obtained from the experiments (Fig. 3D). The fits of the simulation data to the experimental curves yielded cact= 3 ± 0.01 mM, carp= 24 ± 4 nM, and cform= 0.2 ± 0.04 nM (M2: cact= 2.5 ± 0.01 mM, carp= 24 ± 4 nM, cform= 0.17 ± 0.04 nM) (table S1). These values are consistent with in vitro experiments (47, 48).
The finite cortex simulations also allow computation of the fila-ment length distribution of both subpopulations. These agree well with the distributions inferred above (Fig. 3A, triangles and circles) and show that our analysis of actin turnover is inherently consistent. We then used the simulations to study the effects of parameter changes on the homeostatic cortex (Fig. 4), where we focused on param-eters that cells are known to control. Most G-actin in cells is sequestered by proteins such as thymosin-b4; as a consequence, cells can rapidly mobilize a large pool of G-actin by releasing sequestration. An in-crease of the total actin concentration led to a lengthening of the filaments of both populations (Fig. 4A), consistent with experimen-tal results obtained for formins in cells (49). Remarkably, though, the
Fig. 3. Actin filament length distribution in the cell cortex. (A) Inferred filament length distributions for HeLa (red) and M2 cells (blue). Symbols, finite cortex simulations; lines, analytical approximations (Supplementary Materials). In HeLa cells, formin-nucleated filaments had an average length of 1200 nm (M2: 600 nm), whereas the average length of Arp2/3-nucleated filaments was 120 nm (M2: 60 nm). Parameter values are ron= 9 s−1mM−1, ron,F= 45 s−1mM−1,
koff= 28 s−1, woff,F= 0.12 s−1, woff,A= 0.3 s−1, ctot= 80 mM, cform= 0.2 nM, and carp= 24 nM. (B) Scanning electron micrographs of the actin cortex of
control HeLa cells (top), cells treated with the formin inhibitor SMIFH2 (middle), and cells treated with the Arp2/3 inhibitor CK666 (bottom), with (right) and without (left) dashed lines indicating complete actin filaments. In control cells, areas of long and highly oriented filaments were clearly visible. These could not be seen in SMIFH2-treated cells. In contrast, in CK666-treated cells, long and highly oriented filaments were visible but short ones were not. Scale bar, 500 nm. (C) Snapshots of stochastic simulations of actin cortex turnover. Scale bar, 10 mm. (D) Experimental FRAP curve for HeLa cells (main panel) and M2 cells (inset) averaged over 28 experiments. Red curves, simulation results; see the Supplementary Materials for parameter values. Experimental data points are indicated in gray. Bars, SDs.
Table 2. Summary of FRAP and molecule fitting parameters in vivo in comparison with the finite cortex simulation results in silico in HeLa and M2 cells. The finite cortex simulations reproduce well the FRAP data in vivo based on the measured molecule growth kinetics. f1and f2denote the
relative abundances of Arp2/3- and formin-nucleated filaments, respectively, whereas wd,1and wd,2are the turnover rates of the two respective filament
populations.
Experiment
HeLa cells M2 cells In vivo In silico In vivo In silico
f1(rel.) f2(rel.) wd,1(1/s) wd,2(1/s) 0.8 ± 0.08 0.2 ± 0.02 0.3 ± 0.1 0.02 ± 0.01 0.83 ± 0.005 0.17 ± 0.005 0.28 ± 0.003 0.02 ± 0.001 0.75 ± 0.08 0.25 ± 0.03 1 ± 0.2 0.04 ± 0.01 0.76 ± 0.01 0.24 ± 0.01 0.87 ± 0.01 0.045 ± 0.004 kon,F(sub/s) kon,0(sub/s) woff,F(1/s) woff,A(1/s) koff(1/s) 136 ± 14 28 ± 2 0.12 ± 0.02 0.23 ± 0.02 29 ± 3 134 ± 13 27 ± 3 0.12 ± 0.02 0.3 ± 0.02 28 ± 3 102 ± 10 21 ± 2 0.15 ± 0.02 1.1 ± 0.1 23 ± 2 100 ± 10 22 ± 2 0.15 ± 0.02 1.2 ± 0.1 24 ± 2 on February 9, 2018 http://advances.sciencemag.org/ Downloaded from
turnover times of the actin filament subpopulations, as quantified by 1/wd,1and 1/wd,2, were not significantly affected by filament lengthening (Fig. 4B). Thus, cells can adapt their structural and mechanical prop-erties without affecting their response time to external signals. Con-versely, signaling can modulate the time that an individual nucleator is bound to an actin filament, an effect identical to changing the off-rate
woff,For woff,Afor Diaph1 or the Arp2/3 complex, in our finite cortex
simulations. In both cases, the length distribution of the filament sub-population whose nucleator was not being regulated was unaffected. The turnover time of the filaments whose nucleator was being regulated (1/wd,i) decreased with increasing nucleator off-rate (Fig. 4, C to F), but the turnover time of the other population was unaffected. Thus, the two subpopulations can be regulated independently from one another in length and turnover rate. The relative abundances f1and f2of filaments in the two subpopulations changed in response to changes of the re-spective nucleator concentrations (fig. S4), suggesting a mechanism by which cells could change their cortical mechanical properties by altering the activity of each nucleator independently.
Next, we investigated whether severing alone might generate two subpopulations of F-actin with different lengths in the cortex in the presence of only one filament nucleation pathway. Using the finite cortex simulations, we found that, in the presence of a single-filament subpopulation, severing leads to the generation of a cortex whose flu-orescence recovers with multiple relaxation times rather than two dis-tinct time scales, as is the case when two disdis-tinct nucleation pathways are present (section SV).
Atomic force microscopy measurements of actin cortex elasticity
In light of the significant differences in filament length and abundance of the two cortical filament subpopulations, we asked how each sub-population contributed to cortical mechanical properties. We charac-terized cortex elasticity with atomic force microscopy (AFM), using shallow indentations (100 to 500 nm) and small contact areas (mm2) to min-imize contributions from the cytoplasm (Fig. 5, A and B). Recent ex-perimental and theoretical work indicates that, under these conditions,
Fig. 4. Turnover time is decoupled from network structure in the finite cortex simulations. (A and B) The actin concentration controls the length of cortical filaments in HeLa cells but not their turnover times. (C) The length of cortical formin-nucleated filaments is independent of the rate woff,Aat which
an Arp2/3 complex detaches from a filament. (D) The turnover rate wd,1of Arp2/3-nucleated filaments obtained from FRAP measurements increases with
woff,A. (E) The length of Arp2/3-nucleated cortical filaments is independent of the rate woff,Fat which a formin molecule detaches from a filament. (F) The
turnover rate wd,2of formin-nucleated filaments obtained from FRAP measurements increases with woff,F. Parameter values: ron,0= 9 s−1mM−1, ron,F=
45 s−1mM−1, koff= 28 s−1, woff,F= 0.12 s−1, woff,A= 0.3 s−1, ctot= 80 mM, cform= 0.2 nM, and carp= 24 nM.
R E S E A R C H A R T I C L E
on February 9, 2018
http://advances.sciencemag.org/
the measured stiffness is dominated by the macroscale mechanical properties of the cortex (50). Cortical elasticity measurements yielded an elastic modulus of E = 4.0 ± 1.5 kPa in HeLa cells (N = 199 curves, n = 28 cells). Previous work has indicated that Arp2/3 inhibition with 100 mM CK666 leads to a ~30% reduction of cortical actin protomers incorporated in filaments (19), but this did not result in a significant reduction of cortical elasticity (E = 3.5 ± 1.5 kPa, P = 0.1, N = 169 curves on n = 23 cells). In contrast, inhibition of formin with 40 mM of the inhibitor SMIFH2 resulted in a significant decrease of ~25% of the elastic modulus (E = 3.0 ± 1.7 kPa, P < 0.01, N = 210 curves, n = 30 cells, Fig. 5C), despite previous reports showing that Diaph1 deple-tion only reduces cortical actin protomers by ~15% (19). When cor-tical turnover was completely blocked by perturbing both filament populations simultaneously with the same concentrations of SMIFH2 and CK666 as above (18), this resulted in a marked ~50% decrease of cortical elasticity (E = 2.0 ± 1.1 kPa, N = 201 curves, n = 29 cells, Fig. 5C). This value is consistent with the cortical elasticity measured after complete actin cortex depolymerization by application of 5 mM cyto-chalasin D (51). Our results therefore suggest that both short and long filaments contribute to cortical elasticity but that the longer formin-nucleated filaments are a stronger determinant of the macroscale cortex mechanical properties. The differential effect of perturbation of long or short filaments on elasticity could be due either to architectural features of the actin cortex or to differences in the actin-binding proteins re-cruited by each filament subpopulation (52).
DISCUSSION
Together, our experimental and computational results paint the following picture of cortical actin homeostasis. For actin filaments not bound to nucleators, monomeric actin is incorporated at the
barbed ends of actin filaments and lost through disassembly, which includes the dissociation of monomers from pointed ends as well as severing that can potentially lead to the formation of small actin oli-gomers. Because the effective disassembly rate exceeds the assembly rate for these filaments, this results, on average, in a loss of actin mo-nomers and eventual filament disappearance. The amount of cortical F-actin is kept constant through the action of two main F-actin-nucleating factors: Diaph1, which speeds up growth at the barbed end, and the Arp2/3 complex, which prevents actin disassembly from the pointed end. Our results suggest that other processes contribute less than 10% to cortical actin turnover, consistent with previous work showing that Diaph1 and Arp2/3 are the main contributors to cortical actin assembly (19). Filaments nucleated by either pathway differ signifi-cantly in abundance, length, and turnover kinetics. Formin-nucleated filaments make up only 10% of the total number of cortical filaments, but because they are, on average, 10 times longer than Arp2/3-nucleated filaments, they still account for 20 to 25% of the total actin protomers bound in actin filaments (section SVI). Their long length results in a turnover rate that is roughly 20 times smaller than that of Arp2/3-nucleated filaments.
Whereas the formin associated rates woff,Fand kon,F could be di-rectly inferred from single-molecule formin measurements, quantifica-tion of the elongaquantifica-tion rate of free barbed ends kon,0, of the lifetime of Arp2/3 at pointed ends woff,A, and of actin filament disassembly koff required assumptions about the underlying molecular processes. Con-sequently, these values are tied to the dynamics of the assumed mo-lecular mechanisms. Notably, filament disassembly is more complex than the sequential removal of actin protomers from pointed ends (21, 39–43). Moreover, it is possible that the disassembly process and kinetics are different in formin- and Arp2/3-nucleated filaments. In particular, for Arp2/3-nucleated filaments, the pointed-end de-polymerization rate koffcould be nonzero, which would, on average,
Fig. 5. AFM measurements of cortex elasticity. (A) Schematic of an AFM cantilever indenting a cell adhered to a coverslip (left). Using a small tip and restricting the analysis to shallow indentation depths allows characterization of actin cortex elasticity (right). (B) Representative force indentation curves on HeLa cells subjected to different drug perturbations. Using a Hertz contact mechanics model, the elastic modulus was estimated by fitting the force indentation curves up to 500 nm. Inset: Zoom showing curve fitting up to 150-nm indentation. (C) Elasticity of the cell cortex under different experimental conditions. Error bars, SEMs.
on February 9, 2018
http://advances.sciencemag.org/
reduce the length of Arp2/3-nucleated F-actin. However, a compre-hensive detailed molecular picture of actin filament depolymerization in cells is currently not available, such that we decided to describe filament disassembly by an effective disassembly rate resulting from all of the depolymerization processes acting concurrently on the filaments in the cell. On the basis of stochastic simulations that explicitly incor-porate filament severing, we do not expect significant changes in the average filament length distributions if a more detailed scheme for filament disassembly is assumed. Our conclusions about the possible separate control of cortical filament length and cortical turnover time, and about the possible mechanical implications of filament turnover on cortex elasticity, should remain unaffected by our assumptions on the filament disassembly process.
On the basis of our work, distinct functions can be attributed to the two filament populations. The kinetics and length of formin-generated filaments suggest that they ensure cortex integrity. Consistent with this, cortical elasticity is strongly affected by per-turbation of the formin-nucleated filaments, as shown by our AFM measurements. In contrast, the Arp2/3-nucleated filaments do not appear to play an important role in cortical mechanics despite their higher abundance. Thus, they may be involved in the generation of cell protrusions (53) or exocytosis and endocytosis (54), and consti-tute a rapid reaction process for cells to respond to extracellular signals (55). We can further speculate that the extensive blebbing ob-served in M2 cells might be a consequence of the overall shorter length of cortical actin filaments in these cells, something that might compromise the structural integrity of the cortex, whereas a moder-ate increase of the average length by a factor of roughly 2 suffices to stabilize the cortex of HeLa cells (56).
From a mechanical point of view, the very different average length of the actin filaments in each subpopulation, together with their dif-ferent effect on cortical mechanics, suggests that the longer formin-nucleated filaments may distribute stresses over length scales of several micrometers, whereas the shorter and more dynamic Arp2/3-nucleated filaments contribute little. This is consistent with the truss bridge model of the actin cortex (57) in which tightly connected short filaments construct the cortical meshwork and respond to fast localized perturbations in the ranges of the cortex thickness ~100 nm. In contrast, the long fibers that are mostly under tension provide mechanical integrity to the cell by spreading applied forces over length scales comparable to the size of the cell. Furthermore, our results are consistent with computational simulations that indicate that a small portion of longer filaments can significantly increase the elasticity of filament networks (58).
One intriguing prediction of our finite cortex simulations is that actin turnover time can be controlled independently of filament length (Fig. 4, A and B). This may allow cells to adapt the structural or-ganization of their cortex and its mechanical properties without compromising their response time to external signals. Furthermore, our simulations indicate that changes in the relative activities of each type of nucleator will alter the length distribution of filaments (Fig. 4, C to F). Together with our mechanical measurements, this suggests that changes in nucleator activity downstream of biochemical signaling represent an important regulation pathway for cells to adjust their mechanical properties. Further quantification of in vivo kinetic rates will be essential for a molecular characterization of actin behavior and dynamics in response to signaling, mechanical stimulation, or during the cell cycle.
MATERIALS AND METHODS Cell culture
HeLa cells and filamin-deficient M2 melanoma cells (59) were cultured at 37°C in an atmosphere of 5% CO2in air. M2 cells were kept in minimum essential medium (Life Technologies) with penicillin/ streptomycin, glutamine, and 10% of an 80:20 mix of newborn calf serum/fetal bovine serum (FBS). HeLa cells were cultured in Dulbecco’s modified Eagle’s medium (PAA or Gibco) with penicillin/streptomycin, L-glutamine, and 10% FBS. For experimentation, cells were trypsinized and plated onto 25-mm-diameter glass coverslips and cultured over-night. Imaging was done in Leibovitz L15 medium (Life Technologies) supplemented with 10% FBS.
Cell lines, transfections, and transductions
For FRAP experiments, actin-GFP stable cell lines were created using retroviruses generated by transfecting 293-GPG packaging cell lines (a gift from D. Ory, University of Washington) with the gene of interest inserted into the pRetroQ-Ac-GFP vector (Clontech). Cells were then selected with puromycin and subcloned as described by Charras et al. (28). For single-molecule imaging, the CMV promoter of Diaph1-GFP, CA-Diaph1-GFP, and actin-GFP was replaced with a truncated minimal CMV promoter described by Watanabe and Mitchison (26) and referred to as ∆CMV in the following. To study the effects of pointed-end severing, cells expressed dominant-negative cofilinS3E-cherry in addition to CMV-truncated actin-GFP. Cells were trans-fected using Lipofectamine 2000 (Life Technologies) according to the manufacturer’s protocol, using 1 mg of complementary DNA per well of a six-well plate.
Drug treatments
SMIFH2, CK666, and Y27632 were purchased from Merck Biosciences. Drugs were added to the culture medium at the desired concentration, and the cells were left to incubate for at least 10 min before imaging. Inhibitors were also present at the same concentration in the imaging medium.
Confocal microcopy
All FRAP experiments were done using a 1.3 NA 100× oil immersion objective on a scanning laser confocal microscope (FluoView FV1000, Olympus) at 37°C (see fig. S1). For imaging GFP on the scanning confocal microscope, laser intensities between 1 and 5% of a 20-mW laser were used to both obtain a strong signal and minimize photo-bleaching due to image acquisition. Images were acquired at 0.1- to 1-s intervals to minimize the general loss of fluorescence due to imaging while still sampling recovery sufficiently fast to capture the recovery kinetics of the protein of interest.
Single-molecule experiments were effected using a high-NA (NA = 1.3) 100× oil immersion objective on an inverted microscope (IX81, Olympus) fitted with a spinning disc head (CSU22, Yokogawa) coupled to an Andor iXon electron-multiplying charge-coupled device camera. Fluorophores were excited at 488-nm wavelength for GFP-tagged proteins and at 543-nm wavelength for RFP (red fluorescent protein)–tagged proteins. Laser intensities of 100% of a 20-mW laser were used to obtain a strong fluorescence signal. Images were acquired at 0.35- to 5-s intervals, with a 350-ms integration time averaged over 2 frames for 30 frames in total. Images were analyzed using MATLAB (MathWorks Inc.) and ImageJ (http://rsbweb.nih.gov/ij/).
R E S E A R C H A R T I C L E
on February 9, 2018
http://advances.sciencemag.org/
Atomic force microscopy
AFM nanoindentation tests were performed with a JPK NanoWizard I (JPK Instruments) interfaced to an inverted optical microscope (IX81, Olympus). For our measurements, we used cantilevers with small pyramidal tips (MLCT, Bruker; nominal spring constants of 0.07 N m−1). Analysis of force indentations was restricted to depths of 100 to 500 nm (leading to forces less than 200 pN) to maximize the contribution of cortex stiffness to cantilever deflection, enabling us to probe cell cortex elasticity while minimizing contributions from the cytoplasm (50, 60).
Cantilever actual spring constants were determined using the thermal noise method implemented in the AFM software (JPK SPM). Before indentation tests, the sensitivity of the cantilever was set by measuring the slope of force-distance curves acquired on glass regions of the petri dish. With the optical microscope, the tip of the cantilever was aligned over regions above the cell nucleus, and a couple of indentation measurements were performed on the cytoplasm. Force-distance curves were acquired with an approach speed of 5 mm s−1 until reaching the maximum set force of 400 pN. The tip velocity used during indentation tests was chosen such that cantilever indentation times were shorter than filament turnover times and longer than por-oelastic time scales (61). The considered range of indentation depths was comparable to both the lengths of the small Arp2/3 and large formin-nucleated actin filaments, and therefore enabled us to detect the contribution of both networks. Using the method described by Lin et al. (62), we found the contact point, and subsequently, we calculated the indentation depth d by subtracting the cantilever deflec-tion d from the piezo transladeflec-tion z after contact (d = z − d). The elastic moduli were extracted from the force-distance curves by fitting the contact portion of curves to a Hertz contact model between a pyramid and an infinite half-space (63).
FRAP protocol
In FRAP experiments, a small circular region of interest (r = 2 mm) centered on part of the cell cortex was imaged, as described by Fritzsche et al. (18) and Fritzsche and Charras (64). In the center of this region of interest, a smaller circular bleaching region (r = 1 mm) containing both cortex and cytoplasm was chosen. This choice of imaging and bleaching region helped to minimize acquisition-induced fluorescence loss by not exposing the whole cell volume to light. After photobleaching, fluorescence recovery was followed separately in the cortex and the cytoplasm by segmenting these areas on the basis of prebleach images.
To assess the fluorescence loss due to imaging-induced photo-bleaching, fluorescence from a cortical region separated from the bleached region was simultaneously recorded. Bleaching was per-formed by scanning the 488-nm beam operating at 100% laser power over a circular bleach region with a 500-nm radius. The experimental protocol was as follows: Five frames were acquired for normalization of the fluorescence signal. Bleaching was carried out with one single iteration of the laser pulse at 8 ms/pixel. Finally, recovery was monitored over 100 frames. Frames were separated by either 100 ms or 1 s, depending on the recovery kinetics of the protein of interest.
FSM protocol
To exclusively consider cortical F-actin dynamics, single molecules were monitored in an optical section located midway through the cell
height (fig. S1B, equatorial plane), where a well-defined cortex is pres-ent. Measurements could not be performed in the cortex at the basal or apical side of the cells (fig. S1, B and C) because F-actin was mainly present in the form of stress fibers (fig. S1C, basal plane) or microvilli, respectively (fig. S1C, apical plane).
In practice, molecule motility was monitored in a 300-nm-wide strip around the cell periphery corresponding to the cell cortex. For single molecules to be detected within the imaging region, they needed to have residence times longer than the integration time within the volume of the point spread function (27, 62, 65).
In contrast, proteins diffusing freely in the cytoplasm only contrib-ute weakly to the fluorescence signal at any given position. Similarly, proteins freely diffusing in the membrane, such as a CA-Diaph1 protein not bound to the actin cortex, only contribute membranous background signal. The homogeneous background signal stemming from rapidly diffusing proteins has a significantly lower intensity than the signal ema-nating from proteins that are immobile over the time frame of image acquisition (26). For example, G-actin monomers freely diffusing in cells have an effective diffusion constant of Dact~25 mm2/s (18), and thus travel approximately 40 pixels (or ~5 mm) in 1 s.
The experimental protocol was as follows: acquisition at 0.5- to 5-s intervals for capturing actin monomers bound to the cortex only, and 200- to 400-ms illumination of each individual frame averaging each time point over two frames, giving a total integration time of 400 to 800 ms. The total number of frames acquired was 15 to 30 for each cell examined. Simulation algorithm for single-filament simulations Stochastic simulations were done following a Gillespie scheme in C/C++ using the implementation of the Mersenne Twister random number generator from the boost libraries. We call them single-filament simulations.
The filament is represented by a linear array of varying length, storing the time of addition of each protomer. In the case of Arp2/3 nucleation, a filament is initiated as a single monomer, and the pointed end is considered capped by the Arp2/3 complex. Protomers are added to the barbed end at constant rate kon,0. Protomer release from the pointed end occurs at a rate koffand starts after a randomly chosen time corresponding to the time when the Arp2/3 molecule is released. The single-filament simulation stops when the last protomer is removed, and a histogram of the protomer lifetimes is generated. The analysis of formin-nucleated filaments follows the same lines. Protomers are added at the barbed end at a rate kon,Fup to a randomly chosen time corresponding to formin release. After release, protomers are added at rate kon,0. Protomer release at the pointed end occurs at a constant rate koffthroughout the simulation. In both cases, the distribution of life-times was obtained from 1000 independent runs of the single-filament simulation.
Fitting procedures
To obtain the values of the various kinetic rates of actin assembly and nucleator release rates, we fitted the solution of our analytical and computational models to the measured distributions. These distribu-tions displayed a maximum at a finite time and a subsequent expo-nential decay. First, we used the analytical expressions eqs. S23 and S28, respectively, to fit the exponential long-time behavior. To also capture the initial peak, we then used stochastic single-filament simu-lations, which depend on more parameters. Fits were done using a log-likelihood method.
on February 9, 2018
http://advances.sciencemag.org/
Simulation algorithm for finite cortex simulations
Stochastic simulations of the cortex were done following a Gillespie scheme implemented in C/C++, which we call finite cortex simula-tions. Each cortical filament is represented by a linear array of varying length. Simulations are carried out with the same molecular dynamics as described above for the single-filament simulations. In addition, we distinguish between fluorescing and nonfluorescing monomers. The number of filaments varies through nucleation and complete de-polymerization. The total numbers Ntotof actin monomers, Nformof formins, and Narpof arp2/3 complexes are fixed. Monomers are added to free barbed ends at a rate kon,0= ron,0cact, with cactbeing the current free monomer concentration. Monomers are added to barbed ends bound to a formin at rate kon,F= ron,Fcact. Because of the large diffusion constant of free G-actin monomers, their concentration is homoge-neous in a simulated volume of 50 mm3.
We considered Arp2/3 complexes to be single entities and did not distinguish their subunits. Similarly, formin dimers were taken to be single molecules. When released, nucleators instantaneously generated new filaments.
The cortex is represented on a 2D grid of 200 × 200 pixels, corresponding to the image obtained on the experimental setup. Each pixel had a width of 133 nm. We chose periodic boundary conditions for our simulations to reflect the fact that the cell is many fold larger than the bleached zone.
In the cortical region, filaments are represented as planar curves. The effective length added by incorporation of a single monomer into a filament is 2.7 nm, corresponding to one-half of its radius. To mimic the finite persistence length of the filaments, the orientation of a newly added monomer is chosen from a normal distribution with a variance of 0.02 and a mean equal to the orientation of the previous monomer (movie S4).
Finite cortex simulations were first run until the system reached steady state. After a time of the order of Tbleach= 103s, the system is“bleached” by marking all monomers inside filaments as non-fluorescent. Monomers that are subsequently incorporated into a filament are set to be fluorescent. The fluorescence within the bleached zone is given by the number of fluorescent monomers that have been incorporated into the filaments after time Tbleach. Parameter values are summarized in table S2.
SUPPLEMENTARY MATERIALS
Supplementary material for this article is available at http://advances.sciencemag.org/cgi/ content/full/2/4/e1501337/DC1
section SI. Supplementary materials, methods, and figures
section SII. Determination of the formin-induced, barbed-end polymerization rate section SIII. Single-filament computations to determine effective molecular rates section SIV. Determination of filament length distribution in the subpopulations section SV. Filament severing
section SVI. F-actin abundances in the actin cortex fig. S1. Experimental setup.
fig. S2. Single-step photobleaching control by a temporal evolution of the molecule fluorescence intensity.
fig. S3. (A and B) Lifetime distribution with average lifetime woff, F = 0:12 ± 0:1 of (A) Diaph1 (N = 1000 molecules) and of (B) CA-Diaph1 (N = 3000 molecules).
fig. S4. Actin filament fractions depend on the cortical nucleator concentrations.
fig. S5. Fraction F of immobile molecules as a function of the average filament length l according to eq. S5 with p(ℓ) = exp(−ℓ/l)/l.
fig. S6. Effects on molecule mobility.
fig. S7. Illustration of monomer lifetimes during continuous filament growth. fig. S8. Simulated FRAP curves for scenarios including filament severing.
table S1. Comparison between model parameters used in the finite cortex simulations and literature values.
table S2. Parameter values used in the simulations of FRAP experiments. table S3. Parameter values for the two scenarios of filament severing.
movie S1. Fluorescence imaging of cortical Diaph1-GFP in a HeLa cell corresponding to Fig. 1A. movie S2. Fluorescence imaging of cortical actin-GFP in an M2 cell.
movie S3. Detail of fluorescence imaging of cortical Diaph1-GFP in a HeLa cell corresponding to Fig. 1B.
movie S4. Cortex simulation of a FRAP/FLAP experiment in a HeLa cell.
References (71–73)
REFERENCES AND NOTES
1. T. D. Pollard, G. G. Borisy, Cellular motility driven by assembly and disassembly of actin filaments. Cell 112, 453–465 (2003).
2. G. T. Charras, A short history of blebbing. J. Microsc. 231, 466–478 (2008).
3. G. Charras, E. Paluch, Blebs lead the way: How to migrate without lamellipodia. Nat. Rev. Mol. Cell Biol. 9, 730–736 (2008).
4. L. P. Cramer, Forming the cell rear first: Breaking cell symmetry to trigger directed cell migration. Nat. Cell Biol. 12, 628–632 (2010).
5. R. Levayer, T. Lecuit, Biomechanical regulation of contractility: Spatial control and dynam-ics. Trends Cell Biol. 22, 61–81 (2012).
6. G. Salbreux, G. Charras, E. Paluch, Actin cortex mechanics and cellular morphogenesis. Trends Cell Biol. 22, 536–545 (2012).
7. D. Bray, J. G. White, Cortical flow in animal cells. Science 239, 883–888 (1988).
8. P. Kunda, A. E. Pelling, T. Liu, B. Baum, Moesin controls cortical rigidity, cell rounding, and spindle morphogenesis during mitosis. Curr. Biol. 18, 91–101 (2008).
9. M. P. Stewart, J. Helenius, Y. Toyoda, S. P. Ramanathan, D. J. Muller, A. A. Hyman, Hydro-static pressure and the actomyosin cortex drive mitotic cell rounding. Nature 469,
226–230 (2011).
10. J. Xu, D. Wirtz, T. D. Pollard, Dynamic cross-linking by a-actinin determines the mechanical
properties of actin filament networks. J. Biol. Chem. 273, 9570–9576 (1998).
11. O. Lieleg, M. M. A. E. Claessens, A. R. Bausch, Structure and dynamics of cross-linked actin
networks. Soft Matter 6, 218–225 (2010).
12. K. E. Kasza, C. P. Broedersz, G. H. Koenderink, Y. C. Lin, W. Messner, E. A. Millman, F. Nakamura, T. P. Stossel, F. C. MacKintosh, D. A. Weitz, Actin filament length tunes elas-ticity of flexibly cross-linked actin networks. Biophys. J. 99, 1091–1100 (2010). 13. T. T. Falzone, M. Lenz, D. R. Kovar, M. L. Gardel, Assembly kinetics determine the
architecture of a-actinin crosslinked F-actin networks. Nat. Commun. 3, 861 (2012). 14. A. Sonn-Segev, A. Bernheim-Groswasser, Y. Roichman, Extracting the dynamic correlation
length of actin networks from microrheology experiments. Soft Matter 10, 8324–8329
(2014).
15. F. Ressad, D. Didry, C. Egile, D. Pantaloni, M.-F. Carlier, Control of actin filament length and turnover by actin depolymerizing factor (ADF/cofilin) in the presence of capping proteins
and ARP2/3 complex. J. Biol. Chem. 274, 20970–20976 (1999).
16. E. Andrianantoandro, T. D. Pollard, Mechanism of actin filament turnover by severing and nucleation at different concentrations of ADF/cofilin. Mol. Cell 24, 13–23 (2006). 17. D. R. Kovar, E. S. Harris, R. Mahaffy, H. N. Higgs, T. D. Pollard, Control of the assembly of
ATP- and ADP-actin by formins and profilin. Cell 124, 423–435 (2006).
18. M. Fritzsche, A. Lewalle, T. Duke, K. Kruse, G. Charras, Analysis of turnover dynamics of the submembranous actin cortex. Mol. Biol. Cell 24, 757–767 (2013).
19. M. Bovellan, Y. Romeo, M. Biro, A. Boden, P. Chugh, A. Yonis, M. Vaghela, M. Fritzsche, D. Moulding, R. Thorogate, A. Jégou, A. J. Thrasher, G. Romet-Lemonne, P. P. Roux, E. K. Paluch, G. Charras, Cellular control of cortical actin nucleation. Curr. Biol. 24, 1628–1635 (2014).
20. J.-F. Joanny, K. Kruse, J. Prost, S. Ramaswamy, The actin cortex as an active wetting layer. Eur. Phys. J. E. Soft Matter 36, 52 (2013).
21. C. Erlenkämper, K. Kruse, Treadmilling and length distributions of active polar filaments. J. Chem. Phys. 139, 164907 (2013).
22. C. P. Broedersz, F. C. MacKintosh, Modeling semiflexible polymer networks. Rev. Mod. Phys.
86, 995–1036 (2014).
23. N. Watanabe, S. Yamashiro, D. Vavylonis, T. Kiuchi, Molecular viewing of actin polymerizing actions and beyond: Combination analysis of single-molecule speckle microscopy with modeling, FRAP and s-FDAP (sequential fluorescence decay after photoactivation). Dev.
Growth Differ. 55, 508–514 (2013).
24. D. Axelrod, D. E. Koppel, J. Schlessinger, E. Elson, W. W. Webb, Mobility measurement by analysis of fluorescence photobleaching recovery kinetics. Biophys. J. 16, 1055–1069 (1976).
25. B. L. Sprague, R. L. Pego, D. A. Stavreva, J. G. McNally, Analysis of binding reactions by
fluorescence recovery after photobleaching. Biophys. J. 86, 3473–3495 (2004).
R E S E A R C H A R T I C L E
on February 9, 2018
http://advances.sciencemag.org/
26. N. Watanabe, T. J. Mitchison, Single-molecule speckle analysis of actin filament turnover in lamellipodia. Science 295, 1083–1086 (2002).
27. G. Danuser, C. M. Waterman-Storer, Quantitative fluorescent speckle microscopy of cyto-skeleton dynamics. Annu. Rev. Biophys. Biomol. Struct. 35, 361–387 (2006).
28. G. T. Charras, C.-K. Hu, M. Coughlin, T. J. Mitchison, Reassembly of contractile actin cortex in cell blebs. J. Cell Biol. 175, 477–490 (2006).
29. M. Fritzsche, R. Thorogate, G. Charras, Quantitative analysis of ezrin turnover dynamics in the actin cortex. Biophys. J. 106, 343–353 (2014).
30. C. Higashida, T. Miyoshi, A. Fujita, F. Oceguera-Yanez, J. Monypenny, Y. Andou, S. Narumiya, N. Watanabe, Actin polymerization-driven molecular movement of mDia1 in living cells. Science 303, 2007–2010 (2004).
31. H. Mizuno, C. Higashida, Y. Yuan, T. Ishizaki, S. Narumiya, N. Watanabe, Rotational move-ment of the formin mDia1 along the double helical strand of an actin filamove-ment. Science
331, 80–83 (2011).
32. D. Li, M. B. Sewer, RhoA and DIAPH1 mediate adrenocorticotropin-stimulated cortisol
bio-synthesis by regulating mitochondrial trafficking. Endocrinology 151, 4313–4323 (2010).
33. S. Romero, C. Le Clainche, D. Didry, C. Egile, D. Pantaloni, M.-F. Carlier, Formin is a proces-sive motor that requires profilin to accelerate actin assembly and associated ATP hydrol-ysis. Cell 119, 419–429 (2004).
34. K. Gowrishankar, S. Ghosh, S. Saha, R. C., S. Mayor, M. Rao, Active remodeling of cortical
actin regulates spatiotemporal organization of cell surface molecules. Cell 149, 1353–1367
(2012).
35. S. A. Rizvi, E. M. Neidt, J. Cui, Z. Feiger, C. T. Skau, M. L. Gardel, S. A. Kozmin, D. R. Kovar, Identification and characterization of a small molecule inhibitor of formin-mediated actin
assembly. Chem. Biol. 16, 1158–1168 (2009).
36. N. Morone, T. Fujiwara, K. Murase, R. S. Kasai, H. Ike, S. Yuasa, J. Usukura, A. Kusumi, Three-dimensional reconstruction of the membrane skeleton at the plasma membrane interface by electron tomography. J. Cell Biol. 174, 851–862 (2006).
37. B. J. Nolen, N. Tomasevic, A. Russell, D. W. Pierce, Z. Jia, C. D. McCormick, J. Hartman, R. Sakowicz, T. D. Pollard, Characterization of two classes of small molecule inhibitors of Arp2/3 complex. Nature 460, 1031–1034 (2009).
38. B. Hetrick, M. S. Han, L. A. Helgeson, B. J. Nolen, Small molecules CK-666 and CK-869 inhibit actin-related protein 2/3 complex by blocking an activating conformational change. Chem.
Biol. 20, 701–712 (2013).
39. H. Y. Kueh, G. T. Charras, T. J. Mitchison, W. M. Brieher, Actin disassembly by cofilin, cor-onin, and Aip1 occurs in bursts and is inhibited by barbed-end cappers. J. Cell Biol. 182, 341–353 (2008).
40. C. J. Staiger, M. B. Sheahan, P. Khurana, X. Wang, D. W. McCurdy, L. Blanchoin, Actin fila-ment dynamics are dominated by rapid growth and severing activity in the Arabidopsis cortical array. J. Cell Biol. 184, 269–280 (2009).
41. A. V. Nadkarni, W. M. Brieher, Aip1 destabilizes cofilin-saturated actin filaments by severing and accelerating monomer dissociation from ends. Curr. Biol. 24, 2749–2757 (2014). 42. S. Jansen, A. Collins, S. M. Chin, C. A. Ydenberg, J. Gelles, B. L. Goode, Single-molecule
imaging of a three-component ordered actin disassembly mechanism. Nat. Commun. 6, 7202 (2015).
43. M. A. Mikati, D. Breitsprecher, S. Jansen, E. Reisler, B. L. Goode, Coronin enhances actin filament severing by recruiting cofilin to filament sides and altering F-actin conformation. J. Mol. Biol. 427, 3137–3147 (2015).
44. M. Vinzenz, M. Nemethova, F. Schur, J. Mueller, A. Narita, E. Urban, C. Winkler, C. Schmeiser, S. A. Koestler, K. Rottner, G. P. Resch, Y. Maeda, J. V. Small, Actin branching in the initiation and maintenance of lamellipodia. J. Cell Sci. 125, 2775–2785 (2012).
45. S. Schaub, J.-J. Meister, A. B. Verkhovsky, Analysis of actin filament network organization in lamellipodia by comparing experimental and simulated images. J. Cell Sci. 120, 1491–1500 (2007). 46. F. Eghiaian, A. Rigato, S. Scheuring, Structural, mechanical, and dynamical variability of the
actin cortex in living cells. Biophys. J. 108, 1330–1340 (2015).
47. L. A. Helgeson, B. J. Nolen, Mechanism of synergistic activation of Arp2/3 complex by cor-tactin and N-WASP. Elife 2, e00884 (2013).
48. T. Kiuchi, T. Nagai, K. Ohashi, K. Mizuno, Measurements of spatiotemporal changes in G-actin concentration reveal its effect on stimulus-induced G-actin assembly and lamellipo-dium extension. J. Cell Biol. 193, 365–380 (2011).
49. C. Higashida, S. Suetsugu, T. Tsuji, J. Monypenny, S. Narumiya, N. Watanabe, G-actin reg-ulates rapid induction of actin nucleation by mDia1 to restore cellular actin polymers. J.
Cell Sci. 121, 3403–3412 (2008).
50. R. Vargas-Pinto, H. Gong, A. Vahabikashi, M. Johnson, The effect of the endothelial cell
cortex on atomic force microscopy measurements. Biophys. J. 105, 300–309 (2013).
51. J. R. Ramos, J. Pabijan, R. Garcia, M. Lekka, The softening of human bladder cancer cells happens at an early stage of the malignancy process. Beilstein J. Nanotechnol. 5, 447–457 (2014). 52. A. Michelot, D. G. Drubin, Building distinct actin filament networks in a common
cyto-plasm. Curr. Biol. 21, R560–R569 (2011).
53. A. J. J. Worth, J. Metelo, G. Bouma, D. Moulding, M. Fritzsche, B. Vernay, G. Charras, G. O. C. Cory, A. J. Thrasher, S. O. Burns, Disease-associated missense mutations in the
EVH1 domain disrupt intrinsic WASp function causing dysregulated actin dynamics and impaired dendritic cell migration. Blood 121, 72–84 (2013).
54. M. Malacombe, M.-F. Bader, S. Gasman, Exocytosis in neuroendocrine cells: New tasks for actin. Biochim. Biophys. Acta 1763, 1175–1183 (2006).
55. K. G. Campellone, M. D. Welch, A nucleator arms race: Cellular control of actin assembly. Nat. Rev. Mol. Cell Biol. 11, 237–251 (2010).
56. E. Derivery, J. Fink, D. Martin, A. Houdusse, M. Piel, T. E. Stradal, D. Louvard, A. Gautreau, Free Brick1 is a trimeric precursor in the assembly of a functional wave complex. PLOS One 3, e2462 (2008).
57. Y. Luo, X. Xu, T. Lele, S. Kumar, D. E. Ingber, A multi-modular tensegrity model of an actin stress fiber. J. Biomech. 41, 2379–2387 (2008).
58. M. Bai, A. R. Missel, A. J. Levine, W. S. Klug, On the role of the filament length distribution in the mechanics of semiflexible networks. Acta Biomater. 7, 2109–2118 (2011). 59. C. C. Cunningham, J. B. Gorlin, D. J. Kwiatkowski, J. H. Hartwig, P. A. Janmey, H. R. Byers,
T. P. Stossel, Actin-binding protein requirement for cortical stability and efficient
locomo-tion. Science 255, 325–327 (1992).
60. A. R. Harris, G. T. Charras, Experimental validation of atomic force microscopy-based cell elasticity measurements. Nanotechnology 22, 345102 (2011).
61. E. Moeendarbary, L. Valon, M. Fritzsche, A. R. Harris, D. A. Moulding, A. J. Thrasher, E. Stride, L. Mahadevan, G. T. Charras, The cytoplasm of living cells behaves as a poroelastic
material. Nat. Mater. 12, 253–261 (2013).
62. D. C. Lin, E. K. Dimitriadis, F. Horkay, Robust strategies for automated AFM force curve
analysis—I. Non-adhesive indentation of soft, inhomogeneous materials. J. Biomech.
Eng. 129, 430–440 (2007).
63. G. G. Bilodeau, Regular pyramid punch problem. J. Appl. Mech. 59, 519–523 (1992).
64. M. Fritzsche, G. Charras, Dissecting protein reaction dynamics in living cells by
fluores-cence recovery after photobleaching. Nat. Protoc. 10, 660–680 (2015).
65. G. Danuser, C. M. Waterman-Storer, Quantitative fluorescent speckle microscopy: Where it came from and where it is going. J. Microsc. 211, 191–207 (2003).
66. I. Fujiwara, D. Vavylonis, T. D. Pollard, Polymerization kinetics of ADP- and ADP-Pi-actin determined by fluorescence microscopy. Proc. Natl. Acad. Sci. U.S.A. 104, 8827–8832 (2007).
67. D. R. Kovar, T. D. Pollard, Insertional assembly of actin filament barbed ends in association
with formins produces piconewton forces. Proc. Natl. Acad. Sci. U.S.A. 101, 14725–14730 (2004).
68. T. D. Pollard, Regulation of actin filament assembly by Arp2/3 complex and formins. Annu.
Rev. Biophys. Biomol. Struct. 36, 451–477 (2007).
69. M.-F. Carlier, V. Laurent, J. Santolini, R. Melki, D. Didry, G.-X. Xia, Y. Hong, N.-H. Chua, D. Pantaloni, Actin depolymerizing factor (ADF/cofilin) enhances the rate of filament
turnover: Implication in actin-based motility. J. Cell Biol. 136, 1307–1322 (1997).
70. A. Jégou, T. Niedermayer, J. Orbán, D. Didry, R. Lipowsky, M.-F. Carlier, G. Romet-Lemonne, Individual actin filaments in a microfluidic flow reveal the mechanism of ATP hydrolysis and give insight into the properties of profilin. PLOS Biol. 9, e1001161 (2011). 71. T. Mseka, J. R. Bamburg, L. P. Cramer, ADF/cofilin family proteins control formation of
oriented actin-filament bundles in the cell body to trigger fibroblast polarization. J. Cell
Sci. 120, 4332–4344 (2007).
72. B. W. Bernstein, J. R. Bamburg, ADF/cofilin: A functional node in cell biology. Trends Cell
Biol. 20, 187–195 (2010).
73. L. Blanchoin, T. D. Pollard, Mechanism of interaction of Acanthamoeba actophorin (ADF/
Cofilin) with actin filaments. J. Biol. Chem. 274, 15538–15546 (1999).
Acknowledgments: We wish to acknowledge the University College London Comprehensive Biomedical Research Centre for funding of microscopy equipment. Funding: M.F. was funded by a Human Frontier Science Program Young Investigator grant to G.C. (RGY 66/2013). E.M. is grateful for the financial support through a Wellcome Trust–Massachusetts Institute of Technology fellowship (grant WT103883). G.C. was supported by a University Research Fellowship from the Royal Society. C.E. and K.K. were supported by the Graduate School GK1276 and the SFB1027 of the Deutsche Forschungsgemeinschaft. Author contributions: M.F., G.C., and K.K. designed the research; M.F. performed experiments with help from G.C. and E.M.; C.E. developed and performed stochastic simulations; M.F., G.C., and K.K. wrote the manuscript with input from all authors; and all authors analyzed data. Competing interests: The authors declare that they have no competing financial interests. Data and materials availability: All data needed to evaluate the conclusions in the paper are present in the paper and/or the Supplementary Materials. Additional data related to this paper may be requested from the authors.
Submitted 27 September 2015 Accepted 30 March 2016 Published 22 April 2016 10.1126/sciadv.1501337
Citation: M. Fritzsche, C. Erlenkämper, E. Moeendarbary, G. Charras, K. Kruse, Actin kinetics shapes cortical network structure and mechanics. Sci. Adv. 2, e1501337 (2016).
on February 9, 2018
http://advances.sciencemag.org/
Actin kinetics shapes cortical network structure and mechanics
Marco Fritzsche, Christoph Erlenkämper, Emad Moeendarbary, Guillaume Charras and Karsten Kruse
DOI: 10.1126/sciadv.1501337 (4), e1501337.
2
Sci Adv
ARTICLE TOOLS http://advances.sciencemag.org/content/2/4/e1501337
MATERIALS
SUPPLEMENTARY http://advances.sciencemag.org/content/suppl/2016/04/19/2.4.e1501337.DC1
REFERENCES
http://advances.sciencemag.org/content/2/4/e1501337#BIBL This article cites 73 articles, 23 of which you can access for free
PERMISSIONS http://www.sciencemag.org/help/reprints-and-permissions
Terms of Service Use of this article is subject to the
registered trademark of AAAS.
is a Science Advances Association for the Advancement of Science. No claim to original U.S. Government Works. The title
York Avenue NW, Washington, DC 20005. 2017 © The Authors, some rights reserved; exclusive licensee American (ISSN 2375-2548) is published by the American Association for the Advancement of Science, 1200 New Science Advances
on February 9, 2018
http://advances.sciencemag.org/