HAL Id: inserm-00782438
https://www.hal.inserm.fr/inserm-00782438
Submitted on 29 Jan 2013
HAL is a multi-disciplinary open access
archive for the deposit and dissemination of
sci-entific research documents, whether they are
pub-lished or not. The documents may come from
teaching and research institutions in France or
abroad, or from public or private research centers.
L’archive ouverte pluridisciplinaire HAL, est
destinée au dépôt et à la diffusion de documents
scientifiques de niveau recherche, publiés ou non,
émanant des établissements d’enseignement et de
recherche français ou étrangers, des laboratoires
publics ou privés.
Frederique Archambaud, Viviane Bouilleret, Lucie Hertz-Pannier, Philippe
Chaumet-Riffaud, Sebastian Rodrigo, Olivier Dulac, Francine Chassoux,
Catherine Chiron
To cite this version:
Frederique Archambaud, Viviane Bouilleret, Lucie Hertz-Pannier, Philippe Chaumet-Riffaud,
Sebas-tian Rodrigo, et al.. Optimizing statistical parametric mapping analysis of 18F-FDG PET in children..
EJNMMI Research, SpringerOpen, 2013, 3 (1), pp.2. �10.1186/2191-219X-3-2�. �inserm-00782438�
O R I G I N A L R E S E A R C H
Open Access
Optimizing statistical parametric mapping
analysis of
18
F-FDG PET in children
Frederique Archambaud
1,3,4,5, Viviane Bouilleret
1,3,4,5, Lucie Hertz-Pannier
1,2,3,4, Philippe Chaumet-Riffaud
5,
Sebastian Rodrigo
1,3,4, Olivier Dulac
1,2,4,6, Francine Chassoux
1,2,3,4,7and Catherine Chiron
1,2,3,4,6*Abstract
Background: Statistical parametric mapping (SPM) procedure is an objective tool to analyze 18F-fluoro-2-deoxy-D-glucose-positron-emission tomography (FDG-PET) images and a useful complement to visual analysis. However, SPM requires a comparison to control data set that cannot be obtained in healthy children for ethical reasons. Using adults as controls showed some limitations. The purpose of the present study was to generate and validate a group of pseudo-normal children as a control group for FDG-PET studies in pediatrics.
Methods: FDG-PET images of 47 children (mean ± SD age 10.2 ± 3.1 years) with refractory symptomatic (MRI-positive, n = 20) and cryptogenic (MRI-negative, n = 27) focal epilepsy planned for surgery were analyzed using visual and SPM analysis. Performances of SPM analysis were compared using two different control groups: (1) an adult control group consisting of healthy young adults (n = 25, 30.5 ± 5.8 years, adult PET template) and (2) a pediatric pseudo-control group consisting of patients (n = 24, 10.6 ± 3.1 years, children PET template) with refractory focal epilepsy but with negative MRI and with PET considered normal not only on visual analysis but also on SPM.
Results: Among the 47 children, visual analysis succeeded detecting at least one hypometabolic area in 87% of the cases (interobserver kappa = 0.81). Regarding SPM analysis, the best compromise between sensitivity and specificity was obtained with a threshold of p less than 0.001 as an extent of more than 40 voxels. There was a significant concordance to detect hypometabolic areas between both SPM analyses [kappa (K) = 0.59; p < 0.005] and between both SPM and visual analyses (K = 0.45; p < 0.005), in symptomatic (K = 0.74; p < 0.005) as in cryptogenic patients (K = 0.26; p < 0.01). The pediatric pseudo-control group dramatically improved specificity (97% vs. 89%; p < 0.0001) by increasing the positive predictive value (86% vs. 65%). Sensitivity remained acceptable although it was not better (79% vs. 87%, p = 0.039). The main impact was to reduce by 41% the number of hypometabolic cortical artifacts detected by SPM, especially in the younger epileptic patients, which is a key point in clinical practice.
Conclusions: This age-matched pseudo-control group is a way to optimize SPM analysis of FDG-PET in children with epilepsy. It might also be considered for other brain pathologies in pediatrics in the future.
Keywords: PET, FDG, SPM, Children, Epilepsy Background
Visual inspection of 18F-fluoro-2-deoxy-D-glucose-positron-emission tomography (FDG-PET) images is extensively used in pediatric clinical practice, but it remains subjective and depends on the expertise and experience of the observer. By contrast, statistical para-metric mapping (SPM) is an objective and therefore
observer independent method of analysis [1,2], but it requires comparison to a control data set that is quite impossible to obtain in healthy children for ethical rea-sons. Based on FDG-PET in pediatric epilepsy, the present study proposes to generate and validate a pseudo-control group of pediatric patients for SPM studies in children.
PET with 18F-fluoro-2-deoxy-D-glucose or FDG-PET currently plays a key role in the investigation and man-agement of patients with refractory focal epilepsy, par-ticularly when surgery is a therapeutic option [3,4]. The * Correspondence:[email protected]
1Inserm, U663, Service de Neurologie et Métabolisme, Hôpital Necker, 149
rue de Sèvres, Paris 75015, France
2University Paris Descartes, Paris 75005, France
Full list of author information is available at the end of the article
© 2013 Archambaud et al.; licensee Springer. This is an Open Access article distributed under the terms of the Creative Commons Attribution License (http://creativecommons.org/licenses/by/2.0), which permits unrestricted use, distribution, and reproduction in any medium, provided the original work is properly cited.
Archambaudet al. EJNMMI Research 2013, 3:2 http://www.ejnmmires.com/content/3/1/2
use of FDG-PET over the past decades has shown that regions of interictal hypometabolism are strongly asso-ciated with the seizure onset zone (also called the epi-leptogenic zone) in adults as in children, although the hypometabolism may often extend beyond this zone [5-7] or occasionally miss it [8]. Findings are usually analyzed visually, and this is considered to carry power-ful detecting value, although it is highly variable accord-ing to the location (temporal/extratemporal) and type (positive/negative MRI) of epilepsy [9-11]. PET/MRI cor-egistration also impacts visual detection [12-14]. SPM proved to be a useful strategy for FDG-PET in adults with refractory focal epilepsy not only in temporal lobe cases [5,7,15-19], but also in extratemporal epilepsy and/ or negative MRI, where sensitivity of visual analysis is lower [20]. For instance, in MRI-negative frontal lobe epilepsy patients, SPM sensitivity was equivalent or su-perior to visual analysis [20,21]. As a result SPM is more and more used as a complementary procedure to study focal epilepsy in adults.
By contrast, SPM in children with epilepsy remains lim-ited to a few teams [22-26] and provides discordant results [14,27]. SPM procedure requires image normalization to a template before a statistical comparison is done to a con-trol group. Because of ethical constraints regarding PET in normal children, pediatric SPM application most often has to use an adult template and adult controls, but such a procedure has major limitations. One issue is the differ-ence in size of the head of adults and children which can-not be solved with spatial correction and requires the use of a pediatric template for children below the age of 6 years [23]. Another issue is the major age-related changes of cerebral glucose metabolism, in cortical as in the sub-cortical structures, throughout the entire childhood [28,29]. Regional metabolism increases from birth to around 4 years up to values over twice the adult values, which were maintained until the end of the first decade, when they began to decline and reach adult rates by the end of the second decade. Metabolism increases earlier in the sensorimotor and occipital cortex than in the frontal cortex and increases higher in the cerebral cortex than in subcortical structures and cerebellum [28]. In the anterior cingulate cortex and the thalamus in particular, metabol-ism continues to increase up to 25 years and then remains relatively stable [29]. Such widespread hypometabolic changes related to the maturation of cortical and subcor-tical structures may complicate the interpretation of SPM results in children when compared to adults (is a given hypometabolism pathological or physiological?) and may decrease the sensitivity of detection of hypometabolic areas using SPM. These issues point out the need of an age-matched control group.
Despite continuous debate, ethical constraints prevent investigating healthy children as control subjects for
PET studies. To our knowledge, only two authorizations have been delivered up to now, and they did not include patients under 6 years of age because they usually need sedation to be scanned [30,31]. As an alternative, popu-lations of pediatric patients had therefore to be used as control groups. A first option was to focus on children with another pathology and to test the difference with the pathology to be studied. Using this approach, Zilbovicius et al. succeeded identifying bitemporal dys-function with H2015 PET in autistic children compared
to children with idiopathic mental retardation [32], and Juhasz et al. identified a medial prefrontal hypometabolic network with FDG-PET in epileptic children with ag-gressive behavior compared to non-agag-gressive ones [33]. However, such control groups cannot be extended to other studies since they provide PET images with pathology-related anomalies. A second option was to generate pediatric control groups from patients with normal PET images. Two historical studies provided FDG-PET imaging from respectively sick children con-sidered retrospectively as normal and pediatric idio-pathic focal epilepsy, thus permitting to establish the maturational profile of cortical and subcortical metabol-ism, but the data are not compatible with current PET machines [28,34]. The present study provides compatible data from the epilepsy field.
The aim of this study was to evaluate a pediatric age-paired pseudo-control group compared to a classical adult control group in order to optimize the use of SPM analysis in children with refractory epilepsy.
Materials
We retrospectively studied the 71 consecutive children re-ferred for FDG-PET examination at our institution during a 4-year period. Inclusion criteria were the following: diag-nosis of refractory focal epilepsy, previous extensive work-up including video-EEG (electroencephalogram) recordings and MR imaging, and age over 2 years (based on recruit-ment). The protocol was approved by the institutional eth-ical standards committee on human experimentation, and written informed consent was obtained from all guardians of patients participating in the study.
Clinical findings are summarized in Table 1. Patients’ age at PET ranged from 2.5 to 17.9 years. MRI had been analyzed by a trained radiologist (LHP) blind to PET findings. Finding was considered negative (cryptogenic epilepsy) in 51 cases (72%), whereas a lesion was identi-fied (symptomatic epilepsy) in the 20 others. Most often there was a suspicion of focal cortical dysplasia (n = 16). Other causes were hippocampal sclerosis (n = 1), ische-mic lesion in the white matter (n = 2), or extensive cerebral malformation despite focal epilepsy (n = 1). Lateralization and hypothesis on the location of the seiz-ure onset zone (SOZ) was based on the scalp video-EEG
in all and on the additional intracranial depth electrodes in 15 of them. Seizures were recorded in all patients but with three presenting active and permanent interictal spike focus concordant with seizure semiology. SOZ equally involved right or left hemispheres; lateralization was undetermined (bilateral in 12 cases, frontal and/or central, unknown in 1 case) in 18% of the patients. SOZ mostly affected the frontal or central regions, and the lo-cation was undetermined in only 4% of the cases. Seven-teen children have currently been operated on with at least 1 year follow-up, and 13 of them are seizure-free.
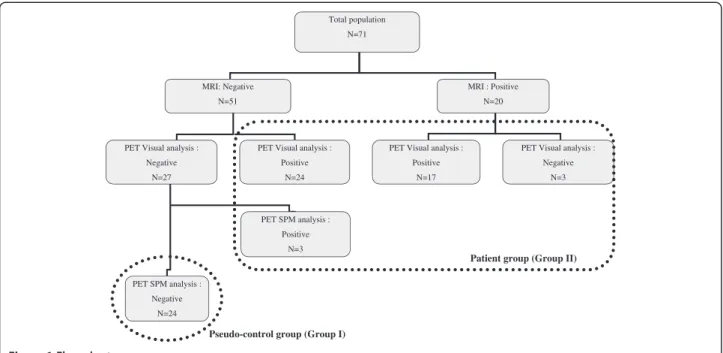
We defined two groups according to MRI and PET analysis (using both visual and SPM analysis, see Meth-ods) (Figure 1). Group I (pseudo-control group) com-prised the 24 children with negative MRI and negative (normal) PET; group II (patient group) comprised the remaining 47 children with positive (abnormal) PET (20 had positive MRI, 27 had negative MRI). The clinical characteristics of groups I and II were similar regarding age, sex, and lateralization and location of the SOZ (Table 1). They were compared to an in-house adult control group (21 healthy adults, aged 21 to 40 years, mean 30.5 ± 5.8 years), in which PET scans were per-formed as a research protocol approved by the local eth-ics committee (CPP Pitié-Salpêtrière, Paris, France) and written informed consent was obtained.
Methods
Image acquisition
18F-FDG PET
Patients were examined using ECAT EXAT HR+ (Siemens Medical Solutions, Munich, Germany) (I2BM, CEA, Hospital F. Joliot, Orsay, France), a whole-body scanner that can acquire in 3D mode 63 slices of 2.4-mm thickness simultaneously. Transverse and axial in-trinsic spatial resolutions at the center of the field of view are respectively 4.3 and 4.1 mm. The patients were investigated in a fasting and resting state, in a quiet, dimly lit environment. The last seizure had occurred more than 6 h before PET examination except for 11 patients (less than 1 h in three, between 1 and 6 h in eight). In 14 patients, 5 mg/kg of pentobarbital were administered rectally for sedation 1 h before the PET examination to keep the child still during the exam, a procedure which does not impact glucose metabolism in one region specifically [35]. A brain attenuation map was obtained using a transmission acquisition of three rod sources of 88Ge for 15 min. Then 3.7 MBq/kg of
18
FDG (maximum 180 MBq) was administered intraven-ously, and the child remained lying in the scanner. At 30 min the patients’ head was precisely re-positioned simi-lar to transmission using face landmarks and 3D laser, and the PET dynamic acquisition began, including four Table 1 Clinical findings
All (n = 71) Pseudo-control group (n = 24) Patient group (n = 47) Age range (years) (mean ± SD) 2.5 to 17.9 (10.2 ± 3.6) 4.5 to 17.9 (10.6 ± 3.1) 2.5 to 17.2 (9.9 ± 3.1)
Sex Females 38 15 23 Males 33 9 24 MRI Negative 51 24 27 Positive 20 0 20 EEG Scalp 71 24 47 Intracranial 15 3 12
SOZ lateralization Right 28 7 21
Left 30 10 20
Undetermined 13 7 6
SOZ location Frontal 21 9 12
Central 19 6 13 FT 5 1 4 Temporal 14 4 10 TPO 7 3 4 Occipital 2 0 2 Undetermined 3 1 2
Epilepsy surgery Performed 21 4 17a Follow-up >1 year 17 3 14b Seizure free at 1 year follow-up 13 1 12b
a
Five patients required a second operation to complete the resection;b
after the last operation. SD, standard deviation; y, years; EEG, electroencephalogram; SOZ, seizure onset zone; FT, fronto-temporal; TPO, temporo-parieto-occipital.
Archambaudet al. EJNMMI Research 2013, 3:2 Page 3 of 10 http://www.ejnmmires.com/content/3/1/2
frames in 5 min. Data sets were reconstructed using Hanning apodization window (0.5 cycles per pixel cut-off ) as radial and axial filters providing an image reso-lution of 6.6 mm in the three directions.
MRI
Brain MRI was obtained for all subjects using a 1.5 Tesla imager (General Electric Healthcare, Buc Cedex, France) on the same day. A standard T1-weighted inversion-recovery fast spoiled gradient recalled (IR-FSPRGR) sequence was performed with axial orientation using an inversion/echo/ repetition time, with a 1.2-mm slice thickness, as well as T2-weighted and fluid attenuated inversion recovery sequences in coronal and/or axial orientation.
Image analysis
MRI images were interpreted by a pediatric neuroradiol-ogist (LHP) who was blinded to the patients’ identity.
18F-FDG PET visual analysis 18
FDG-PET images were analyzed independently by two experts trained to perform 18F-FDG PET analysis (FA and FC) after they were given information on the sup-posed location of SOZ as usually done in the literature. Transaxial, sagittal, and coronal slices were analyzed using the local software BrainVisa-Anatomist (brainvisa. info/index_f.html) after reorientation in either hippo-campal plane (for temporal lobe epilepsies) or CA-CP plane (for extratemporal epilepsies). The cortical areas of18FDG hypofixation (hypometabolisms) were classified according to their extent (unilateral lobar, unilateral multilobar, hemispheric, and bilateral), intensity (discrete,
moderate, or severe), and location among the five left and right following cortical regions systematically ana-lyzed (ten regions per patient): frontal, central, parietal, temporal or insular, and occipital. A hypometabolic area was considered significant when seen on more than one slice (3.5-mm thickness) and had moderate to severe in-tensity. To assess the concordance between both experts, a kappa test was performed. In patients with discordant results, images were reviewed by both experts to reach a consensus.
18F-FDG PET SPM analysis
It was achieved using MATLAB7 (The Mathworks, Inc., Natick, MA, USA) and the statistical parametric mapping software SPM5 (www.fil.ion.ucl.ac.uk). Individual analysis was based on the contrast patient < controls (hypometabo-lism), using a 2-sample t test and age as covariate. The resulting SPM (t) statistic threshold was at three levels: p< 0.001 (uncorrected), p < 0.01 (uncorrected), and p < 0.05 (corrected), and at three extents of contiguous voxels per cluster of 40, 100, and 200, as previously reported [27]. Similarly to the visual analysis, the significant hypome-tabolic clusters were classified according to their loca-tion among the ten previously menloca-tioned regions. We defined as true hypometabolic clusters the significantly abnormal clusters having a cortical location concordant with visual analysis (hypometabolic areas) or being clinically relevant when visually absent (i.e., on the same side and with the same location as SOZ); the remaining abnormal clusters were defined as artifacts. True hypo-metabolic clusters and artifacts are retrospectively defined patients with true positive and false positive PET
Pseudo-control group (Group I)
Patient group (Group II)
Total population N=71 MRI: Negative N=51 MRI : Positive N=20
PET Visual analysis : Positive
N=17 PET Visual analysis :
Negative N=27
PET Visual analysis : Positive
N=24
PET Visual analysis : Negative N=3 PET SPM analysis : Positive N=3 PET SPM analysis : Negative N=24
at SPM analysis (Figure 1). We also reported the hypo-metabolic clusters located within the interhemispheric fissure, but they were excluded from the analysis since they were extracortical.
Groups I and II were analyzed as follows (Figure 1): Group I (Pseudo-control group). To compose this group, we initially considered the 27 MRI-negative children with normal PET at visual analysis. We normalized PET images using an in-house pediatric template (44 children with negative MRI, including 28 with focal epilepsy and 16 with degenerative-like neuro-Langerhans histiocytosis, mean age 10 ± 3 years) [36]. We compared each child to the rest of the group (n = 26) in order to detect any residual cluster with abnormal metabolism and therefore to reach the lowest inter-subject variability as possible [37]. For this analysis we selected the threshold p < 0.001 and voxel size greater than 40 (see“Results”), and we also studied the contrast patient > controls (hypermetabolism) using the same parameters as for hypometabolism. True hypo and/or hypermetabolic clusters were found in three children; thus, the definite pseudo-control group was restricted to the 24 children without any relevant metabolic abnormality after this 2-step procedure. Group II (Patient group). This group comprised the 44 children with abnormal PET at visual analysis and the three patients excluded from the previous group. Two successive SPM analyses (SPM-A and SPM-P) were performed using two different control groups: (1) SPM-A, PET images were normalized using the in-house adult control template and statistics was compared each of the 47 pediatric patients to this adult control group; (2) SPM-P, PET images were normalized using the same in-house pediatric template as for group I and was statistics compared each of the 47 pediatric patients to the pseudo-control group (n = 24).
Based on the true hypometabolic clusters and the hypometabolic artifacts on SPM, we determined the sensitivity, the specificity, and the predictive value of SPM-A and SPM-P analyses to detect significant hypo-metabolic areas when compared to a standard includ-ing visual analysis and clinical relevance. Sensitivity and specificity were compared between SPM-A and SPM-P using McNemar’s test.
Concordance between analysis procedures
It was assessed using the kappa test. The three proce-dures (visual, SPM-P, and SPM-A) were considered con-cordant when they were all negative or when the most intense hypometabolic area on visual analysis corre-sponded to the most significant hypometabolic cluster on SPM analyses. Concordance was complete when the number of hypometabolic regions involved was similar
within the three procedures, otherwise it was partial. The procedures were considered discordant in the other conditions, i.e., when one of them did not disclose any metabolic abnormality that the two others did. We stud-ied between-procedure concordance in the whole popu-lation of patients (group II) and in cryptogenic versus symptomatic ones.
Results
Visual analysis
First visual analysis found a concordance between both experts for 61 children (86%) (kappa = 0.8113, p < 0.05); 28 of them had no abnormality, and the remaining 33 had at least one hypometabolic area. The extent, loca-tion, and intensity of hypometabolic areas were also concordant between both experts. In nine other chil-dren, discordances involved mild to moderate hypome-tabolism: as a result, they were differently classified as having either no or unilateral lobar hypometabolism (five cases) and either unilateral or bilateral hypometa-bolism (four cases). In only one remaining child, the expert’s findings were totally discordant (right lobar against left multilobar).
After a second visual analysis of the discordant cases, a consensus was reached: finally there were 30 children without any hypometabolism (negative/normal PET) [27 with negative MRI, the three others having either a white matter ischemic lesion (two cases) or an unusual pattern of the precentral gyrus (one case)] and 41 chil-dren (58%) with at least one hypometabolic area (positive/abnormal PET) (Figure 1). This rate reached 87% in the patient group. Extent of hypometabolism was unilateral lobar in 18 cases, unilateral multilobar in 14, hemispheric or bilateral in 9. Among the 470 regions analyzed (10 regions in 47 patients), 86 (18%) were hypometabolic, and the intensity was more often severe (64/86) than moderate (22/86). The most frequent loca-tion was temporal due to the high frequency of temporal involvement in the multilobar hypometabolic areas (Figure 2).
Among the 86 detected hypometabolic regions, 48 (56%) were concordant with the SOZ (25 in sympto-matics, 23 in cryptogenics): 32 (37%) of them were superimposed with SOZ (half were temporal) and 16 others (19%) were more extended than SOZ and involved adjacent cortical areas. In 19/86 regions (22%), the location of visual hypometabolism was different from the supposed location of the SOZ (four in symp-tomatics, 15 in cryptogenics). In the remaining 19 regions (22%), either the SOZ location was undeter-mined (nine regions in 2 patients) or was bilateral with a contralateral hypometabolism (ten regions in 6 patients).
Archambaudet al. EJNMMI Research 2013, 3:2 Page 5 of 10 http://www.ejnmmires.com/content/3/1/2
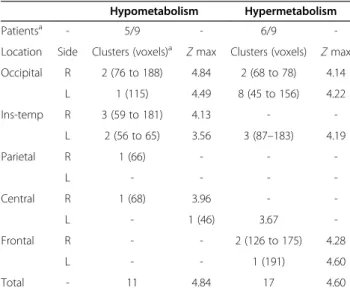
SPM analysis of the pseudo-control group (group I) Among the 24 children retained within this group, SPM-P analysis was completely negative in 15. Artifacts were found in the nine remaining children, but they were small (less than 200 voxels) and disseminated on the whole cor-tex (Table 2). By contrast, in the three additional children transferred from group I to group II because their PET
images were found abnormal at SPM-step analysis and the artifacts included more than 400 voxels (1 child with one hypo-, 1 other child with one hyper-, and 1 with several hypo- and hypermetabolic clusters respectively).
SPM analyses of the patient group (group II)
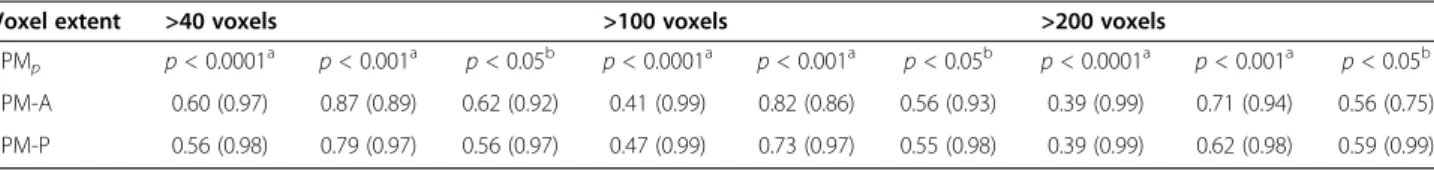
Among the three p value thresholds tested, the best com-promise between sensitivity and specificity was obtained for p < 0.001 for both SPM-A and SPM-P analyses (Table 3). Among the 3 voxel extents tested, the best com-promise between sensitivity and specificity at p < 0.001 was obtained for 40 voxels for both SPM-A and SPM-P analyses (Table 3). These two thresholds were therefore selected for the following results.
SPM-A analysis found significant hypometabolic clus-ters in 120 (25%) out of the 470 cortical regions studied: 78/120 (65%) corresponded to true hypometabolic clus-ters (74 were concordant with visual analysis; for the remaining four, the hypometabolic cluster was clinically relevant although visually normal) and the remaining 42 were hypometabolic artifacts. By contrast, SPM-A failed to detect any hypometabolic cluster in 12 regions which were hypometabolic on visual analysis. As a result, our SPM-A procedure had a sensitivity of 87%, specificity of 89%, positive predictive value of 65%, and negative pre-dictive value of 95%.
SPM-P analysis found significant hypometabolic clusters in 83 (18%) out of the 470 cortical regions studied: 71/83 (86%) corresponded to true hypometabolic clusters (68 were concordant to visual analysis, the remaining three were visually normal but clinically relevant), and the remaining 12 were hypometabolic artifacts. By contrast, SPM-P failed to detect any hypometabolic cluster in 19 regions which were hypometabolic on visual analysis. As a result, our SPM-P procedure had a sensitivity of 79%, spe-cificity of 97%, positive predictive value of 86%, and a negative predictive value of 95%.
Sensitivity was moderately better using SPM-A than SPM-P (p = 0.039, Mac Nemar test). By contrast, specifi-city was dramatically higher using SPM-P than SPM-A (p < 0.0001). This was due to the higher positive predict-ive value using SPM-P, which markedly reduced the number of hypometabolic artifact detected, whereas the negative predictive value was equivalent using both pro-cedures. Comparing SPM-A and SPM-P procedures, the number of artifacts tended to be less in younger children (especially under 6 years of age) using SPM-P (Figure 3). Additional artifacts were found within the interhemi-spheric fissure: 13 when using SPM-A, of which only 4 persisting when using SPM-P.
Artifacts did not result exclusively from the normalization procedure; the age-related changes may also play a role. In-deed, artifacts did not disappear when analyzing pediatric patients using the adult control group normalized with the
Figure 2 Cortical location of the hypometabolic areas. X axis presents the number of hypometabolic areas using visual analysis (n = 86) and of hypometabolic clusters (true hypometabolic areas and artifacts) using SPM-P (n = 83) and SPM-A (n = 120), according to their regional location on the cortex: F, frontal; C, central or opercular; P, parietal; T, temporal or insular; O, occipital. Y axis presents the number of hypometabolic areas among the 470 regions visually analyzed (47 patients, ten regions/patient). Notice that visual analysis is equal or superior to SPM to identify a hypometabolic area in any region, and both SPM procedures are quite equivalent to identify a true hypometabolic cluster in any region, but SPM-A identifies more artifacts than SPM-P, particularly in the frontal and temporal cortices, the most frequent
hypometabolic locations.
Table 2 Artifact localization in nine patients from group I (pediatric pseudo-control group,n = 24) using SPM-P procedure
Hypometabolism Hypermetabolism Patientsa - 5/9 - 6/9 -Location Side Clusters (voxels)a Z max Clusters (voxels) Z max Occipital R 2 (76 to 188) 4.84 2 (68 to 78) 4.14 L 1 (115) 4.49 8 (45 to 156) 4.22 Ins-temp R 3 (59 to 181) 4.13 - -L 2 (56 to 65) 3.56 3 (87–183) 4.19 Parietal R 1 (66) - - -L - - - -Central R 1 (68) 3.96 - -L - 1 (46) 3.67 -Frontal R - - 2 (126 to 175) 4.28 L - - 1 (191) 4.60 Total - 11 4.84 17 4.60 a
pediatric template; their number decreased when compared to SPM-A procedure, but increased compared to SPM-P. Concordance of analysis procedures
Visual analysis, SPM-P and SPM-A were concordant in 36 patients (77%), being all negative in 3 of them, and positive in the remaining 33 (80% of the 41 patients with positive visual analysis) (Table 4). Concordance was complete in 28/33 (68%), with the most significant true hypometabolic cluster on SPM having the same lobar and intra-lobar location and including the same number of regions whatever the method of analysis (Figure 4). Concordance was partial in the remaining five patients, with more hypometabolic regions detected with visual analysis in four and with SPM in one. Visual analysis, SPM-P, and SPM-A were discordant in the remaining 11 patients (23%). In two cases both SPM procedures dis-closed the same true hypometabolic cluster, but visual
analysis was negative. In nine cases SPM-P did not de-tect any abnormality whereas visual analysis, SPM-A, or both did in respectively 3, 1, and 5 cases with the same localization. Finally, kappa test gave a significant con-cordance of 0.448 ± 0.084 (p < 0.005) between the three analysis procedures, 0.598 ± 0.140 (p < 0.005) between both SPM methods, and 0.427 ± 0.194 (p < 0.005) or 0.330 ± 0.158 (p = 0.007) between visual analysis and re-spectively, SPM-A or SPM-P.
Regarding the 20 MRI-positive patients, the three proce-dures were concordant in 18 (90%) (kappa = 0.739 ± 0.129; p< 0.005), being all positive in 16 and all negative in two, and they were discordant in the remaining two with nega-tive SPM-P. Concordance between visual analysis and SPM procedure reached 0.773 ± 0.216 (p < 0.005) for SPM-A and 0.828 ± 0.166 (p < 0.005) for SPM-P. Regarding the 27 MRI-negative patients, the three procedures were concord-ant in 18 (67%) (kappa = 0.264 ± 0.111; p < 0.01), being all Table 3 Sensitivity and (specificity) of SPM-A and SPM-P analysis using the different thresholds
Voxel extent >40 voxels >100 voxels >200 voxels SPMp p < 0.0001 a p < 0.001a p < 0.05b p < 0.0001a p < 0.001a p < 0.05b p < 0.0001a p < 0.001a p < 0.05b SPM-A 0.60 (0.97) 0.87 (0.89) 0.62 (0.92) 0.41 (0.99) 0.82 (0.86) 0.56 (0.93) 0.39 (0.99) 0.71 (0.94) 0.56 (0.75) SPM-P 0.56 (0.98) 0.79 (0.97) 0.56 (0.97) 0.47 (0.99) 0.73 (0.97) 0.55 (0.98) 0.39 (0.99) 0.62 (0.98) 0.59 (0.99) a Uncorrected;b corrected.
Figure 3 Hypometabolic artifacts observed in patient group using SPM-A and SPM-P analysis. Hypometabolic artifacts observed in patient group (n = 47) using SPM-A analysis (adult control group) and SPM-P analysis (pediatric pseudo-control group). X axis presents the ages (in years). Y axis presents the number of hypometabolic artifacts (false positive results) using SPM-A (lozenges) and SPM-P (circles) analysis. The broken line represents the number of patients at the different ages. Notice that artifacts are observed less frequently using SPM-P than SPM-A, and none was found in patients under 6 years old using SPM-P.
Archambaudet al. EJNMMI Research 2013, 3:2 Page 7 of 10 http://www.ejnmmires.com/content/3/1/2
positive in 17 and all negative in one, and they were dis-cordant in the remaining nine with negative SPM-P in seven of them. Concordance between visual analysis and SPM procedures did not reach significance.
Discussion
The goal of this study was to evaluate the performances of SPM analysis of FDG-PET in children using an age-matched pseudo-control group of epileptic patients with robustly negative imaging versus classical healthy young adult controls. Both SPM analyses achieve a similar rate of detection of hypometabolic clusters and perform as well as visual analysis, not only in MRI-positive patients but also in MRI-negative ones. Although the sensitivity of SPM is not increased using pediatric vs. adult controls (79% vs. 87%), specificity is increased (97% vs. 89%) due to the reduction of the number of hypometabolic arti-facts detected. As a result the positive predictive value of the method rises from 65% to 86%. That provides a rele-vant clinical impact especially in the younger children.
Visual inspection of FDG-PET images is extensively used in clinical epilepsy practice and remains the reference
method of analysis in children [14,27]. The hypometabolic areas detected have been proved to include the seizure onset zone, although they usually are more extended and do not delineate it [6,8]. The localizing value of visual PET analysis varies from 36% to 73% in extratemporal cases, depending whether MRI is negative or not [9,20], and reaches 90% exclusively in temporal lobe cases [26]. This detection value can be improved, particularly in extratem-poral epilepsy with negative MRI, using PET/MRI coregis-tration [12,13]. That has been confirmed by intracranial EEG and post-operative data. The present 56% detection rate of relevant hypometabolic areas is therefore in ac-cordance with the literature, if one considers that we did not use coregistration and that the series mostly comprises MRI-negative patients and children with extratemporal epilepsy. In addition, the ability to detect a hypometabolic area visually is subjective and depends on the expertise and experience of the observer. Most reported series tend to limit this bias by achieving a consensus between closely performing readers, as we presently did with a first con-cordance of 0.81.
By contrast, SPM analysis is observer independent [1,2]. Taking the whole brain into account, it allows assessing the spatial extent and location of the abnormal site on the brain map with no a priori hypothesis. Ini-tially dedicated to the comparison of data sets among groups of subjects, SPM method also proved to be reli-able for quantitative analysis of individual FDG-PET scans in various neurological disorders, including epi-lepsy [37]. SPM analysis has been widely applied to the study of adults with epilepsy, with thresholds varying from p < 0.001 (uncorrected) to p < 0.05 (corrected) and >20 voxels to >250 voxels [5,7]. Since SPM showed com-parable sensitivity to visual assessment, it is considered
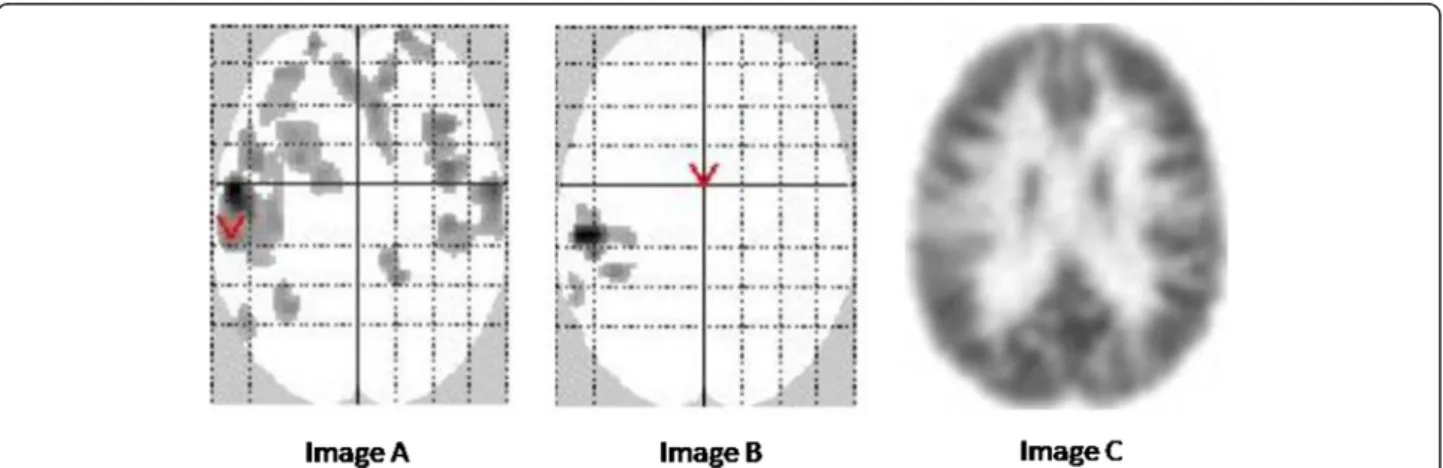
Figure 4 Comparative results using SPM-A, SPM-P, and visual analyses. Comparative results using SPM-A (adult control group), SPM-P (pediatric pseudo-control group) and visual analyses in a 4 year old patient. In this 4-year-old patient with positive MRI and seizure onset zone (SOZ) in the left insula, visual analysis (image C) shows a left insular hypometabolic area (axial slice). SPM-P (image B, SPM glass brain) identifies a hypometabolic cluster in the same area. SPM-A (image A, SPM glass brain) also identifies this cluster, but also shows several additional
hypometabolic artifacts mainly located within the frontal cortex, ipsi- and contralaterally.
Table 4 Patients with at least one true hypometabolism using visual, SPM-P, and SPM-A analysis
Visual analysis SPM-P SPM-A Positive Negative Positive Positive 33 (17C, 16S) 2 (2C, 0S) Negative Positive 5 (4C, 1S) 1 (0C, 1S) Negative 3 (3C, 0S) 3 (1C, 2S) Total 41 (24C, 17S) 6 (3C, 3S)
SPM-P, SPM analysis using the pediatric pseudo-control group; SPM-A, SPM analysis using the adult control group; C, cryptogenic (MRI-negative) patients; S, symptomatic (MRI-positive) patients.
as an aid in diagnosing seizure onset zones in temporal as well as in extratemporal lobe epilepsy and in lesional as well as in non-lesional cases [5,7,12,15,16,38].
In children, experience with SPM in epilepsy is more limited. Only one study formally assessed the role of stat-istical threshold on sensitivity and specificity [27]: they found p < 0.001 as the best compromise, as we presently do. Based on young adults as controls, the results are not univocal. De Tiege et al. did succeed detecting areas of re-mote inhibition in children aged 5 to 11 years with a par-ticular epileptic encephalopathy and to see them vanish when epilepsy and cognitive deficits recover [24,39,40]. Some authors showed a high SPM performance (86%) for correct localization of the seizure onset zone in adoles-cents (12 to 15 years) [26], but others achieved a rate of only 13% in children from the age of 3 [14]. In another series, the same procedure gave an SPM sensitivity of 74% in children over 6 years old [27], whereas it failed in chil-dren under 6 years of age due to a significant proportion of artifacts [23]. We also found a high number of such false positive hypometabolic clusters when using an adult template, at a threshold stringent for such an individual SPM analysis [12]. One main issue is the different sizes of the head of adults and young children [23]. We confirm here that this artifact rate is higher in the younger ages and can be reduced by using a pediatric template [36]. An-other potential advantage of a pseudo-normal epilepsy group could be that the potential effect of the antiepileptic drugs is largely cancelled out since both the patients and the control groups were on antiepileptic medication [35]. To generate even better templates, one could speculate on data from other pathologies that justify whole-body PET scanning but may respect the brain, like pediatric lymph-oma, for example [41].
In order to deal with the pediatric controls the closest to “normals”, we confirmed PET negativity using the Signorini’s method [37]: each data set of the pseudo-control group was compared to the rest of the group using SPM. The complete procedure excluded three additional children. Our main result is a gain of specifi-city and this pediatric procedure reaches the highest rates ever reported in epilepsy for SPM. Conversely, the predictive positive value is improved, thus decreasing the number of artifacts and optimizing the clinical rele-vance of SPM analysis compared to the classical adult procedure. We assume that these advantages of pediatric SPM can compensate the slightly decreased sensitivity compared to adult SPM (79% vs. 87%). Note that these rates of sensitivity and specificity apply to SPM analysis and not to FDG-PET in general, since we excluded from their calculation the major part of negative cases. Never-theless, this method was robustly able to identify some clinically relevant hypometabolic areas missed by visual analysis in 6% of cases.
Although our template presents with the usual balance of specificity versus sensitivity, we recently showed the whole procedure to be beneficial also in multifocal child-hood epilepsy when visual PET analysis fails to detect bi-lateral abnormalities, as in school-age children with a fever-induced epileptic encephalopathy [42].
Conclusion
Such a pediatric SPM procedure is a way to optimize SPM analysis of FDG-PET in children with epilepsy, use-ful for clinical purpose and for research. It might also be considered for other brain pathologies in pediatrics in the future.
Statement
Authors propose to make their pseudo-control pediatric group available to the neuroscientific community, free, according to a statement of agreement with the CEA regarding the context of use for their data basis.
Competing interests
The authors declare that they have no competing interest. Authors’ contributions
FA performed most of the PET examinations, the visual analysis, the SPM analysis, coordinated the results and contributed to draft the manuscript. VB performed some PET examinations, participated in its design and helped to draft the manuscript. LHP read MRI examinations. PCR performed the statistical analyses. SR participated in the design of the study. OD followed and referred the patients and extensively reviewed the manuscript. FC performed PET visual analysis and reviewed the manuscript. CC conceived the study design and drafted the manuscript. All authors read and approved the final manuscript.
Acknowledgments
This work was supported by a grant provided by the Fondation pour la Recherche sur le Cerveau (FRC).
Author details
1Inserm, U663, Service de Neurologie et Métabolisme, Hôpital Necker, 149
rue de Sèvres, Paris 75015, France.2University Paris Descartes, Paris 75005,
France.3CEA, I2BM, Service Hospitalier Frédéric Joliot, Orsay Cedex 91401,
France.4IFR 49 (Institut Federatif de Recherche), Gif sur Yvette Cedex 91191,
France.5Assistance Publique-Hôpitaux de Paris (AP-HP), Service de
Biophysique et Médecine Nucleaire, Hôpital le Kremlin Bicêtre, Paris 94275, France.6AP-HP, Service de Neuropédiatrie, Hôpital Necker, Paris 75015,
France.7Service de Neurochirurgie, Hôpital Sainte Anne, Paris 75014, France.
Received: 29 October 2012 Accepted: 27 December 2012 Published: 4 January 2013
References
1. Friston KJ, Frith CD, Liddle PF, Dolan RJ, Lammertsma AA, Frackowiak RS: The relationship between global and local changes in PET scans. J Cereb Blood Flow Metab 1990, 10(4):458–466.
2. Friston KJ, Frith CD, Liddle PF, Frackowiak RS: Comparing functional (PET) images: the assessment of significant change. J Cereb Blood Flow Metab 1991, 11(4):690–699.
3. Casse R, Rowe CC, Newton M, Berlangieri SU, Scott AM: Positron emission tomography and epilepsy. Mol Imaging Biol 2002, 4(5):338–351. 4. Ollenberger GP, Byrne AJ, Berlangieri SU, Rowe CC, Pathmaraj K, Reutens
DC, Berkovic SF, Scheffer IE, Scott AM: Assessment of the role of FDG PET in the diagnosis and management of children with refractory epilepsy. Eur J Nucl Med Mol Imaging 2005, 32(11):1311–1316.
Archambaudet al. EJNMMI Research 2013, 3:2 Page 9 of 10 http://www.ejnmmires.com/content/3/1/2
5. Chassoux F, Semah F, Bouilleret V, Landre E, Devaux B, Turak B, Nataf F, Roux FX: Metabolic changes and electro-clinical patterns in mesio-temporal lobe epilepsy: a correlative study. Brain 2004, 127(Pt 1):164–174. 6. Juhász C, Chugani DC, Muzik O, Shah A, Shah J, Watson C, Canady A,
Chugani HT: Relationship of flumazenil and glucose PET abnormalities to neocortical epilepsy surgery outcome. Neurology 2001, 56(12):1650–1658. 7. Wong CH, Bleasel A, Wen L, Eberl S, Byth K, Fulham M, Somerville E,
Mohamed A: The topography and significance of extratemporal hypometabolism in refractory mesial temporal lobe epilepsy examined by FDG-PET. Epilepsia 2010, 51(8):1365–1373.
8. Juhász C, Chugani DC, Muzik O, Watson C, Shah J, Shah A, Chugani HT: Is epileptogenic cortex truly hypometabolic on interictal positron emission tomography? Ann Neurol 2000, 48(1):88–96.
9. Lee JJ, Lee SK, Lee SY, Park KI, Kim DW, Lee DS, Chung CK, Nam HW: Frontal lobe epilepsy: clinical characteristics, surgical outcomes and diagnostic modalities. Seizure 2008, 17(6):514–523.
10. Kim JT, Bai SJ, Choi KO, Lee YJ, Park HJ, Kim DS, Kim HD, Lee JS: Comparison of various imaging modalities in localization of epileptogenic lesion using epilepsy surgery outcome in pediatric patients. Seizure 2009, 18(7):504–510.
11. Lee SK, Lee SY, Kim KK, Hong KS, Lee DS, Chung CK: Surgical outcome and prognostic factors of cryptogenic neocortical epilepsy. Ann Neurol 2005, 58(4):525–532.
12. Chassoux F, Rodrigo S, Semah F, Beuvon F, Landre E, Devaux B, Turak B, Mellerio C, Meder JF, Roux FX, Daumas-Duport C, Merlet P, Dulac O, Chiron C: FDG-PET improves surgical outcome in negative MRI Taylor-type focal cortical dysplasias. Neurology 2010, 75(24):2168–2175.
13. Salamon N, Kung J, Shaw SJ, Koo J, Koh S, Wu JY, Lerner JT, Sankar R, Shields WD, Engel J Jr, Fried I, Miyata H, Yong WH, Vinters HV, Mathern GW: FDG-PET/MRI coregistration improves detection of cortical dysplasia in patients with epilepsy. Neurology 2008, 71(20):1594–1601.
14. Seo JH, Holland K, Rose D, Rozhkov L, Fujiwara H, Byars A, Arthur T, DeGrauw T, Leach JL, Gelfand MJ, Miles L, Mangano FT, Horn P, Lee KH: Multimodality imaging in the surgical treatment of children with nonlesional epilepsy. Neurology 2011, 76(1):41–48.
15. Van Bogaert P, Massager N, Tugendhaft P, Wikler D, Damhaut P, Levivier M, Brotchi J, Goldman S: Statistical parametric mapping of regional glucose metabolism in mesial temporal lobe epilepsy. NeuroImage 2000, 12(2):129–138.
16. Bouilleret V, Valenti MP, Hirsch E, Semah F, Namer IJ: Correlation between PET and SISCOM in temporal lobe epilepsy. J Nucl Med 2002, 43(8):991–998.
17. Kim YK, Lee DS, Lee SK, Kim SK, Chung CK, Chang KH, Choi KY, Chung JK, Lee MC: Differential features of metabolic abnormalities between medial and lateral temporal lobe epilepsy: quantitative analysis of (18)F-FDG PET using SPM. J Nucl Med 2003, 44(7):1006–1012.
18. Carne RP, Cook MJ, MacGregor LR, Kilpatrick CJ, Hicks RJ, O'Brien TJ: "Magnetic resonance imaging negative positron emission tomography positive" temporal lobe epilepsy: FDG-PET pattern differs from mesial temporal lobe epilepsy. Mol Imaging Biol 2007, 9(1):32–42.
19. Ohta Y, Nariai T, Ishii K, Ishiwata K, Mishina M, Senda M, Hirakawa K, Ohno K: Voxel- and ROI-based statistical analyses of PET parameters for guidance in the surgical treatment of intractable mesial temporal lobe epilepsy. Ann Nucl Med 2008, 22(6):495–503.
20. Kim YK, Lee DS, Lee SK, Chung CK, Lee MC: (18)F-FDG PET in localization of frontal lobe epilepsy: comparison of visual and SPM analysis. J Nucl Med 2002, 43(9):1167–1174.
21. Plotkin M, Amthauer H, Merschhemke M, Lüdemann L, Hartkop E, Ruf J, Gutberlet M, Bertram H, Meencke HJ, Felix R, Venz S: Use of statistical parametric mapping of (18) F-FDG-PET in frontal lobe epilepsy. Nuklearmedizin 2003, 42(5):190–196.
22. Van Bogaert P, David P, Gillain CA, Wikler D, Damhaut P, Scalais E, Nuttin C, Wetzburger C, Szliwowski HB, Metens T, Goldman S: Perisylvian dysgenesis. Clinical, EEG, MRI and glucose metabolism features in 10 patients. Brain 1998, 121(Pt 12):2229–2238.
23. Muzik O, Chugani DC, Juhasz C, Shen C, Chugani HT: Statistical parametric mapping: assessment of application in children. NeuroImage 2000, 12(5):538–549.
24. De Tiège X, Goldman S, Laureys S, Verheulpen D, Chiron C, Wetzburger C, Paquier P, Chaigne D, Poznanski N, Jambaqué I, Hirsch E, Dulac O, Van
Bogaert P: Regional cerebral glucose metabolism in epilepsies with continuous spikes and waves during sleep. Neurology 2004, 63(5):853–857. 25. Korinthenberg R, Bauer-Scheid C, Burkart P, Martens-Le BH, Kassubek J,
Juengling FD: 18FDG-PET in epilepsies of infantile onset with pharmacoresistant generalised tonic-clonic seizures. Epilepsy Res 2004, 60(1):53–61.
26. Lee JJ, Kang WJ, Lee DS, Lee JS, Hwang H, Kim KJ, Hwang YS, Chung JK, Lee MC: Diagnostic performance of 18F-FDG PET and ictal 99mTc-HMPAO SPET in pediatric temporal lobe epilepsy: quantitative analysis by statistical parametric mapping, statistical probabilistic anatomical map, and subtraction ictal SPET. Seizure 2005, 14(3):213–220.
27. Kumar A, Juhasz C, Asano E, Sood S, Muzik O, Chugani HT: Objective detection of epileptic foci by 18F-FDG PET in children undergoing epilepsy surgery. J Nucl Med 2010, 51(12):1901–1907.
28. Chugani HT, Phelps ME, Mazziotta JC: Positron emission tomography study of human brain functional development. Ann Neurol 1987, 22(4):487–497.
29. van Bogaert P, Wikler D, Damhaut P, Szliwowski HB, Goldman S: Regional changes in glucose metabolism during brain development from the age of 6 years. NeuroImage 1998, 8(1):62–68.
30. Ernst M: PET in child psychiatry: the risks and benefits of studying normal healthy children. Prog Neuropsychopharmacol Biol Psychiatry 1999, 23(4):561–570.
31. Alkonyi B, Chugani HT, Behen M, Halverson S, Helder E, Makki MI, Juhász C: The role of the thalamus in neuro-cognitive dysfunction in early unilateral hemispheric injury: a multimodality imaging study of children with Sturge-Weber syndrome. Eur J Paediatr Neurol 2010, 14(5):425–433. 32. Zilbovicius M, Boddaert N, Belin P, Poline JB, Remy P, Mangin JF, Thivard L,
Barthélémy C, Samson Y: Temporal lobe dysfunction in childhood autism: a PET study. Positron emission tomography. Am J Psychiatry 2000, 157(12):1988–1993.
33. Juhasz C, Behen ME, Muzik O, Chugani DC, Chugani HT: Bilateral medial prefrontal and temporal neocortical hypometabolism in children with epilepsy and aggression. Epilepsia 2001, 42(8):991–1001.
34. Van Bogaert P, Wikler D, Damhaut P, Szliwowski HB, Goldman S: Cerebral glucose metabolism and centrotemporal spikes. Epilepsy Res 1998, 29(2):123–127.
35. Theodore WH: Antiepileptic drugs and cerebral glucose metabolism. Epilepsia 1988, 29(Suppl 2):S48–S55.
36. Santiago-Ribeiro M, Delzescaux T, Leroy C, Cachia A, Chiron C, Trebossen R: Validation for a 18F-FDG SPM template for pediatric brain [abstract]. J Nucl Med 2008, 4:s231.
37. Signorini M, Paulesu E, Friston K, Perani D, Colleluori A, Lucignani G, Grassi F, Bettinardi V, Frackowiak RS, Fazio F: Rapid assessment of regional cerebral metabolic abnormalities in single subjects with quantitative and nonquantitative [18F]FDG PET: a clinical validation of statistical parametric mapping. NeuroImage 1999, 9(1):63–80.
38. Kim MA, Heo K, Choo MK, Cho JH, Park SC, Lee JD, Yun M, Park HJ, Lee BI: Relationship between bilateral temporal hypometabolism and EEG findings for mesial temporal lobe epilepsy: analysis of 18F-FDG PET using SPM. Seizure 2006, 15(1):56–63.
39. De Tiege X, Ligot N, Goldman S, Poznanski N, de Saint MA, Van Bogaert P: Metabolic evidence for remote inhibition in epilepsies with continuous spike-waves during sleep. NeuroImage 2008, 40(2):802–810.
40. De Tiege X, Goldman S, Van Bogaert P: Insights into the pathophysiology of psychomotor regression in CSWS syndromes from FDG-PET and EEG-fMRI. Epilepsia 2009, 50(Suppl 7):47–50.
41. Riad R, Omar W, Kotb M, Hafez M, Sidhom I, Zamzam M, Zaky I, Abdel-Dayem H: Role of PET/CT in malignant pediatric lymphoma. Eur J Nucl Med Mol Imaging 2010, 37(2):319–329.
42. Mazzuca M, Jambaque I, Hertz-Pannier L, Bouilleret V, Archambaud F, Caviness V, Rodrigo S, Dulac O, Chiron C: 18F-FDG PET reveals frontotemporal dysfunction in children with fever-induced refractory epileptic encephalopathy. J Nucl Med 2011, 52(1):40–47.
doi:10.1186/2191-219X-3-2
Cite this article as: Archambaud et al.: Optimizing statistical parametric mapping analysis of18F-FDG PET in children. EJNMMI Research 2013 3:2.