HAL Id: hal-00298225
https://hal.archives-ouvertes.fr/hal-00298225
Submitted on 9 Jun 2008HAL is a multi-disciplinary open access
archive for the deposit and dissemination of sci-entific research documents, whether they are pub-lished or not. The documents may come from teaching and research institutions in France or abroad, or from public or private research centers.
L’archive ouverte pluridisciplinaire HAL, est destinée au dépôt et à la diffusion de documents scientifiques de niveau recherche, publiés ou non, émanant des établissements d’enseignement et de recherche français ou étrangers, des laboratoires publics ou privés.
Winter temperatures in the second half of the XVI
century in the central area of the Iberian Peninsula
T. Bullón
To cite this version:
T. Bullón. Winter temperatures in the second half of the XVI century in the central area of the Iberian Peninsula. Climate of the Past Discussions, European Geosciences Union (EGU), 2008, 4 (3), pp.697-718. �hal-00298225�
CPD
4, 697–718, 2008 Temperatures in central Iberian Peninsula T. Bull ´on Title Page Abstract Introduction Conclusions References Tables Figures ◭ ◮ ◭ ◮ Back CloseFull Screen / Esc
Printer-friendly Version Interactive Discussion
Clim. Past Discuss., 4, 697–718, 2008 www.clim-past-discuss.net/4/697/2008/
© Author(s) 2008. This work is distributed under the Creative Commons Attribution 3.0 License.
Climate of the Past Discussions
Climate of the Past Discussions is the access reviewed discussion forum of Climate of the Past
Winter temperatures in the second half of
the XVI century in the central area of the
Iberian Peninsula
T. Bull ´on
Departamento de Geograf´ıa, Universidad Aut ´onoma de Madrid, Spain Received: 20 May 2008 – Accepted: 24 May 2008 – Published: 9 June 2008 Correspondence to: T. Bull ´on ([email protected])
CPD
4, 697–718, 2008 Temperatures in central Iberian Peninsula T. Bull ´on Title Page Abstract Introduction Conclusions References Tables Figures ◭ ◮ ◭ ◮ Back CloseFull Screen / Esc
Printer-friendly Version Interactive Discussion
Abstract
This paper studies the winter temperatures of the second part of the XVI century in the central area of the Iberian Peninsula. A large number of historical documents that are stored in many different Spanish archives were consulted in order to carry out this research. The data was first arranged and weighted according to the intensity
5
and significance of the meteorological phenomena described and, subsequently, these values were assigned an ordinal index ranging from + 4 to −4. The statistical treatment applied is based on the reconstruction of temperatures equivalent to this ordinal index, expressed as anomalies of the 1961–1990 period, belonging to a reference station located at the approximate geographical center of the area under study. The results
10
show winter thermal conditions different from current ones that, for the most part, stay below the reference average and that occurred with a wide range of variability. The influence that thermal conditions had on the evolution of some environmental aspects are considered based on the forest exploitation problem information and on the wine harvest production.
15
1 Introduction
The winter temperature conditions of the central region of the Iberian Peninsula as described in diverse historical documents are analysed in this work. The chronological period covers the second half of the XVI century, a time when a large number of events related to cold weather conditions were recorded. These low temperatures could have
20
been caused by the climatic oscillation known as the Little Ice Age.
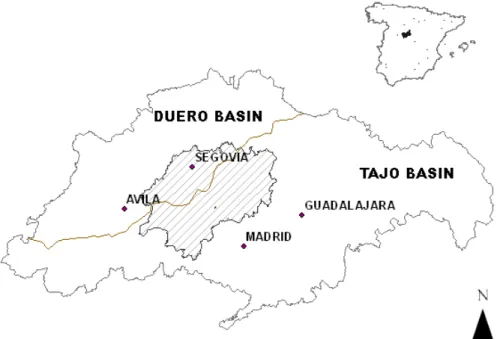
The documents used to gather the information are all located within a 6000 km2area in the Guadarrama Mountain Range, a part of the Central Iberian System in the center of the Iberian Peninsula (Fig. 1). It is made up of a set of aligned NE-SW ridges and valleys with gently sloping piedmonts to the NW and SE. At the end of the XVI
cen-25
CPD
4, 697–718, 2008 Temperatures in central Iberian Peninsula T. Bull ´on Title Page Abstract Introduction Conclusions References Tables Figures ◭ ◮ ◭ ◮ Back CloseFull Screen / Esc
Printer-friendly Version Interactive Discussion
pyreanica, and Quecus ilex with large quantities of game and fish. The population,
concentrated in villages, cities and monasteries, was stable at that moment in history. There were several royal residences as well, since most of the territory was used by the Spanish kings for recreation. Land use did not undergo any significant changes and all the farming, forestry and livestock activities were strictly regulated.
5
1.1 Objectives and contextualization
The final aim of this research is to contribute to the body of knowledge about climate in the second half of the XVI century through the close reading and interpretation of original handwritten documents, which are kept in diverse archives. The specific tasks involved were: To 1) define the general winter temperature characteristics of the area
10
under study between 1550 and 1599. 2) Determine what were the temperature varia-tions of the time frame under study. 3) Discover the influence that these condivaria-tions had on the use of some natural resources.
Any data on significant weather, climate and environmental events recorded in the archives within the geographical area under study was used to carry out this research.
15
All the references are from original coetaneous sources. No secondary sources were considered although some previously published transcriptions were employed, see Fig. 2. Earlier papers (Bull ´on, 2006, 2008) reported an initial analysis and interpre-tation of the weather events referred to in the archives. This work furthers this research based on the conclusions of the previous reports. There are numerous studies on
20
similar themes, Bradley and Jones (1992), Bradley et al. (2003), Br ´azdil et al. (2005) are of particular interest on certain European zones, as well as Barriendos (2000), Creus (2000), Saz (2003), Creus et al. (2007) on some Spanish areas.
1.2 Gathering information and data arrangement
The archives and collections consulted belong to the Spanish crown, religious
institu-25
CPD
4, 697–718, 2008 Temperatures in central Iberian Peninsula T. Bull ´on Title Page Abstract Introduction Conclusions References Tables Figures ◭ ◮ ◭ ◮ Back CloseFull Screen / Esc
Printer-friendly Version Interactive Discussion
The data tends to appear in: 1) public documents e.g. monastery records, books of agreements, orders or royal dispositions that contain references to natural events when they result in damage to goods or persons. 2) Private correspondence where informal observations about many events, especially weather, are included. 3) Reports on the state of royal forests and game, usually addressed to the monarch, containing
5
references to weather and environment, which was vital to the justification of problems that occurred or actions that were taken. Frequently the same event is described in more than one documentary source. Often the results of the same event are reported in one source and its main characteristics are described in another.
The data obtained were: 1) Direct data, which gives explicit information about
me-10
teorological events. 2) Mixed data, associated with the direct data, which explain the consequences of the meteorological events and make it possible to evaluate their inten-sity. 3) Indirect data, which describe the consequences of meteorological phenomena, not the meteorological events themselves. The direct and mixed data were used if they were dated during the winter (December of the previous year, January and February).
15
The indirect data were used with the following restrictions: 1) The relation between the indirect and direct data is explicitly expressed in an entry in the database. 2) There is direct data for the same winter that the event recorded in the indirect data, although the information may not come from the same source. For most years there is direct and indirect data. The years with the most indirect data are also the years with the most
20
direct data. 30% of the data is direct, 49% is indirect and 21% is mixed.
2 Data transformation
The data gathered was given a value according to equivalence tables and weighted depending on the following criteria (Bull ´on, 2006): 1) The impact of the source, in or-der to balance any bias due to the style used in a given document. Monastery records
25
and other legal documents contain very concise descriptions of events, while personal letters or specific reports are much more detailed. 2) Analysis of the weather event
de-CPD
4, 697–718, 2008 Temperatures in central Iberian Peninsula T. Bull ´on Title Page Abstract Introduction Conclusions References Tables Figures ◭ ◮ ◭ ◮ Back CloseFull Screen / Esc
Printer-friendly Version Interactive Discussion
scribed and the geographic area where it occurred, given that it is a mountainous zone with notable differences in climate according to altitude and slope aspects. 3) Intensity of the event, taking into account the significance of what is described. 4) Translation of the objective damage or their most important consequences to meteorological terms.
Firstly, events that were indicative of low or very low temperatures, mainly ice and
5
snow storms, were taken into account and placed in the winter in which they occurred. Secondly, the sum of all the events by each year were calculated and computed as neg-ative number, which expresses the importance by year of the cold events during winter. Afterwards, events that indicated mild or warm winter temperatures were scored with a positive number using the established equivalence tables. The yearly total of both
10
sets provides the global classification of each winter, which has been called the Winter Cold Intensity (WCI), with a positive result in the case of winters with predominantly mild temperatures and a negative result in the case of winters with predominantly cold temperatures. A higher absolute value means greater cold or mildness of any given winter.
15
3 Temperature reconstruction
In order to compare the 1550–1590 WCI values with current winter values, the data from this series was transformed into anomalies of a 1961–1990 series. Br ´azdil et al. (2005), along with other methods, was used for the climate reconstruction of the series based on documentary evidence.
20
As there is no overlap between the documentary data and the current temperature series, the data could not be calibrated. However, the results presented here, obtained by means of statistical treatment, manage to extract plentiful information from the orig-inal data, that would otherwise have remained hidden with conventional qualitative analysis.
25
The reference series used is the mean winter monthly temperature from 1961 to 1990 (INM, 1996) from the Puerto de Navacerrada observatory, located at 1887 m,
CPD
4, 697–718, 2008 Temperatures in central Iberian Peninsula T. Bull ´on Title Page Abstract Introduction Conclusions References Tables Figures ◭ ◮ ◭ ◮ Back CloseFull Screen / Esc
Printer-friendly Version Interactive Discussion
40◦47′35′′latitude and 04◦00′40′′longitude, in the center of the area under study. The weather data from this station are considered of the highest quality (Nicol ´as et al., 1979).
The first step was to assign an ordinal index with a value between +4 and −4 both to the winter cold intensity series as well as to the reference series. Each of these
5
two series was first standardized and then the interval corresponding to each of the numerical values was established according to the proportional part of the range of the set of both series. The R2 obtained between each of the series and their respective indexes were higher than 0.9.
The ordinal index for the WIC were then transformed into temperatures, according
10
to the methodology proposed by, among others, Creus (2000) and Saz (2003) where the relation between the ordinal index (I) and the temperature (T ) corresponds to the equation I=f (T ).
The parameters of this equation are applied to the WIC to obtain a reconstruction the of the temperature in◦C (dependent variable) based on the ordinal index (independent
15
variable), see Table 1. To confirm the accuracy of the results, a similar reconstruction of a series with a different time sequence (1952–1960) from the same reference mete-orological station was used (Mart´ınez et al., 1984). The linear regression between the real temperatures and the reconstructed ones are statistically acceptable, R2=0.927 significance of <0.001, see Table 2.
20
The winter anomalies in the historical series appear with the X i −X (X i = annual winter temperature; X = reference series winter average) equation (Jones and Hulme, 1996). The Kolmogorov-Smirnov test confirms the normalcy of the series of anoma-lies with a significance of 0.03. The t-test for differences between means (t=4.33;
t99=2.64) allows us to reject the H0 similarity hypothesis between the reference and
25
the anomalies.
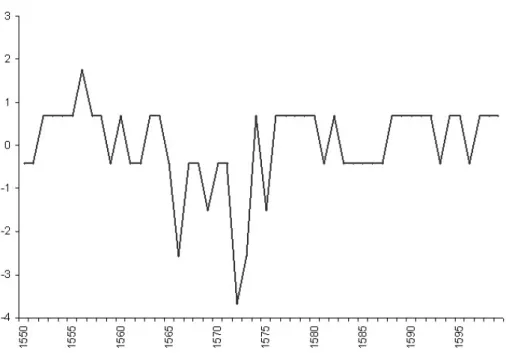
In the resulting standardized curve, see Fig. 3, the sharp drop that occurred between 1564 and 1575 can be clearly noted. The average of the series of anomalies is 1.21◦ below the reference series.
CPD
4, 697–718, 2008 Temperatures in central Iberian Peninsula T. Bull ´on Title Page Abstract Introduction Conclusions References Tables Figures ◭ ◮ ◭ ◮ Back CloseFull Screen / Esc
Printer-friendly Version Interactive Discussion
4 The variability of the historic series 1550–1599
Significant trends in the anomaly series were sought using the Mann-Kendall no para-metric test (Sneyers, 1975). This analysis was carried out according to the guide-lines established in variability studies of contemporary temperature in Spain, Gal ´an et al. (2003) and Rodrigo (2006).
5
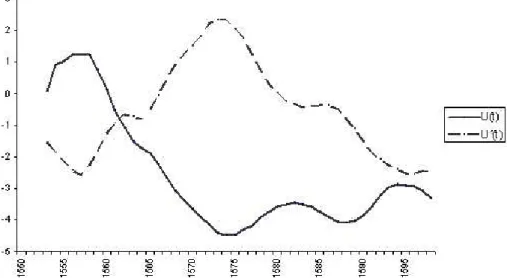
The graph that represents the sequential Mann-Kendall test, smoothed by a 3 years moving average, see Fig. 4, shows this series divided into two parts by the intersection of the normal and retrograde curves that appears in 1562. At this point the curves diverge and reach their maximum distance in 1575. After this point they approach the end of the series.
10
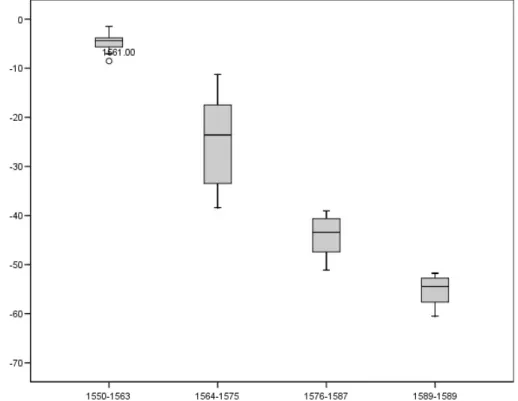
Similar contrasts can be noted in the cumulative standardized anomalies curve, see Fig. 5, where the most important slope changes indicate possible variations in the temperature trends. Applying Student’s t test of differences between means to the previously identified sequential subgroup pairs allows us to reject the H0hypothesis of similarity between means and accept that each one of them belongs to samples from
15
different populations, α≥99%.
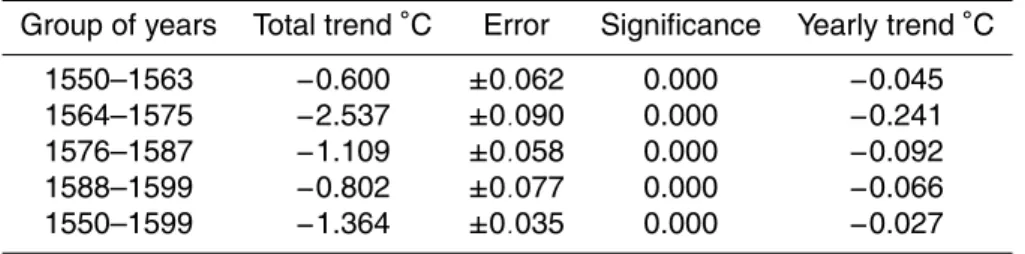
In order to quantify this tendency, linear regression models against time based on the cumulative anomalies series were used. The significance and margin of error of the results of these equations demonstrate that they have valid linear regression coefficients. The interpretation of these coefficients expresses the variations in the
20
temperature trend in relation to the reference mean.
The general evolution of the temperatures can be deduced from the analysis carried out: between 1550 and 1562 mild winters predominated, especially from 1554 to 1557. The temperatures during these years show a slight downward trend (−0.0451◦C/year). From 1564 to 1575 there is a more prolonged, continuous and significant descent
total-25
ing −2.537◦C (−0.241◦C/year), which became more moderate in the next period 1576– 1587, a −1.109◦C (−0.092◦C/year). Between 1588 and 1599 the trend is −0.802◦C (−0.066◦C/year). In short, the temperatures throughout the period from 1564–1599
CPD
4, 697–718, 2008 Temperatures in central Iberian Peninsula T. Bull ´on Title Page Abstract Introduction Conclusions References Tables Figures ◭ ◮ ◭ ◮ Back CloseFull Screen / Esc
Printer-friendly Version Interactive Discussion
remained below the reference level for most years with a global value of −1.364◦C (−0.027◦C/year), see Table 3.
These results agree with those of other authors such as Saz (2003) on paleoclimactic reconstructions based on dendrochronoly in the northern half of the Iberian peninsula, especially with those that refer to the Duero basin, the hydrographic area where an
5
important part of the sector under study is located. The gravity of the thermal drop in larger regions in the last third of the XVI century has been also cited by several authors as Bradley and Jones (1992) or Bradley el al. (2005), who state that this period in time coincides with one of the most sever climactic oscillations recorded during this particular climate change.
10
5 Influence of exploitation on natural resources
5.1 Forest resources
Based on a count of permits granting legal permission to cut bushes and forests, it has been proven that the intensity of forest product exploitation was directed related to winter temperature conditions: the colder the winter season, the more forest resources
15
were used (Bull ´on, 2006). Based on the standardized accumulated WCI series and annual number of permits granted to cut down forest products, a correlation coefficient was obtained of −0.859, (significance <0.001).
A large number of documents refer to a significant decrease in existing forest mass during the period. Data pertaining to this deterioration indicate the existence of excess,
20
and often illegal, logging as well as widespread impoverishment of timber mass. Deteri-oration in forest mass increased as of the second half of the 80s, after an accumulation of numerous years of cold temperatures.
Based on the data collected, vegetation growth was also shown to have had difficul-ties. The data focused on the limit of the timber line, which was then at a lower altitude
25
CPD
4, 697–718, 2008 Temperatures in central Iberian Peninsula T. Bull ´on Title Page Abstract Introduction Conclusions References Tables Figures ◭ ◮ ◭ ◮ Back CloseFull Screen / Esc
Printer-friendly Version Interactive Discussion
the northern section of the area under study. Those forests today are considered to be located at the natural limit of their biogeographic habitat (Blanco et al., 1997) due to the severe winters, which means it is logical to conclude that under winter conditions more severe than today’s, the deterioration shown in the documents would have oc-curred. Although forest mass deterioration could also be caused by periods of drought
5
or specific forest mass destruction, to date, the intensity of winter cold has shown the greatest connections to forest deterioration.
5.2 Agricultural production
Trends in the annual agricultural or livestock production were verified through their respective tithe payments in several towns and villages within the area under study.
10
Wine production was the most affected of them all by the changes detected in temper-atures. Although the series obtained covers only 22 years and the majority of those corresponding to the coldest years 1564–1575 are missing, the years with the lowest amount of wine production coincide with the most severe winters.
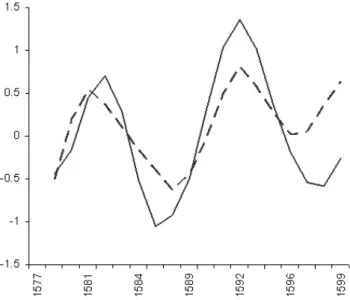
The cumulative standard curves for wine production and WCI show great similarity,
15
with a correlation coefficient of 0.608 (significance <0.001) (Fig. 6). Scant produc-tion years occurred between 1570 and 1577, and a 25% drop in harvests was shown, despite incomplete data, between 1582 and 1587, a 36% drop compared with the av-erage, and between 1992 and 1598 with a 19% production decrease. The cumulative production curve for wine is similar to the cumulative WCI curve, although
approxi-20
mately 20% more so in the most severe periods, while, in the warm years, the wine curve shows a steeper increase than the WCI one.
The first of the low production groups of years has been confirmed from a statistical perspective and is related to the most significant drop in temperatures. The second, occurred between 1582 and 1587, which has not been shown to be statistically
sig-25
nificant, was clearly marked in wine production, and the third, a bit milder than the previous one and barely noticeable on the WCI series, suggest the existence of cold winters between 1592 and 1598.
CPD
4, 697–718, 2008 Temperatures in central Iberian Peninsula T. Bull ´on Title Page Abstract Introduction Conclusions References Tables Figures ◭ ◮ ◭ ◮ Back CloseFull Screen / Esc
Printer-friendly Version Interactive Discussion
The influence of temperatures on wine production has been shown in various re-search studies (Lansteiner, 1999; Quiroga and Iglesias, 2005). The relation between winter temperatures and wine production may be a result of intense frosts in winter, which cause severe damage to the exposed parts of the plants. Phenological studies also show that late frost in spring may cause a significant decrease in production.
Al-5
though spring temperatures have not been analyzed in this study, these results may provide a basis for future research.
It should also be pointed out that the influence of cold winters on wine production may also have been greater than usual, given that the area where the data was collected has climate conditions unsuitable for grape cultivation, because they are located along
10
a mountainous area, which at present is the limit of Mediterranean crops.
6 Conclusions
The comparison of winter temperature data with a current reference series (1961– 1990) made it possible to define a thermal drop which occurred between 1550 and 1599 and to determine the internal variability of that time period. Although both series
15
include events of high cold intensity, what differentiates the series of anomalies from the reference series is the concentration of high intensity events in a limited number of consecutive years. According to data available for the years between 1563 and 1575, temperatures dropped −2.536◦C (−0.231◦C/year) with respect to the reference series average.
20
The series of anomalies are subdivided into these groups of years: 1550–1563, 1564–1575, 1576–1588 and 1589–1598. The drop in temperatures that occurred be-tween 1564 and 1575 was preceded by several years of relatively mild winters (1550– 1559), and followed by several years of gradually contained thermal decreases, which did not reach the average reference values.
25
Responses to winter temperatures in forest exploitation and wine production verify the results obtained, related to the significance and variability of the drop in
tempera-CPD
4, 697–718, 2008 Temperatures in central Iberian Peninsula T. Bull ´on Title Page Abstract Introduction Conclusions References Tables Figures ◭ ◮ ◭ ◮ Back CloseFull Screen / Esc
Printer-friendly Version Interactive Discussion
tures which occurred between 1550 and 1599. The steep decline in wine production during the cold years makes it possible to think that from 1582 to 1587 and from 1592 to 1598 there were secondary temperature drops, which had less intensity and shorter recovery periods than the primary plunge in temperatures.
The drop in winter temperatures as described is considered to be the primary cause
5
of the deterioration of the forests reflected in the documents consulted, although the potential influence of periods of drought should also be assessed. The exceptional climatic conditions explain the tension observed among the population as a result of hoarding firewood and other types of wood. The drop in temperatures may have af-fected the organization and structure of plant communities. The vegetation hardest hit
10
by colder temperatures are the plant communities and crops located presently at the limit of their spatial distribution as a result of bioclimatic causes.
In conclusion, this work proves that a cold climate crisis existed. Its main phase with a severe drop in temperatures took place between 1564 and 1575, continuing with decreasing intensity until the late 16th century. According to various publications
15
consulted, it corresponded to the Little Ice Age. Although this cold oscillation has not been completely defined chronologically in Spain, the data presented in this article may help to identify its time period as well as the characteristics of the thermal decrease it caused and the related environmental consequences.
Acknowledgements. The author thanks for their help to Julio Mu ˜noz of the Universidad
Com-20
plutense de Madrid and to the member of the Geoclimate Research Group of the Universidad Aut ´onoma de Madrid.
References
Blanco, E., Casado, M., Costa, M., Escribano, R., Garcia, M., Genova, M., G ´omez, A., Moreno, C., Morla, C., Regato, P., and Sainz, H.: Los bosques ib ´ericos, Una interpretaci ´on 25
geobot ´anica, Planeta, Barcelona, 1997.
CPD
4, 697–718, 2008 Temperatures in central Iberian Peninsula T. Bull ´on Title Page Abstract Introduction Conclusions References Tables Figures ◭ ◮ ◭ ◮ Back CloseFull Screen / Esc
Printer-friendly Version Interactive Discussion
Bradley, R., Briffa, K., Cole, J., Huges, M., and Osbon, T.: The climate of the last millenium in: Paleoclimate, Global Change and the Future, edited by: Alverson, R., Bradley, R., Pedersen, T., Springer, Berlin, 2003.
Br ´azdil, R., Pfister, C., Wanner, H., Storch, H., and Luterbacher, J.: Historical Climatology in Europe – The State of the Art, Climatic Change, 70, 363–430, 2005.
5
Bull ´on, T.: Degradaci ´on de la naturaleza y crisis de nieve y hielo en la segunda mitad del siglo XVI, Eria, 70, 129–148, 2006.
Bull ´on, T: Reconstruction of winter temperatures in the central area of the Iberian Peninsula during the second half of the XVI century, EGU General Assembly, Vienna, Austria, 13–18 April 2008, EGU 2008-A-09562, 2008.
10
Creus, J.: Dendrocronolog´ıa y Dendroclimatolog´ıa, o c ´omo los ´arboles nos cuentan el clima pasado, in: La reconstrucci ´on del clima en ´epoca preinstrumental, edited by: Garc´ıa Codr ´on, J., Universidad de Cantabria, Santander, 81–119, 2000.
Creus, J., Pe ˜na, J., Barriendos, M., Moreno, A., Gonz ´alez, P., Sancho, C., Valero, B., P ´erez, A., Saz, M., and Constante, A.: Paleoclimatological studies in Spain, in: Climatolog´ıa espa ˜nola, 15
Pasado, presente y futuro, edited by: Cuadrats, J. and Martin Vide, J., Zaragoza, Prensas Universitarias, 263–281, 2007.
Gal ´an, E., Ca ˜nada, R., Fernandez, F., and Cervera, B.: Annual Temperature Evolution in the Southern Plateau of Spain from the Construction of Regional Climatic Time Series, in: Detecting and Modelling Regional Climate Change, edited by: Brunet, M. and L ´opez, D., 20
Springer, Berlin, 119–131, 2003.
Instituto Nacional de Meteorolog´ıa: Valores normales y estad´ısticos de estaciones principales (1961–1990), Observatorio de Madrid Puerto de Navacerrada, Ministerio de Obras P ´ublicas Transportes y Medio Ambiente, Madrid, 1996.
Jones, P. and Hulme M.: Calculating regional climatic time series for temperature and precipi-25
tation: methods and illustrations, Int. J. Climatol., 16, 361–377, 1996.
Landsteiner, E.: The crisis of wine production in late sixteenth-century Central Europe: Climatic causes and economic consequences, Climate Change, 46, 323–334, 1999.
Martinez, I., Mart´ınez, T., and Alarc ´on, S.: Climatolog´ıa de Puerto de Navacerrada, Instituto Nacional de Meteorolog´ıa, Madrid, 1984.
30
Nicolas, J. de, Casado, I., and Sanjuan, J.: Climatolog´ıa b ´asica de la subregi ´on de Madrid, COPLACO, Ministerio de Obras P ´ublicas y Urbanismo, Madrid, 1979.
CPD
4, 697–718, 2008 Temperatures in central Iberian Peninsula T. Bull ´on Title Page Abstract Introduction Conclusions References Tables Figures ◭ ◮ ◭ ◮ Back CloseFull Screen / Esc
Printer-friendly Version Interactive Discussion
regionales y entre cultivos,http://www.infoagro.com/hortalizas/relacion clima cultivo.htm, In-foagro.com, 2005.
Rodrigo, F.: Trends in winter daily temperatures in Spain 1951–2002, Proceedings 5aAsamblea Hispano-Portuguesa de Gedesia y Geof´ısica, Ministerio de Medio Ambiente, Sevilla, 01–31 to 02–03, 2006.
5
Saz, M.: Temperaturas y precipitaciones en la mitad norte de Espa ˜na desde el siglo XV, Estu-dio dendroclim ´atico, Publicaciones del Consejo de protecci ´on de la Naturaleza de Arag ´on, Zaragoza, 2003.
Sneyers, R.: Sur l’analyse statistique des s ´eries d’observations, Organization M ´eteorologique Mondiale, Note Technique 143, 1975.
CPD
4, 697–718, 2008 Temperatures in central Iberian Peninsula T. Bull ´on Title Page Abstract Introduction Conclusions References Tables Figures ◭ ◮ ◭ ◮ Back CloseFull Screen / Esc
Printer-friendly Version Interactive Discussion Table 1. Parameters of equations used for reconstruction of temperatures.
X Y Equation R2 α
Temperature Index 0.658+0.884X 0.927 0.00 Index Temperature −0.722+1048X 0.927 0.00
CPD
4, 697–718, 2008 Temperatures in central Iberian Peninsula T. Bull ´on Title Page Abstract Introduction Conclusions References Tables Figures ◭ ◮ ◭ ◮ Back CloseFull Screen / Esc
Printer-friendly Version Interactive Discussion Table 2. R2and significance of lineal correlation equation.
Series R2 significance
Reference / ordinal index 0.963 0.000 WCI/ ordinal index 0.939 0.000 Current/reconstructed temperatures 1950–1960 0.927 0.000
CPD
4, 697–718, 2008 Temperatures in central Iberian Peninsula T. Bull ´on Title Page Abstract Introduction Conclusions References Tables Figures ◭ ◮ ◭ ◮ Back CloseFull Screen / Esc
Printer-friendly Version Interactive Discussion Table 3. Cumulative anomalies series group trends.
Group of years Total trend◦
C Error Significance Yearly trend◦ C 1550–1563 −0.600 ±0.062 0.000 −0.045 1564–1575 −2.537 ±0.090 0.000 −0.241 1576–1587 −1.109 ±0.058 0.000 −0.092 1588–1599 −0.802 ±0.077 0.000 −0.066 1550–1599 −1.364 ±0.035 0.000 −0.027
CPD
4, 697–718, 2008 Temperatures in central Iberian Peninsula T. Bull ´on Title Page Abstract Introduction Conclusions References Tables Figures ◭ ◮ ◭ ◮ Back CloseFull Screen / Esc
Printer-friendly Version Interactive Discussion Fig. 1. Geographical location of the study area.
CPD
4, 697–718, 2008 Temperatures in central Iberian Peninsula T. Bull ´on Title Page Abstract Introduction Conclusions References Tables Figures ◭ ◮ ◭ ◮ Back CloseFull Screen / Esc
Printer-friendly Version Interactive Discussion Fig. 2. Archives and collections consulted.
CPD
4, 697–718, 2008 Temperatures in central Iberian Peninsula T. Bull ´on Title Page Abstract Introduction Conclusions References Tables Figures ◭ ◮ ◭ ◮ Back CloseFull Screen / Esc
Printer-friendly Version Interactive Discussion Fig. 3. Standardized anomalies 1550-1599 series curve.
CPD
4, 697–718, 2008 Temperatures in central Iberian Peninsula T. Bull ´on Title Page Abstract Introduction Conclusions References Tables Figures ◭ ◮ ◭ ◮ Back CloseFull Screen / Esc
Printer-friendly Version Interactive Discussion Fig. 4. Sequential Mann-Kendall curves from the anomalies 1550–1599 series. 3 years moving
CPD
4, 697–718, 2008 Temperatures in central Iberian Peninsula T. Bull ´on Title Page Abstract Introduction Conclusions References Tables Figures ◭ ◮ ◭ ◮ Back CloseFull Screen / Esc
Printer-friendly Version Interactive Discussion Fig. 5. Box and whiskers plot of the 1550–1599 anomalies subgroup cumulative series.
CPD
4, 697–718, 2008 Temperatures in central Iberian Peninsula T. Bull ´on Title Page Abstract Introduction Conclusions References Tables Figures ◭ ◮ ◭ ◮ Back CloseFull Screen / Esc
Printer-friendly Version Interactive Discussion Fig. 6. Standardized cumulative curves of WCI and wine production.