Protein Engineering vol.7 no.ll pp. 1323—1332, 1994
Amino acid substitution during functionally constrained divergent
evolution of protein sequences
S-A.Benner1, M.A.Cohen and G.H.Gonnet2
Institutes for Organic Chemistry and 2Scienlific Computation, Swiss Federal
Institute of Technology, CH-8092 Zurich, Switzerland 'To whom correspondence should be addressed
In aligning homologous protein sequences, it is generally assumed that amino acid substitutions subsequent in time occur independently of amino acid substitutions previous in time, i.e. that patterns of mutation are similar at low and high sequence divergence. This assumption is examined here and shown to be incorrect in an interesting way. Separate mutation matrices were constructed for aligned protein sequence pairs at divergences ranging from 5 to 100 PAM units (point accepted mutations per 100 aligned positions). From these, the corresponding log-odds (Day-hoff) matrices, normalized to 25& PAM units, were con-structed. The matrices show that the genetic code influences accepted point mutations strongly at early stages of diver-gence, while the chemical properties of the side chains dominate at more advanced stages.
Key words: amino acid similarities/Dayhoff matrices/evolution/
protein sequence comparison/scoring matrices
Introduction
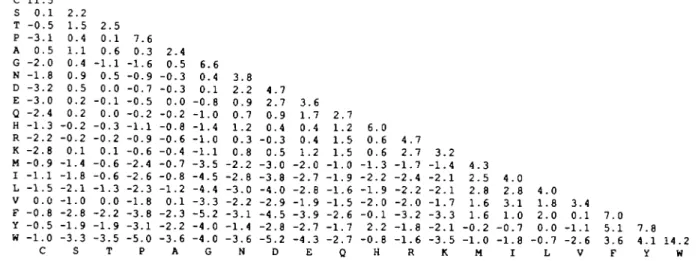
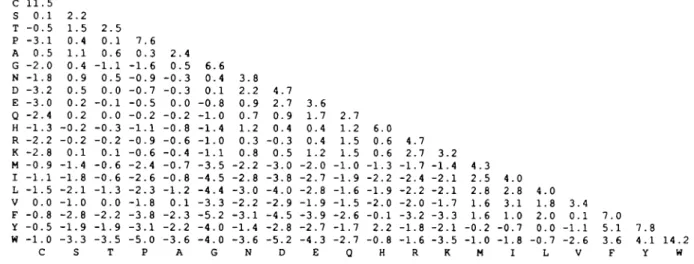
The first work to study systematically patterns of amino acid substitution in proteins (McLachlan, 1971; Dayhoff et al., 1972) modeled protein evolution as a Markovian process where (i) substitutions in a polypeptide chain accumulate independently of both time and position (Barry and Hartigan, 1987), and (ii) a single matrix was used to define the probability that each of the 20 amino acids is either conserved or transformed into one of the other 19 amino acids after a defined evolutionary period. This remains the most widely used model for divergent sequence evolution in proteins. Accordingly, 'log-odds' matrices similar to those presented by Dayhoff et al. (1978) (Figure 1), whose elements are 10 times the logarithms of the observed probability of a matching of each pair of amino acids in an alignment divided by the probability that the matching would occur by chance, have been used to construct most of the alignments found in the contemporary literature.
The log-odds matrix of Dayhoff et al. (1978) is based on empirical data: point mutations collected from aligned pairs of homologous protein sequences. Other empirically based log-odds matrices have been provided by Risler et al. (1988), Altschul (1991), Jones et al. (1992) and Henikoff and Henikoff (1992). Log-odds matrices have also been derived from ana-lyses of the chemical properties of the side chains of the amino acids (Grantham, 1974; Miyata et al., 1979; Rao, 1987), secondary structural propensities of amino acids (Levin et al., 1986), contact frequencies in protein structures (Miyazawa and Jernigan, 1993) and the genetic code (Fitch, 1966; Fitch and Margoliash, 1967). Nevertheless, empirically based matrices
remain popular, in part because of the report (Feng et al., 1985) that they give the best performance when aligning sequences of intermediary evolutionary divergence. Align-ments of this type are often the most valuable, especially when attempting to use patterns of variation and conservation of amino acids to predict secondary and tertiary structure in protein families (Benner, 1989, 1992; Benner and Gerloff,
1991).
A log-odds matrix is defined for a specific evolutionary distance (Dayhoff et al, 1972, 1978) measured in PAM units (point accepted mutations per 100 amino acids). For example, Dayhoff et al. (1978) presented their matrix for proteins 250 PAM units distant (corresponding to -15% pairwise identity) because this was viewed as the maximum evolutionary diver-gence where a sequence alignment might be attempted. How-ever, a matrix can be constructed to describe substitutions between two proteins at any PAM distance, and the matrix appropriate for any particular alignment task is the one defined for the PAM distance that separates the two sequences being aligned (Collins et al., 1988).
An evolutionary distance of 250 accepted point mutations per 100 amino acid residues is enormous, and it is not obvious how the empirical data needed to build a 250 PAM matrix to apply to such distantly related proteins might be obtained. Clearly, the data cannot be acquired simply by obtaining pairs of proteins 250 PAM units distant, aligning these and tabulating each of the 210 elements of a mutation matrix. Even if the sequences pairs being analyzed were indisputably homologous (itself difficult to demonstrate when so many point mutations have accumulated), the gaps in the alignment would make it impossible to guarantee that the individual amino acids matched in the alignment are truly descendants of single codons in the putative ancestral gene.
Dayhoff et al. (1978) resolved this problem by collecting mutation data from protein pairs that were very similar in sequence. Specifically, they extracted 1572 accepted point mutations from 71 sets of aligned protein sequence pairs <15 PAM units distant (>85% pairwise identity). Here, the alignments between sequence pairs are indisputable and elements of a mutation matrix can be tabulated directly without needing to worry about 'successive accepted mutations at one site' (Dayhoff et al., 1978).
To convert these data into a matrix that describes mutation between protein pairs 250 PAM units divergent, a process of matrix powering was then used. In this powering, a matrix collected for protein pairs m PAM units distant is converted to one applying to proteins separated by n PAM units by raising the first to the nlm\h power. More simply, consider a set of substitution data collected from aligned protein sequence pairs each separated by one accepted point mutation per 100 amino acids (i.e. protein pairs 99% identical in sequence). The matrix (the 1 PAM matrix) constructed directly from these data applies to proteins 1 PAM unit distant. To obtain a matrix that applies to proteins 250 PAM units distant, this matrix is raised to the 250th power. This is equivalent to applying the
c s T P A G N D E Q H R K M I L V F Y W 11.5 0 . 1 - 0 . 5 - 3 . 1 0 . 5 - 2 . 0 - 1 . 8 - 3 . 2 - 3 . 0 - 2 . 4 - 1 . 3 - 2 . 2 - 2 . 8 - 0 . 9 - 1 . 1 - 1 . 5 0 . 0 - 0 . 8 - 0 . 5 - 1 . 0 C 2 . 2 1 . 5 0 . 4 1 . 1 0 . 4 0 . 9 0 . 5 0 . 2 0 . 2 - 0 . 2 - 0 . 2 0 . 1 - 1 . 4 - 1 . 8 - 2 . 1 - 1 . 0 - 2 . 8 - 1 . 9 - 3 . 3 S 2 . 5 0 . 1 0 . 6 - 1 . 1 0 . 5 0 . 0 - 0 . 1 0 . 0 - 0 . 3 - 0 . 2 0 . 1 - 0 . 6 - 0 . 6 - 1 . 3 0 . 0 - 2 . 2 - 1 . 9 - 3 . 5 T 7 . 6 0 . 3 - 1 . 6 - 0 . 9 - 0 . 7 - 0 . 5 - 0 . 2 - 1 . 1 - 0 . 9 - 0 . 6 - 2 . 4 - 2 . 6 - 2 . 3 - 1 . 8 - 3 . 8 - 3 . 1 - 5 . 0 P 2 . 4 0 . 5 - 0 . 3 - 0 . 3 0 . 0 - 0 . 2 - 0 . 8 - 0 . 6 - 0 . 4 - 0 . 7 - 0 . 8 - 1 . 2 0 . 1 - 2 . 3 - 2 . 2 - 3 . 6 A 6 . 6 0 . 4 0 . 1 - 0 . 8 - 1 . 0 - 1 . 4 - 1 . 0 - 1 . 1 - 3 . 5 - 4 . 5 - 4 . 4 - 3 . 3 - 5 . 2 - 4 . 0 - 4 . 0 G 3 . 8 2 . 2 0 . 9 0 . 7 1 . 2 0 . 3 0 . 8 - 2 . 2 - 2 . 8 - 3 . 0 - 2 . 2 - 3 . 1 - 1 . 4 - 3 . 6 N 4 . 7 2 . 7 0 . 9 0 . 4 - 0 . 3 0 . 5 - 3 . 0 - 3 . 8 - 4 . 0 - 2 . 9 - 4 . 5 - 2 . 8 - 5 . 2 D 3 . 6 1 . 7 0 . 4 0 . 4 1.2 - 2 . 0 - 2 . 7 - 2 . 8 - 1 . 9 - 3 . 9 - 2 . 7 - 4 . 3 E 2 . 7 1 . 2 1 . 5 1 . 5 - 1 . 0 - 1 . 9 - 1 . 6 - 1 . 5 - 2 . 6 - 1 . 7 - 2 . 7 Q 6 . 0 0 . 6 0 . 6 - 1 . 3 - 2 . 2 - 1 . 9 - 2 . 0 - 0 . 1 2 . 2 - 0 . 8 H 4 . 7 2 . 7 - 1 . 7 - 2 . 4 - 2 . 2 - 2 . 0 - 3 . 2 - 1 . 8 - 1 . 6 R 3 . - 1 . - 2 . - 2 . - 1 . - 3 . - 2 . - 3 . K 2 4 1 1 7 3 1 5 4 2 2 1 1 - 0 - 1 . 3 . 5 . 8 . 6 . 6 . 2 . 0 M 4 . 2 . 3 . 1 . - 0 . - 1 . I 0 8 1 0 7 8 4 1 2 0 - 0 . 0 . 8 . 0 . 0 . 7 L 3 . 0 . - 1 . - 2 . V 4 1 1 6 7 . 0 5 . 1 3 . 6 F 7 . 8 4 . 1 14.2 Y W Fig. 1. A log-odds matrix computed from mutalion data in Dayhoff ti al. (1978), collected from aligned protein sequence pairs <15 PAM units distant. The matrix elements are extrapolated to protein pairs 250 PAM units divergent, based on the assumption that accumulation of accepted point mutation is a Markovian process, where subsequent point mutations are not influenced by predecessor point mutations Some terms in the log-odds matrix reported here are slightly different from those in the log-odds matrix reported in Dayhoff el al. (1978) These differences arise because the log-odds matrix here was
recomputed from DayhofFs substitution data (Dayhoff el al., 1978) without significant rounding errors and without making an approximation in computing the 1 PAM matrix from data collected from more distant protein sequence pairs See also Gonnet el al. (1992)
1 PAM matrix 250 times to a protein sequence, equivalent to the assumption that when successive substitutions do accumulate at a single site, the final result can be described by a repetition of the process that introduces single substitutions at a site.
This follows, of course, from the central assumption of the Markov model, that future and past mutations occur independently. The assumption is not, however, obviously true. Further, an extrapolation from 15 PAM to 250 PAM is considerable. In view of the fact that the matrix derived by this powering procedure is used in most contemporary alignment procedures, it is remarkable that the assumption has never been empirically tested. We have asked whether the assumption is empirically justifiable when applied to natural protein sequences, and report here that it is not, and in an interesting way.
Materials and methods
Sequence data were manipulated using the DARWIN system described elsewhere (Gonnet and Benner, 1991). DARWIN is available in a version that operates on Sun, DEC or MIPS workstations under the Unix operating system. Many of its most important functions are also available via an automatic server accessible by electronic mail at [email protected], or using the World Wide Web (WWW) with URL http://cbrg.in-f.ethz.ch/. Information can be obtained from the server by mailing a single line containing the word 'help'. The alignments themselves, or any selected subset of them, as well as log-odds matrices calculated for any PAM distance, are also available through the server. Each individual alignment is identified by the corresponding offsets in the sequences, the length of each sequence, the estimated PAM distance between the two sequences (determined as described below) and an estimate of the variance of this distance.
The analysis described here is based on 1.7 million pairs of aligned protein sequences found by the exhaustive matching of Version 64 of the MIPS protein sequence database (Gonnet
et al., 1992). More recently, analogous computations have
yielded similar results starting with version 24 of the SwissProt database (Bairoch and Boeckmann, 1992), and have provided a validation of the results reported here (also see below).
The exhaustive matching was carried out using algorithms based on Pat trees (Gonnet, 1984; Gonnet el al., 1992). This is equivalent to aligning (i) each possible sequence pair using a dynamic programming algorithm according to Needleman and Wunsch (1970), Smith and Waterman (1981) and Gotoh (1982), (ii) the classic Dayhoff log-odds matrix and (iii) a linear approximation of the deletion penalty reported elsewhere (Benner et al., 1992). Each alignment was then refined to match only the area of maximum similarity (often called a local alignment; Smith and Waterman, 1981). This produces an optima] local alignment with an affine deletion penalty. A general reference on other ways of scoring alignments can be found in Karl in and Altschul (1990).
From these alignments, the log-odds matrix was recalculated and the entire process was repeated (Gonnet et al., 1992), recalculating the log-odds matrix until self-consistency was attained. In other words, from the 1.7 million alignments, data were derived for a new mutation matrix and hence a new Dayhoff matrix. Because of their larger sample size, these new matrices are more reliable than the original Dayhoff matrix. With a new Dayhoff matrix, the entire 1.7 million alignments were realigned and this process was iterated until the matrix elements from step i + 1 were found to be identical to those from step i.
PAM distances separating the two protein sequences in each alignment were then estimated from the alignment. Each alignment is associated with a score that, when calculated using a log-odds matrix, is the logarithm of the probability (X 10) that the sequence similarities arose by common ancestry divided by the probability that they arose by chance. The score is computed using a specific scoring matrix normalized for a specific PAM distance. This score can, of course, be recomputed with a different scoring matrix normalized for a slightly different PAM distance. The PAM distance between the two sequences corresponds to the PAM distance of the scoring matrix that gives the highest score for the pairwise alignment. In tabulating mutation data, it is necessary to avoid biases arising because some protein families happen to be heavily represented in the sequence database. To this end, a connected component at evolutionary distance p (measured in PAM units)
Homologous protein sequence alignment
is defined to be a set of sequences where every sequence can be aligned to at least one other sequence at a distance ^/?. Thus, if alignments of protein sequence pairs are viewed as connectors between families, a connected component is a set of sequences that is linked together by at least one connector. More sequences are included in connected components defined at higher distances, of course. Conversely, the lower the distance p, the fewer the sequences within the connected component.
Connected components were constructed starting with a PAM distance p = 0 and proceeding to higher PAM distances. At first, individual sequences were isolated in components connected only to identical sequences in the database. By increasing/?, these sequences first become connected to closely related sequences; individual connected components then grow by the addition of single sequences. At slightly higher values of p, two connected components may become fused by a bridge. A bridge is defined as an aligned sequence pair between a member of one connected component and a member of another at distance pf. To avoid the multiple counting that
would arise from the repetition and oversampling of sequences, only those alignments that form bridges in a given PAM range were considered.
Next, it was necessary to be confident that homologous residues, those that descend from a single codon in the ancestral sequence, are paired in the alignments that yield mutation data. In the past, concern over the quality of the alignment has caused many investigators to use data from aligned sequence pairs that are only slightly divergent (5-20 PAM units has been typical) and to reject analyses where more highly divergent proteins are examined. However, to test the validity of the Markov model, pairs of aligned sequences of proteins divergent by higher PAM distances must be examined directly. Thus, questions regarding the quality of alignments obtained at higher PAM distances must be addressed.
The following criteria were used to ensure high-quality alignments. First, no aligned sequence pairs with PAM dis-tances <4 or > 100 were considered. The lower bound excludes many duplicate sequences in the database, including those containing recording errors. Second, no alignments involving <IOO amino acids were used. Third, the score of each alignment, which indicates the quality of the alignment, was selected to be >150. Empirically, these requirements are conservative and guarantee that two sequences are true homologs.
Two independent methods were used to show that these criteria yield alignments having a quality satisfactory to permit a productive analysis of mutation. First, artificial sequence pairs were generated at specific PAM distances by a process that simulated evolutionary divergence from a single authentic sequence. The two artificially generated sequences were then aligned by the procedure used here, and the alignment examined to learn how well it reproduced the true evolutionary relation-ship between the two sequences, known from the process by which the sequence pair was generated. As a test, the unitary matrix (where matches are scored as 1 and mismatches as 0), presumably the least satisfactory method for generating an alignment from protein pairs divergently evolving under func-tional constraints, was also used to realign the generated sequence pairs.
Second, all aligned sequence pairs where crystal structures for both proteins are reported in the protein sequence database were extracted. The sequence alignment obtained from
DAR-WIN was then used to orientate the secondary structural units, obtained directly from the crystallographic database without alteration. The quality of the alignment was evaluated by determining the extent to which the presumably homologous secondary structural units were aligned (see Results and discussion).
The creation of a log-odds (Dayhoff) matrix begins with the construction of a mutation matrix extracted from the primary data (amino acid substitutions) obtained from the aligned sequence pairs. A mutation matrix M describes the probabilities of amino acid mutations for a specified period of divergence, measured in PAM units:
Pr{ amino acid i —* amino acid y| = MJL
Specifically, mutation matrix M for PAM distance p is a matrix where the entry for i and j contains the probability of amino acid j mutating to amino acid / within p PAM units of evolution. Thus, a 1 PAM mutation matrix is a mutation matrix such that:
20
I = 1
-Afft) = 0.01
where /, is the frequency of amino acid i. Assuming that patterns of mutation between a pair of protein sequences are independent of the evolutionary distance separating the sequences, the mutation matrix for k PAM is expressed by raising the 1 PAM matrix to the kxh power, the combination of k mutation events each of 1 PAM.
A Dayhoff matrix is derived from a mutation matrix, where each entry is D{ij) = 101og10[M((t/)/f,], where /, is the frequency of amino acid / in the database. The terms in the 250 PAM log-odds matrix (D), as described by Dayhoff et al. (1978), are related to the 1 PAM mutation matrix (M) by the expression:
D,j = 10 log10
(A/250),
A suitable subset of aligned sequence pairs was selected from the exhaustive matching using the criteria stated above. The selected aligned sequence pairs were then grouped into 10 classes based on their estimated PAM distances within 10 PAM bands (4.7-6.4, 6.4-8.7, 8.7-11.8, 11.8-16.0, 16-22,22-29, 2 9 ^ 0 , 40-54, 54-74 and 74-100 PAM, respectively). These PAM bands were chosen as a compromise between two competing factors. First, the PAM bands must be relatively narrow; mixing aligned sequence pairs with very different amounts of divergence gives matrices that do not have an adequately specified evolutionary distance. However, the PAM bands must be broad enough to include a large enough sample of aligned sequence pairs for statistical significance. The precise numerical values for the top and bottom of the windows were chosen to establish an approximate geometric progression between the windows, so that the ratio between the lowest and highest PAM for every window is the same. For each of the PAM bands above, alignments providing 200 000-300 000 amino acid pairs were retrieved.
We now describe the collection of data for the matrices. Matrices counting all the mutations (7) in each PAM band were constructed and mutation matrices (Af) estimated from these using the formula:
M { y
where N is a diagonal matrix, n,t is the total count of amino
acids i, and x is the average PAM distance for which the transitions were collected. For a PAM distance x, (M^j, is the probability that one amino acid (aa) aa, mutates to another,
aar in two protein sequences x PAM units distance. For n,
amino acids /, the expected number of mutations aa, —> aas is
(Af*)y, n,. Let Tl} count the number of mutations in a given set
of sequences, from aa, —* aa}, so that:
)^ n, ~ T,j = number of events where aa, —» aas
then, MXN ~ T, where A' is a diagonal matrix with diagonal
entries n,. Since from an alignment one cannot decide whether
aa, —> aaj or aa} —* aa,, half of the mutations were counted
in one direction and half in the other. From this we can estimate Mx « T-N~x and M = (T-N~yix.
Note that the exponent of the matrix is not normally an integer. The powering of matrices to non-integral exponents is a standard procedure in matrix manipulation. This is normally carried out by the expansion of the exponential of a matrix as a convergent power series; a similar procedure can be used to obtain the logarithm of a matrix. The formulae, where / is the identity matrix and A is a general square matrix, are:
exp(A) = 1 + A + A2/2\ + AV3\ + ...
ln(/ + A) = A - A2/2 + -43/3 - .'..
Since Ax = exp[jcln(A)], powering to a non-integer can be
reduced to computing the logarithm of a square matrix, multiplying by a scalar and computing the exponential. For each group, all of the substitutions and all the amino acids which remained unchanged were tabulated. From this tabulation, a mutation matrix for each of the 10 PAM classes was approxi-mated. To allow these matrices to be directly compared, each was normalized to an arbitrary PAM distance (PAM 250) by matrix powering (see above).
A composite mutation matrix was then obtained by the following procedure. Individual elements of the mutation matrices (normalized to PAM 250) were plotted as a function of the PAM distance of the aligned sequence pairs that provided the empirical data (the midpoint of the PAM band was taken). These values, as a function of their sampled band PAM, were extrapolated to 116.5 PAM either exponentially or linearly, as appropriate for each matrix element. If the data showed no trend as a function of PAM distance, the elements were simply averaged to obtain the corresponding term in the composite log-odds matrix. The results are approximately those that would have been obtained by extracting substitution data from a unique large sample of aligned sequence pairs at PAM 116.5. The number 116.5 was chosen because it is the geometrical midpoint of the next PAM band that might have been used (PAM 100.0-135.8), sufficiently close to the experimental data to make a 'safe' extrapolation. Finally, a Dayhoff matrix was computed at PAM 250 from this extrapolated mutation matrix. These matrices, as well as many other services provided by DARWIN, can be requested by the automatic server via electronic mail or through the World Wide Web (WWW), as noted above.
To obtain the scoring matrix that would be expected were the genetic code the sole factor determining amino acid substitution, a log-odds matrix was constructed for a pair of protein sequences separated by 1 PAM unit, assuming that the probability of interconversion of each of the four nucleoside
bases was equal. This was extrapolated to PAM 250 to allow comparison with the other matrices described here and in the literature.
To perform principal component analysis (Chatfield and Collins, 1989), each of the 20 amino acids was represented as a point in a 19-dimensional space (in general, independently obtained distances between n points can be exactly represented in n - 1 dimensional space. For example, two points at a given distance can be represented exactly in one dimension; three points exactly on a plane, and so on). The 'distance' between each pair was defined to be inversely proportional to the conditional probability that the pair of amino acids had a common ancestor relative to the probability that the pair did not have a common ancestor. In other words, amino acids half as likely to mutate into each other were, in this representation, twice as far apart. From the mutation probability matrix, a distance (d) between each amino acid was computed.
From these pairwise distances, a symmetrical nXn distance matrix Dn was constructed. This matrix could be represented
exactly in 19 dimensions, but the points may also be projected onto lower dimensional spaces. Each projection involves an approximation of the distances in Dn, obtained by minimizing
the sum of the relative errors in the distances in the projection and the distances in Dn, such that if rl} is the distance between
the computed places of i andy then:
minimized Y ( r'j ~ Dny \ . . . •
J is minimi
u
{ Dni]I
For the natural proteinogenic amino acids, Dn can be
represented in three (or, at most, four) dimensions without substantial inaccuracies (see Results and discussion). For each, the most significant axis of the set of points was computed: that which minimizes the sum of squares of the distances of the points from the axis. Following this approximation, the amino acids are distributed in space in a particular shape. The main features (or axes) of this shape were then determined, and the amino acids ranked along these axes. This gave a relative positioning for each amino acid according to an axis, where the axis represents an unknown, but significant, property. The ranking of the amino acids for each component was obtained by projecting the amino acids onto the axis and normalizing within the range from -10 to +10.
Results and discussion
At the outset, it should be noted that all analyses in which empirical data are used to derive scoring matrices for aligning homologous protein sequences contain an element of circular-ity. Log-odds matrices are constructed from substitution data collected from aligned pairs of homologous protein sequences. Yet these sequences themselves are aligned using a scoring matrix. In the informal literature, some have expressed the belief that this circularity undermines the enterprise.
Leaving aside philosophical issues, this view would be correct only if the nature of the alignments used in the analysis were so strongly influenced by the scoring matrix used in the first stage of the alignment process that they did not successfully pair amino acids that are descendants of a single codon in the ancestral genes. As a first step to exclude this possibility, the
Homologous protein sequence alignment
scoring matrix was refined to self-consistency, a procedure well known in the chemical sciences (Borden, 1975). In the first pass, homologous sequence pairs were aligned using the Dayhoff et al. (1978) matrix. This generated a set of aligned sequence pairs from which amino acid substitution data were collected. These were then used to generate new log-odds matrices, which were themselves used to refine the alignments of the homologous sequence pairs. The process was continued with successive versions of the scoring matrix until further refinements did not change the scoring matrix.
Convergence does not, of course, by itself guarantee conver-gence to a correct solution. It is possible that the starting alignments were so inaccurate that the matrix obtained upon convergence is only locally optimal. To rule this out, two experiments were performed. First, artificial sequence pairs were generated at specific PAM distances by a process that simulated evolutionary divergence from a single authentic sequence. The two artificially generated sequences were then aligned by the procedure used here. Regardless of the matrix used, the true evolutionary relationship between the two sequences, known from the process by which the sequence pair was generated, was accurately obtained (Table I). Even using the unitary scoring matrix, the most primitive scoring matrix available, the error was only 7.5% at 100 PAM.
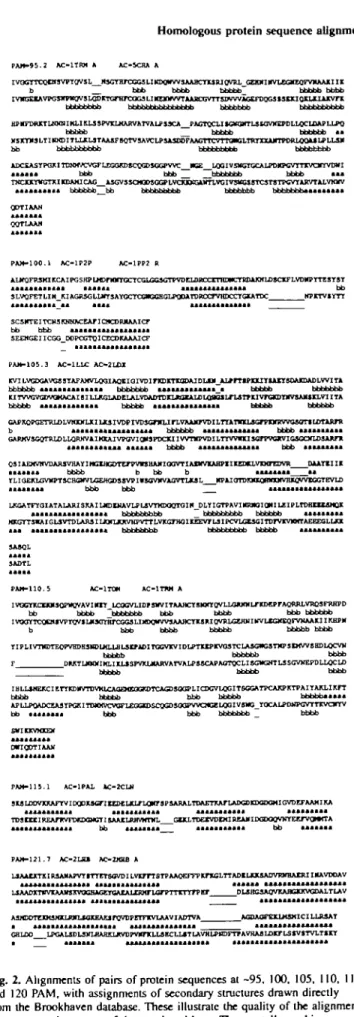
To obtain a biochemical correlation to this experiment, all aligned sequence pairs, where both sequences corresponded to a crystal structure reported in the protein sequence database, were extracted from the exhaustive matching. Secondary structures for each of the aligned sequences were then obtained from the crystallographic database, and the alignment inspected to determine how accurately the sequence alignment aligned secondary structural elements. Several pairs, chosen automatic-ally by computer as the alignments whose PAM distances were the closest in the set to PAM 95, 100, 105, 110, 115 and 120, are shown in Figure 2. It is evident that the alignment procedure used in this analysis in general successfully matched secondary structural elements, even in sequence pairs separated by 120 PAM units — considerably more divergent than the most divergent pairs used in the analysis presented here.
These results demonstrate that the aligned pairs of sequences used as the starting point in this empirical analysis (up to PAM 100) match homologous positions within the aligned sequence pairs with only negligible error. Thus, these align-ments are able to support the analysis here. This result should be neither surprising nor controversial, given the known
Table I. Identification of the true evolutionary relationships between artificially constructed homologous sequence pairs using different scoring matrices
PA>^95.2 AC-1TRM A AC-SCHA A
PAM Unitary matrix (% error) Dayhoff et al. (1978) matrix ( « error) Gonnet et al. matrix (% error) 100 86 75 50 7.4 5.5 4.0 1.8 6.0 4.5 3.4 1.6 3.8 2.8 2.1 0.9 Pairs of homologous sequences at the designated PAM distance were artificially generated from single sequences by a process thai simulated evolutionary divergence, including insertions and deletions (Gonnet et al.,
1992). The two artificially generated sequences were then aligned using either the unitary matrix, Dayhoff et a/.'s (1978) matrix or the Gonnei matrix. The percentages of positions incorrectly paired in each alignment are given. b b b b IVICGEKA VPGSWPWQV 5 LQD KTGFHFCQG3 LI M bb ****** TKCDcnfcn ODTIAAN QQTLAAM
OIHI *CLI K U SPVKLKABViTVAL b b b b b a TDHHVCVGF LEGOKD8CQGDJC b b b ( I KDAHICAG__JUGVS SCMQD8G b b b b
„»_
PSASODF GPWC b b b GPLVCWC _ F i J ^ ^ _bbbbbbb bbbb • • * bbbbbbb* ******** P A W - 1 0 0 . 1 AC-1P2P AC-1PP2 R *************** b b _ r K r T G J J l ^ KPKTVIYTT **********_** **** **************SCSKTEITOJ5 KWftCEAT ICHCDMAAICT bb bbb ****************** SEEWGEIICGG_DDPCGTQICECDKAAAICF _ *****************
PAIH105.3 AC-1LLC AC-2LUX
IOTLVQ)GAVCTS?AFA>rn4XUAaEiaiVDinCDrrKaDJUDI^ bbbbbb u u i i i u i i i u bbbbbbb *************_* bbbbb bbbbbbb bbbbb ************* bbbbb « • « « • « » « • * • • • • • bbbbb bbbbbb vwxMjaijrjivi>Fivi>saTrur^ ****************** >*w*^ ************* bbbb ********** I I I * « « I bbbb b bb b ******** • * TLIOEKLGVWPTSCBGWVLGEJKMSVFIWSOVIIViOTTIJtSL ^UPAIOTOniKQHlOOIVHICflVVICCTEVLD ******** b b b b b b ***************** _ v*******^ bbbbbb ********* MKJTTSmA IGLSVTDLAR31 UOfUOtVHPVTT LVKGTHQIKEEVT L31PCVLOSGI T
SA3QL
*****
SADTL
*****
PAM-110.5 AC-lTOH AC-1T
IVQGTKCDOISQPWQV AVI HXT_LCOOVLI D T SWVIT AAflCT StOfl QVLLGIOW LTKDePFAQRRLVTtQSFRHFD b b bbbfr bbbtabbb hfofr h^hfr. b b b H ^ * ^ * ' I V0GTTCQiat*VPTOV» UUGTfHTCGGS LI MXJWWSAABCTKSRIQVBLGEHNI kVLEGKEQFVHAAXI IKHPM
b bbb bbbb bbbbb bbbbb bbbb iJfUAL3DU>lT1X?nVIDLVTttPrtQ3TClJi&^ bbbbb bbbbbb bbbb 0(IMLIK bbbbb b b b b b b b b b IH U J H E K I ETTTOIfVTOVKLCAaQffiOQKDTCJU^SaaP L I C D ^ ^ bbbb ^Tfrfr b b b hn^>h b b b b b a * a * « AP LLPOUJCEASTPGKI TDKKVCVarLEGaCDSCQGDSOaPVVCICE LQGI V5W0_T0CAUDMPGVTT)^arrV bb ******** b b b b b b bbbbbbb _ bbbb SHIKKVKKQf
********* **********
P A H - 1 1 5 . 1 AC-1PAL &C-2CLN
S U LDOVKKATTVI DODKflGn IEDC LJCLTLOKT 8PSARALTDAETKArLWJGDKDODOMIGVDEFAA*4IKA
*********** *********** *********** ********* ********
PAH-121.7 AC-2LHB AC-2KHBA
LIAAtJCTKIRSAWAPVTrTTgTSqVDI LVlf rTUTf AAQKtVPUIUn.TTAD»LIOCSADVBIfHAIRl IKAVDOAV • • • • • • • • • • • • i i — U U I I l l l U I U I lUiU UUI1UUUUUII LlAADICTWVKAAJISKVOCBAGETaAIALIBMrLOITTTmrTPHr DL5BC3AQVKAHUILKVUJA1.TLAV ASHDOTCDlS*atLnrL*OJtHAKj rQVDPCTFKVIAAV I, • ******************* GHLDO _ V B ) A O F E X U < S a c I 1XRSAT
Fig. 2. Alignments of pairs of protein sequences at -95, 100, 105, 110, 115 and 120 PAM, with assignments of secondary structures drawn directly from the Brookhaven database. These illustrate the quality of the alignments that serve as the source of data analyzed here. The crystallographic assignments are, of course, not entirely objective (Colloc'h el al., 1993). 'a' indicates an oc-helix; 'b' indicates a P-suand. Ac is the accession number in the database. The alignments shown here were selected by an algorithm based on their PAM distance, not on their quality, and arc statistically representative of the alignments of similar PAM distances.
dependence of gaps (the principal source of misalignments) on PAM distance (Benner et ai, 1992). A similar conclusion would not, however, apply to aligned sequence pairs with distances >150 PAM. Fortunately for the analysis below, all elements of the PAM 250 (extrapolated) log-odds matrix become virtually independent of the PAM distance of their empirical data set well before the quality of the alignments providing the primary data deteriorate.
Next we asked whether the scoring matrix was a strong function of the PAM distance of the aligned sequence pairs that yielded the amino acid substitution data. In this discussion, it is critical to distinguish between the PAM distances of the aligned sequence pairs for which the empirical mutation data are collected, and the PAM distance at which the matrix itself is presented. The matrix powering process (see above) can be used to convert a log-odds matrix constructed from data
c s T P A G N D E Q H R K M I L V F Y W
B
c s T P A G N D E Q H R K M I L V F Y Wc
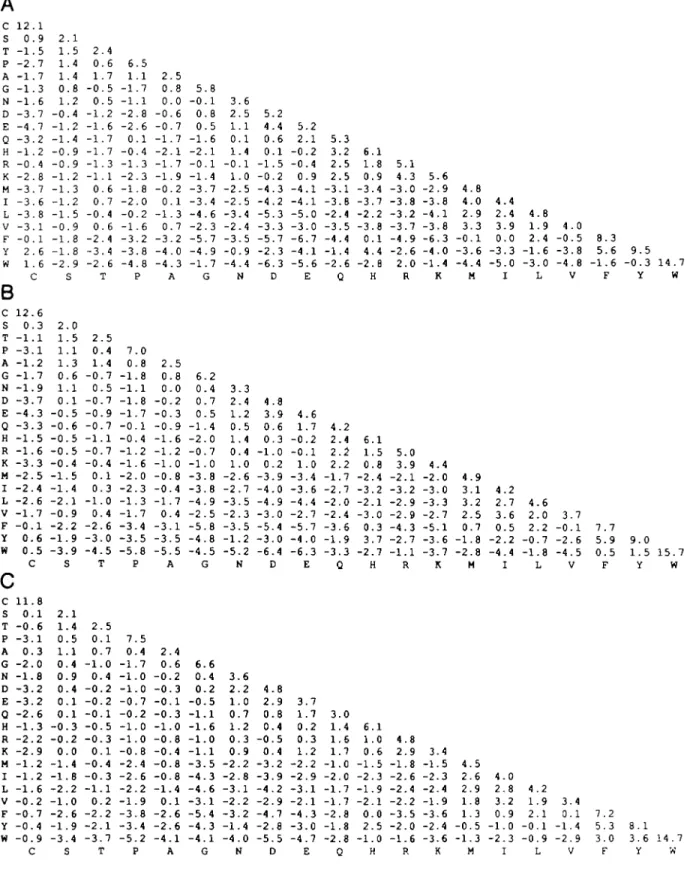
C s T P A G N D E Q H R K M I L V F Y W 1 2 . 1 0 . 9 - 1 . 5 - 2 . 7 - 1 . 7 - 1 . 3 - 1 . 6 - 3 . 7 - 4 . 7 - 3 . 2 - 1 . 2 - 0 . 4 - 2 . 8 - 3 . 7 - 3 . 6 - 3 . 8 - 3 . 1 - 0 . 1 2 . 6 1 . 6 C 1 2 . 6 0 . 3 - 1 . 1 - 3 . 1 - 1 . 2 - 1 . 7 - 1 . 9 - 3 . 7 - 4 . 3 - 3 . 3 - 1 . 5 - 1 . 6 - 3 . 3 - 2 . 5 - 2 . 4 - 2 . 6 - 1 . 7 - 0 . 1 0 . 6 0 . 5 C 1 1 . 8 0 . 1 - 0 . 6 - 3 . 1 0 . 3 - 2 . 0 - 1 . 8 - 3 . 2 - 3 . 2 - 2 . 6 - 1 . 3 - 2 . 2 - 2 . 9 - 1 . 2 - 1 . 2 - 1 . 6 - 0 . 2 - 0 . 7 - 0 . 4 - 0 . 9 C 2 . 1 1 . 5 1 . 4 1 . 4 0 . 8 1 . 2 - 0 . 4 - 1 . 2 - 1 . 4 - 0 . 9 - 0 . 9 - 1 . 2 - 1 . 3 - 1 . 2 - 1 . 5 - 0 . 9 - 1 . 8 - 1 . 8 - 2 . 9 S 2 . 0 1 . 5 1 . 1 1 . 3 0 . 6 1 . 1 0 . 1 - 0 . 5 - 0 . 6 - 0 . 5 - 0 . 5 - 0 . 4 - 1 . 5 - 1 . 4 - 2 . 1 - 0 . 9 - 2 . 2 - 1 . 9 - 3 . 9 S 2 . 1 1 . 4 0 . 5 1 . 1 0 . 4 0 . 9 0 . 4 0 . 1 0 . 1 - 0 . 3 - 0 . 2 0 . 0 - 1 . 4 - 1 . 8 - 2 . 2 - 1 . 0 - 2 . 6 - 1 . 9 - 3 . 4 S 2 . 4 0 . 6 1 . 7 - 0 . 5 0 . 5 - 1 . 2 - 1 . 6 - 1 . 7 -1 .7 - 1 . 3 - 1 . 1 0 . 6 0 . 7 - 0 . 4 0 . 6 - 2 . 4 - 3 . 4 - 2 . 6 T 2 . 5 0 . 4 1 . 4 - 0 . 7 0 . 5 - 0 . 7 - 0 . 9 - 0 . 7 - 1 . 1 - 0 . 7 - 0 . 4 0 . 1 0 . 3 - 1 . 0 0 . 4 - 2 . 6 - 3 . 0 - 4 . 5 T 2 . 5 0 . 1 0 . 7 - 1 . 0 0 . 4 - 0 . 2 - 0 . 2 - 0 . 1 - 0 . 5 - 0 . 3 0 . 1 - 0 . 4 - 0 . 3 - 1 . 1 0 . 2 - 2 . 2 - 2 . 1 - 3 . 7 T 6 . 5 1 . 1 - 1 . 7 - 1 . 1 - 2 . 8 - 2 . 6 0 . 1 - 0 . 4 - 1 . 3 - 2 . 3 - 1 . 8 - 2 . 0 - 0 . 2 - 1 . 6 - 3 . 2 - 3 . 8 - 4 . 8 P 7 . 0 0 . 8 - 1 . 8 - 1 . 1 - 1 . 8 - 1 . 7 - 0 . 1 - 0 . 4 - 1 . 2 - 1 . 6 - 2 . 0 - 2 . 3 - 1 . 3 - 1 . 7 - 3 . 4 - 3 . 5 - 5 . 8 P 7 . 5 0 . 4 - 1 . 7 - 1 . 0 - 1 . 0 - 0 . 7 - 0 . 2 - 1 . 0 - 1 . 0 - 0 . 8 - 2 . 4 - 2 . 6 - 2 . 2 - 1 . 9 - 3 . 8 - 3 . 4 - 5 . 2 P 2 . 5 0 . 8 0 . 0 - 0 . 6 - 0 . 7 - 1 . 7 - 2 . 1 - 1 . 7 - 1 . 9 - 0 . 2 0 . 1 - 1 . 3 0 . 7 - 3 . 2 - 4 . 0 - 4 . 3 A 2 . 5 0 . 8 0 . 0 - 0 . 2 - 0 . 3 - 0 . 9 - 1 . 6 - 1 . 2 - 1 . 0 - 0 . 8 - 0 . 4 - 1 . 7 0 . 4 - 3 . 1 - 3 . 5 - 5 . 5 A 2 . 4 0 . 6 - 0 . 2 - 0 . 3 - 0 . 1 - 0 . 3 - 1 . 0 - 0 . 8 - 0 . 4 - 0 . 8 - 0 . 8 - 1 . 4 0 . 1 - 2 . 6 - 2 . 6 - 4 . 1 A 5 . 8 - 0 . 1 0 . 8 0 . 5 - 1 . 6 - 2 . 1 - 0 . 1 - 1 . 4 - 3 . 7 - 3 . 4 - 4 . 6 - 2 . 3 - 5 . 7 - 4 . 9 - 1 . 7 G 6 . 2 0 . 4 0 . 7 0 . 5 - 1 . 4 - 2 . 0 - 0 . 7 - 1 . 0 - 3 . 8 - 3 . 8 - 4 . 9 - 2 . 5 - 5 . 8 - 4 . 8 - 4 . 5 G 6 . 6 0 . 4 0 . 2 - 0 . 5 - 1 . 1 - 1 . 6 - 1 . 0 - 1 . 1 - 3 . 5 - 4 . 3 - 4 . 6 - 3 . 1 - 5 . 4 - 4 . 3 - 4 . 1 G 3 . 6 2 . 5 1 . 1 0 . 1 1.4 - 0 . 1 1 . 0 - 2 . 5 - 2 . 5 - 3 . 4 - 2 . 4 - 3 . 5 - 0 . 9 - 4 . 4 N 3 . 3 2 . 4 1 . 2 0 . 5 1.4 0 . 4 1 . 0 - 2 . 6 - 2 . 7 - 3 . 5 - 2 . 3 - 3 . 5 - 1 . 2 - 5 . 2 N 3 . 6 2 . 2 1 . 0 0 . 7 1 . 2 0 . 3 0 . 9 - 2 . 2 - 2 . 8 - 3 . 1 - 2 . 2 - 3 . 2 - 1 . 4 - 4 . 0 N 5 . 2 4 . 4 0 . 6 0 . 1 - 1 . 5 - 0 . 2 - 4 . 3 - 4 . 2 -5.3 - 3 . 3 - 5 . 7 - 2 . 3 - 6 . 3 D 4 . 3 3 . 9 0 . 6 0 . 3 - 1 . 0 0 . 2 - 3 . 9 - 4 . 0 - 4 . 9 - 3 . 0 - 5 . 4 - 3 . 0 - 6 . 4 D 4 . 8 2 . 9 0 . 8 0 . 4 - 0 . 5 0 . 4 - 3 . 2 - 3 . 9 - 4 . 2 - 2 . 9 - 4 . 7 - 2 . 8 -5.5 D 5 . 2 2 . 1 - 0 . 2 - 0 . 4 0 . 9 - 4 . 1 - 4 . 1 - 5 . 0 - 3 . 0 - 6 . 7 - 4 . 1 - 5 . 6 E 4 . 6 1.7 - 0 . 2 - 0 . 1 1 . 0 - 3 . 4 - 3 . 6 - 4 . 4 - 2 . 7 - 5 . 7 - 4 . 0 - 6 . 3 E 3 . 7 1 . 7 0 . 2 0 . 3 1 . 2 - 2 . 2 - 2 . 9 - 3 . 1 - 2 . 1 - 4 . 3 - 3 . 0 - 4 . 7 E 5 . 3 3 . 2 2 . 5 2 . 5 - 3 . 1 - 3 . 8 -2.4 - 3 . 5 - 4 . 4 - 1 . 4 - 2 . 6 Q 4 . 2 2 . 4 2.2 2 . 2 - 1 . 7 - 2 . 7 - 2 . 0 - 2 . 4 - 3 . 6 - 1 . 9 - 3 . 3 Q 3 . 0 1.4 1 . 6 1.7 - 1 . 0 - 2 . 0 - 1 . 7 - 1 . 7 - 2 . 8 - 1 . 8 - 2 . 8 Q 6 . 1 1 . 8 0 . 9 - 3 . 4 - 3 . 7 - 2 . 2 - 3 . 8 0 . 1 4 . 4 - 2 . 8 H 6 . 1 1 . 5 0 . 8 - 2 . 4 - 3 . 2 - 2 . 1 - 3 . 0 0 . 3 3 . 7 - 2 . 7 H 6 . 1 1.0 0 . 6 - 1 . 5 - 2 . 3 - 1 . 9 - 2 . 1 0 . 0 2 . 5 - 1 . 0 H 5 . 1 4 . 3 - 3 . 0 - 3 . 8 - 3 . 2 - 3 . 7 - 4 . 9 - 2 . 6 2 . 0 R 5 . 0 3 . 9 - 2 . 1 - 3 . 2 - 2 . 9 - 2 . 9 - 4 . 3 - 2 . 7 - 1 . 1 R 4 . 8 2 . 9 - 1 . 8 - 2 . 6 - 2 . 4 - 2 . 2 - 3 . 5 - 2 . 0 - 1 . 6 R 5 . 6 - 2 . 9 - 3 . 8 - 4 . 1 - 3 . 8 - 6 . 3 - 4 . 0 - 1 . 4 K 4 . 4 - 2 . 0 - 3 . 0 - 3 . 3 - 2 . 7 - 5 . 1 - 3 . 6 - 3 . 7 K 3 . 4 - 1 . 5 - 2 . 3 -2.4 - 1 . 9 - 3 . 6 -2.4 - 3 . 6 K 4 . 8 4 . 0 2 . 9 3 . 3 - 0 . 1 - 3 . 6 - 4 . 4 M 4 . 9 3 . 1 3 . 2 2 . 5 0 . 7 - 1 . 8 - 2 . 8 M 4 . 5 2 . 6 2 . 9 1.8 1.3 - 0 . 5 - 1 . 3 M 4 . 4 2 . 4 3 . 9 0 . 0 - 3 . 3 - 5 . 0 I 4 . 2 2 . 7 3 . 6 0 . 5 - 2 . 2 - 4 . 4 I 4 . 0 2 . 8 3 . 2 0 . 9 - 1 . 0 - 2 . 3 I 4 1 2 - 1 - 3 4 2 2 - 0 - 1 4 1 2 - 0 - 0 . 8 .9 . 4 . 6 . 0 L .6 .0 .2 . 7 .8 L . 2 . 9 . 1 . 1 . 9 L 4 - 0 - 3 - 4 3 - 0 - 2 - 4 3 0 - 1 - 2 . 0 . 5 .8 .8 V . 7 . 1 . 6 . 5 V .4 . 1 .4 . 9 V 8 . 5 . - 1 . F 7 . 5 . 0 . F 7 . 5 . 3 . F 3 6 6 7 9 5 2 3 0 9 . 5 - 0 . 3 1 4 . 7 Y W 9 . 0 1.5 15.7 Y W 8 . 1 3 . 6 1 4 . 7 Y WFig. 3. Log-odds scoring matrices collected in the following PAM windows- (A) 6 4-8.7. (B) 22-29. and (C) 74-100 PAM, and extrapolated to a common PAM distance (PAM 250) to allow comparison Note that similar matrices arc available for all of the PAM windows described in Materials and methods.
Homologous protein sequence alignment
collected at any PAM distance to a matrix that describes amino acid substitution at any other distance. Traditionally, log-odds matrices are extrapolated to 250 PAM; scoring matrices for PAM 125 are also used. Regardless of the PAM designation of the final matrix, the data used to derive them has hitherto come from aligned protein sequence pairs <20 PAM units divergent (Dayhoff et al., 1978; George et al., 1990; Jones
et al., 1992). Thus, when applying these matrices to align
distantly related proteins, biochemists must assume a Markov model of amino acid substitution — that future substitutions accumulate independent of past substitutions.
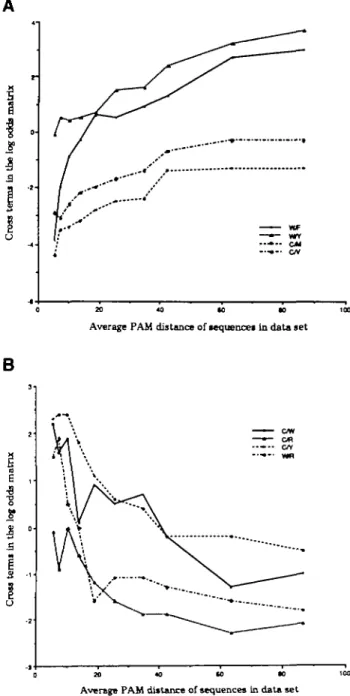
To determine whether the scoring matrix was a strong function of the PAM distance of the aligned sequence pairs that yielded the amino acid substitution data, individual log-odds matrices built from data collected separately from aligned sequence pairs in distinct PAM bands between PAM 6 and PAM 100 (extrapolated to a common PAM 250 for comparison) were examined. A significant number of matrix elements were found to depend strongly on the evolutionary distance of the protein pairs from which they were derived. Three of these matrices are shown in Figure 3, and several elements as a function of PAM distance are listed in Table II and graphically displayed in Figure 4. For example, matchings between Trp and Arg and between Trp and Cys are favorable at low PAM (the logarithm of the probability is positive), but unfavorable at high PAM. Conversely, matchings between Trp and Phe or Trp and Tyr are quite unfavorable at low PAM (the logarithm of the probability is now negative) but become rather favorable at high PAM.
In every case where a significant trend is observed in the probability of matching as a function of PAM distance, it can be explained by assuming that the genetic code influences accepted point mutation more at low PAM distances than at high PAM distances, where the chemical nature of the side chain becomes the factor determining patterns of amino acid substitution. Consider the amino acid tryptophan. Of the nine possible point mutations in the Trp codon (UGG), two yield termination codons, two encode Arg (AGG, CGG) and two encode Cys (UGC, UGU). The side chains of both Arg and Cys are chemically quite different from the side chain of Trp. The side chain of Trp is large and hydrophobic. In contrast, the side chain of Arg is hydrophilic, and the side chain of Cys
Table II. Elements from the scoring matrices obtained with data from aligned protein sequence pairs as a function of PAM distance for selected amino acid pairs
Average PAM Trp versus Arg Trp versus Phe Trp versus Tyr of data set cross-term cross-term cross-term
5.5 7.5 102 13.9 188 25.6 34.7 42.5 63 5 86.5 1.5 1.9 0 5 0.0 - 1 6 - I . I -1.1 -1.3 -1.6 -1.8 -3.9 -2.0 - 0 9 -0.3 0.6 0.5 0.9 1.3 2.7 3.0 -0.1 0.5 0.4 0 5 0 7 1.5 1.6 2.4 3.2 3.7 Entries are 10 times the logarithm of the probability that the indicated pair of amino acids will be matched, divided by the probability that they would be matched by chance in two protein pairs at 250 PAM units, with mutation data collected at the average PAM indicated in column 1. Probabilities at 250 PAM are obtained by the matrix powering procedure described in Materials and methods.
is small and can form disulfide bonds inaccessible to Trp. As shown in Figure 4, at low PAM distances, pairing of Trp with Arg and Trp with Cys is quite frequent, indicative of the similarities of the codons. At large PAM distances, however, their pairs are infrequent, indicating the dissimilarities in the chemical nature of the side chains.
In contrast, to obtain codons for either Phe (UUY) or Tyr (UAY) (Y denotes a pyrimidine) from the Trp codon, two point mutations are required (Swanson, 1984). Both Phe and Tyr have side chains that are chemically similar to that of Trp. As is shown in Figure 4, the Trp-Phe and Trp-Tyr terms increase with increasing PAM distance.
These results were cross-validated by recomputing mutation matrices on subsets of the database in a variety of ways.
Average PAM distance of sequence* in data set
B
-8 •gI 1
S 3 -i u —— CrtV - » - OB —-• cwAverage PAM distance of sequences in data set
Fig. 4. Graphs of some off diagonal matrix elements against PAM. Terms involving Trp (W), Cys (C), Arg (R), Phe (F), Met (M), Val (V) and Tyr (Y) are shown. See also Gonnet et al. (1992). (A) Cross-terms of some amino acid pairs similar in chemical properties but distant in genetic code. (B) Cross-terms of some amino acid pairs different in chemical properties but close in genetic code.
c s T P A G N D E Q H R K M I L V F Y W 5 . 5 1 . 5 - 1 . 9 - 1 . 9 - 1 . 9 1 . 0 - 1 . 5 - 1 . 6 - 3 . 0 - 3 . 1 - 1 . 6 0 . 7 - 3 . 2 - 2 . 7 - 1 . 9 - 1 . 3 - 2 . 2 1 . 8 2 . 6 4 . 1 C 2 . 6 1 . 0 0 . 4 0 . 1 - 0 . 6 - 0 . 3 - 2 . 1 - 2 . 8 - 2 . 3 - 1 . 6 0 . 3 - 1 . 5 - 1 . 3 - 0 . 5 - 1 . 2 - 2 . 2 0 . 0 0 . 3 0 . 8 S 4 . 0 1 . 1 0 . 9 - 2 . 1 0 . 9 - 2 . 1 - 2 . 1 - 1 . 7 - 1 . 8 - 0 . 6 1 . 0 0 . 7 0 . 8 - 1 . 9 - 2 . 2 - 2 . 1 - 2 . 1 - 2 . 2 T 3 . 8 0 . 8 - 1 . 8 - 1 . 6 - 2 . 2 - 2 . 1 1 . 0 0 . 7 0 . 3 - 1 . 5 - 1 . 4 - 1 . 6 0 . 0 - 2 . 1 - 1 . 8 - 2 . 3 - 1 . 6 P 4 . 0 1 . 2 - 1 . 7 1 . 0 1 . 3 - 2 . 1 - 2 . 1 - 1 . 6 - 1 . 9 - 2 . 0 - 1 . 8 - 2 . 3 1 . 0 - 2 . 4 - 2 . 4 - 2 . 2 A 4 . 2 - 2 . 6 1 . 1 1 . 4 - 2 . 1 - 2 . 2 0 . 8 - 2 . 2 - 2 . 3 - 2 . 5 - 2 . 2 1 . 1 - 1 . 9 - 1 . 8 1 . 4 G 4 . 7 1 . 7 0 . 3 0 . 4 1 . 8 - 1 . 5 3 . 5 0 . 1 0 . 9 - 2 . 2 - 2 . 2 - 1 . 3 2 . 5 - 3 . 0 N 4 . 8 3 . 8 0 . 3 1 . 7 - 2 . 3 0 . 3 - 2 . 5 - 2 . 1 - 2 . 4 1 . 0 - 1 . 7 2 . 3 - 2 . 9 D 5 . 7 2 . 0 0 . 3 - 2 . 0 2 . 0 - 1 . 8 - 2 . 3 - 2 . 5 1 . 3 - 2 . 9 - 0 . 9 - 3 . 2 E 5 . 5 3 . 6 0 . 3 2 . 2 - 1 . 2 - 1 . 9 0 . 1 - 2 . 0 - 2 . 1 - 0 . 8 - 2 . 3 Q 4 . 7 3 . 6 0 . 6 - 1 . 8 - 1 . 8 - 0 . 1 - 2 . 1 - 1 . 1 2 . 3 - 2 . 1 H 2 - 0 - 0 - 1 - 0 - 2 - 1 - 1 1 . 9 . 2 .4 . 2 .4 . 1 . 5 . 9 . 8 R 5 1 0 - 2 - 2 - 2 - 0 - 3 . 6 . 6 . 7 . 0 . 1 . 8 . 8 . 0 K 5 . 3 . 1 . 1 . 0 . - 2 . - 2 . M 4 3 5 0 5 9 0 4 1 1 1 - 1 - 2 . 1 . 2 . 0 . 3 . 6 . 2 I 3 1 2 - 1 - 0 .4 . 1 . 2 . 6 . 3 L 4 1 - 2 - 2 . 1 . 0 . 2 . 1 V 4 . 5 2.0 6.5 0.0 - 0 . 5 F Y 7 . 5 W Fig. 5. Genetic code matrix. The matrix is calculated by assuming that the genetic code is the only constraint on amino acid divergence for protein sequence pairs 1 PAM unit distant and using the amino acid composition of the database The matrix is then extrapolated to 250 PAM. This matrix can therefore be compared directly with the log-odds matrix in Figure 2. The non-universality of the code is unlikely to perturb this matrix significantly, as few proteins present in the database are coded for by these (38 mycoplasma proteins, 34 Telrahvmena proteins and 38 paramecium proteins are found in SwissProl release 21). c s T P A G N D E Q H R K M I L V F Y W 1 1 . 0 . - 0 . - 3 . 0 . - 2 . - 1 . - 3 . - 3 . - 2 . - 1 . - 2 . - 2 . - 0 . - 1 . - 1 . 0 . - 0 . - 0 . - 1 . C 5 1 5 1 5 0 8 2 0 4 3 2 8 9 1 5 0 8 5 0 2 . 2 1 . 5 0 . 4 1 . 1 0 . 4 0 . 9 0 . 5 0 . 2 0 . 2 - 0 . 2 - 0 . 2 0 . 1 - 1 . 4 - 1 . 8 - 2 . 1 - 1 . 0 - 2 . 8 - 1 . 9 - 3 . 3 S 2 . 5 0 . 1 0 . 6 - 1 . 1 0 . 5 0 . 0 - 0 . 1 0 . 0 - 0 . 3 - 0 . 2 0 . 1 - 0 . 6 - 0 . 6 - 1 . 3 0 . 0 - 2 . 2 - 1 . 9 - 3 . 5 T 7 . 6 0 . 3 - 1 . 6 - 0 . 9 - 0 . 7 - 0 . 5 - 0 . 2 - 1 . 1 - 0 . 9 - 0 . 6 - 2 . 4 - 2 . 6 - 2 . 3 - 1 . 8 - 3 . 8 - 3 . 1 - 5 . 0 P 2 . 4 0 . 5 - 0 . 3 - 0 . 3 0 . 0 - 0 . 2 - 0 . 8 - 0 . 6 - 0 . 4 - 0 . 7 - 0 . 8 - 1 . 2 0 . 1 - 2 . 3 - 2 . 2 - 3 . 6 A 6 . 6 0 . 4 0 . 1 - 0 . 8 - 1 . 0 - 1 . 4 - 1 . 0 - 1 . 1 - 3 . 5 - 4 . 5 - 4 . 4 - 3 . 3 - 5 . 2 - 4 . 0 - 4 . 0 G 3 . 8 2 . 2 0 . 9 0 . 7 1 . 2 0 . 3 0 . 8 - 2 . 2 - 2 . 8 - 3 . 0 - 2 . 2 - 3 . 1 - 1 . 4 - 3 . 6 N 4 . 2 . 0 . 0 . - 0 . 0 . - 3 . - 3 . - 4 . - 2 . - 4 . - 2 . - 5 . D 7 7 9 4 3 5 0 8 0 9 5 8 2 3 . 6 1 . 7 0 . 4 0 . 4 1 . 2 - 2 . 0 - 2 . 7 - 2 . 8 - 1 . 9 - 3 . 9 - 2 . 7 - 4 . 3 E 2 . 1 . 1 . 1 . - 1 . - 1 . - 1 . - 1 . - 2 . - 1 . - 2 . Q 7 2 5 5 0 9 6 5 6 7 7 6. 0 . 0 . - 1 . - 2 . - 1 . - 2 . - 0 . 2 . - 0 . H 0 6 6 3 2 9 0 1 2 8 4 2 - 1 - 2 - 2 - 2 - 3 - 1 - 1 . 7 . 7 . 7 . 4 . 2 . 0 . 2 . 8 . 6 R 3 . 2 - 1 . 4 - 2 . 1 - 2 . 1 - 1 . 7 - 3 . 3 - 2 . 1 - 3 . 5 K 4 . 2 . 2 . 1 . 1 . - 0 . - 1 . H 3 5 8 6 6 2 0 4 2 3 1 - 0 - 1 . 0 . 8 . 1 . 0 . 7 . 8 I 4 1 2 0 - 0 . 0 . 8 . 0 . 0 . 7 L 3 . 0 . - 1 . - 2 . V 4 1 1 6 7 . 0 5 . 1 3 . 6 F 7 . 8 4 . 1 Y 14.2
Fig. 6. Recommended composite log-odds scoring matrix for aligning distantly related proteins (PAM 100-200) Sec also Gonnel el al (1992).
The matrices have also remained essentially identical when recalculated with a database that has increased in size by a factor of approximately two since the first matrix was calcu-lated. Further, the substitution matrices proved to be remarkably similar, even when functional subsets of proteins (e.g. the immunoglobulins) were examined (data not shown).
For comparison, a log-odds matrix was constructed describ-ing the probability of interconversion of amino acids assumdescrib-ing that the genetic code is the sole constraint on divergence (Figure 5). In this matrix, the W/R cross-term is larger than either the W/F or the W/Y cross-terms. Comparison of this matrix with the trends observed in the matrices in Figure 3 further confirms the influence of the code on accepted amino acid substitution.
The code is expected to influence amino acid substitution. However, it was not expected that the code would influence accepted amino acid substitutions — those that have passed through the filter of natural selection before appearing in a sequence database. Naively, divergence should be strongly constrained by the chemical properties of the amino acid side chains regardless of evolutionary distance. Indeed, the influence might be expected to be greater at lower evolutionary distances than at higher distances, as there is less opportunity at low
evolutionary distance for second and third point mutations to compensate for a substitution of a side chain by another with greatly different chemical behavior. This suggests that 'code-driven' substitution, replacing an amino acid side chain by one with greatly different properties (e.g. Trp by Arg), must occur in a position in the folded structure where this change has no impact on function important to natural selection. Most probably, such a position lies on the surface of the folded protein. Thus, code-driven interconversions at low PAM dis-tance carry information regarding the tertiary structure of the protein family. This type of information is useful in predicting the folded structure of proteins from a comparison of homolog-ous protein sequences (Benner, 1989, 1992; Benner and Ger-loff, 1991).
These data also suggest that Dayhoff's most advanced matrix, collected from sequence pairs with quite low PAM distances, is inappropriate for aligning more distantly related sequences (PAM 100-200), where each codon has had the opportunity to sustain more than one point mutation and where the amino acid substitution is ultimately chosen because it has certain chemical properties. A composite log-odds matrix for scoring alignments of distant sequence pairs was therefore derived (Figure 6). It was noted that all matrix elements cease
Homologous protein sequence alignment
Table III. Principal component analysis evolutionary Principal component Trp Phe Leu lie Tyr Met Val Cys His Thr Ala Arg Gin Ser Lys Asn Glu Pro Asp Gly >' distances 1 -10.0 - 8 . 9 - 7 . 3 - 6 . 5 - 6 . 4 - 5 . 0 - 4 . 0 - 3 . 3 0.5 2.2 2.6 3.4 3.5 4.1 4.8 5.6 7 0 7.1 8.9 10.0 Principal component Tip Tyr His Arg Asn Asp Phe Lvs Gin Glu Gly Ser Cys Met Thr Leu Ala He Val Pro of amino acid 2 -10.0 - 7 . 0 -6.7 -6.1 -5.1 - 3 . 9 - 3 . 6 -3.1 -2.7 - 2 . 0 - 0 . 6 2.0 2.8 3.2 4.4 4.4 5.6 8.6 9.0 10.0 substitutions Principal component Cys Glv Ser Ala Asn Trp Tyr Phe Thr Val His Asp He Met Leu Arg Pro Glu Gin Lys at large 3 -10.0 - 6 . 9 -1.1 -0.7 1.2 1 6 2.6 3.5 3.9 3.9 4.1 4.7 6.2 7.0 7.9 8.3 8.5 8 6 8 7 10.0 Principal components were calculated by representing each amino acid as a point in 19-dimensional space, with the distance between each point inversely proportional to the probability represented by the term in the log-odds matrix shown in Figure 6. The first, second and third columns represent the position along the component axis (scaled arbitrarily from - 1 0 to +10) where the indicated amino acids project. Principal components are calculated at 150 PAM.
to be significantly dependent on PAM distance below PAM 100, the highest point where empirical data were collected. Therefore, the matrix elements obtained from the matrices represented in Figure 3 were extrapolated to 116.5 PAM either exponentially or linearly, as appropriate for each matrix element (see Materials and methods). The resulting composite matrix was then normalized to PAM 250. This composite matrix (Figure 6), after normalization to the PAM distance appropriate for the sequence pair being aligned (Collins et al., 1988), is recommended for aligning distantly homologous protein sequences (PAM distances 100-200).
The matrix that reflects amino acid substitutions at large evolutionary distances appears to reflect the properties of individual amino acids that are relevant for adaptation under functional constraints essentially uncontaminated by the non-physical bias imposed by the genetic code. Therefore, it is interesting to determine the physical properties of the amino acid side chains that underlie the matrix, an analysis similar to that obtained earlier for other versions of various mutation matrices (Kubota et al., 1981; Swanson, 1984; Kelly and Holladay, 1987).
A multidimensional analysis was performed upon the com-posite log-odds matrix recommended for aligning distantly related protein sequences. Only four principal components were needed to represent accurately the 'distances' between the 20 proteinogenic amino acids (see Materials and methods). Table III collects the positions of the amino acids in their projections along these four dimensions. The first three account for the majority of the variation in the amino acids. For example, for the distances derived from a matrix at 100 PAM, the first principal component reduces the SD (distances in the representation versus distances in Dn; see Materials and
methods) from 8.6 to 4.3, the second from 4.3 to 2.7, the third from 2.7 to 0.7, and the fourth from 0.7 to 0.1. The remaining
Rr»t Principal Component
Fig. 7. Plot showing the first two principal components of the composite
substitution matrix shown in Figure 6, from data reported in Table III.
principal components account for only 0.1 SD in the distances of the amino acids represented in the full distance matrix.
The first and most significant principal component correlates clearly to a combination of the size and hydrophobicity of the amino acid side chain. These undoubtedly emerge together as a single component because of a correlation between these two properties in the naturally proteinogenic amino acids. This is consistent with analyses made previously, as well as intuitive ideas about which amino acid pairs can perform analogous functions in proteins. For example, various authors have suggested that the size and hydrophobicity of amino acid side chains are major factors governing the substitution during functionally constrained divergent evolution (Grantham, 1974; French and Robson, 1983). Taylor (1986) grouped amino acids into sets based on physical chemical and mutation data, while Risler el al. (1988) described more recently a series of more restricted sets, comparing nine different scoring matrices and suggesting that matrices derived from similar criteria clustered together.
The physical and structural features of the amino acid side chains associated with the second and third principal components are not as clear, however. The second principal component groups Arg and Asn with Tyr and Trp at one end of the scale, and Lys and Pro with Val and He at the other. This clustering is unexpected based on simple concepts of size and hydrophobicity. However, all of the amino acids that bear a side chain containing a double bond are at one end of the scale, while those that do not are at the other. Side chains containing double bonds are more polarizable than side chains lacking these. Thus, this scale might correlate with polariz-ability, and suggests that side-chain polarizability is an import-ant factor in determining amino acid substitution during divergent evolution.
Two final comments are appropriate. First, it is worth mentioning that the 'full Dayhoff model' (Dayhoff et al, 1978) avoided the examination of amino acid substitution in distantly homologous proteins because the 'extinct' nodes that were intermediates in the divergent evolution of distant sequences could not be reconstructed easily. In this model,
proteins whose sequences are separated by n PAM units diverged via n - 1 intermediate sequences, each separated from adjacent sequences by 1 PAM unit of evolutionary distance. Some have remained concerned because these n - 1 intermediate sequences are not reconstructed in this work, the enterprise undertaken here lacks a degree of validity. (We are indebted to a reviewer for raising this concern.)
step I starting —• 1 PAM step 2 step 3 node I —> node 2 —> 1 PAM 1 PAM.
step n - 2 slep n - 1 slep n
. —> node n - 2 -* node n - 1 —> end I P A M I P A M 1 P A M n PAM units
In fact, the intermediary 'extinct' nodes are interesting only if a Markovian model for divergent protein evolution is assumed. Thus, there is little doubt that for each of the 1 PAM steps between reconstructed nodes, a 1 PAM matrix very similar to Dayhoff's original matrix will describe the overall probabilities of amino acid substitution. However, what is clear from this work is that the substitution over n PAM units will not be reflected by the 1 PAM matrix applied n times. This means that for specific positions, the pattern of substitution on step x + 1 will not be independent of substitution in step
x. For example, if Trp is replaced by Cys in step x by a single
base change, and if the greatly different chemical properties of the Trp and Cys side chains cause selective disadvantage to the organism, there is a high probability that in step x + I a second mutation in the same codon will be chosen by natural selection. The interdependence of successive steps in divergent evolution is, of course, simply a statement that the Markovian model has broken down, and is interesting once the breakdown of the Markovian model is recognized. The substitution probab-ilities that therefore become important are those that are obtained without the reconstruction of the intermediate node. Second, we should note that the matrices that we have produced, and the evolutionary model that underlies them, are different from those discussed by Henikoff and Henikoff (1992) in their presentation of the BLOSUM matrix. The BLOSUM matrix was derived as a tool to identify very distantly homologous sequences (PAM distance >200), those where the sequence similarities are not adequate to demonstrate that the proteins are themselves homologous (the so-called 'twilight zone'; Doolittle, 1987). The matrices presented here were derived in part to learn more about how amino acid substitutions are accepted in proteins evolving under functional constraints, and in part to construct high-quality alignments (e.g. as the starting point for structure prediction work; Benner. 1992) for protein pairs that, although rather divergent, are not so divergent that sequence similarities have nearly vanishing statistical significance.
Both goals are appropriate, of course. However, in comparing the performance of the two matrices, the different goals should be clearly acknowledged. As Henikoff and Henikoff (1992) have shown, the BLOSUM matrix is better than matrices such as those presented here for detecting sequence homology in the 'twilight zone'. However, the BLOSUM matrix is clearly not a starting point for interpreting the chemistry underlying amino acid substitution. Further, it heavily weights patterns of substitutions in highly conserved blocks of sequence. There-fore, it is not likely to give the best alignments for protein sequence pairs separated by 100-200 PAM. Here, as elsewhere, the appropriate choice of a research tool depends strongly on the application.
Acknowledgements
We thank Digital Equipment Corporation for the donation of computer equipment and Sandoz AG for partial support of this work. M A C . acknow-ledges the receipt of a Wellcome Trust Travelling Fellowship
References
Altschul.S.R. (1991)/ Mol Biol. 219, 555-565.
Bairoch.A. and Boeckmann.B. (1992) Nucleic Acids Res., 20, 2019-2022 Barry.D. and HartiganJ.A. (1987) Siaiist. Sci., 2, 191-210.
Benner.S.A. (1989) Ad\: Enzyme Regulat, 28, 219-236 Benner.S.A (1992) Curr Opin Struct Biol., 2, 402-412
Benner.S.A.and Gerloff.D (1991 )/Wv Enzyme Regular, 31. 121-181. Benner.S A , Cohen,M.A. and Gonnet.G.H. (1992) J. Mol Biol.. 229,
1065-1082.
Borden.WT. (1975) Modern Molecular Orbital Theory for Organic Chemists Prentice Hall, Englewood Cliffs, NJ.
Chatfield.C. and Collins,AJ. (1989) Introduction to Multivariant Analysis Chapman and Hall, NY, pp 57-227
ColhnsJ.F., Coulson.A.F.W. and Lyall.A. (1988) Comput. Appl. Biosa., 4, 67 Colloc'h.N., Etchebest.C, Thoreau.E., Hennssat.B. and MomonJ.-P (1993)
Protein Engng, 6, 377-382
Dayhoff.M O , Eck.F.V. and Park.C.M. (1972) In Dayhoff.M.O. (ed.), Atlas of
Protein Sequence and Structure. National Biomedical Research Foundation,
Washington, DC, Vol. 5, pp. 89-99.
Dayhoff.M.O., Schwartz.R.M. and Orcutt.B C (1978) In Dayhoff.M O (ed.).
Atlas of Protein Sequence and Structure. National Biomedical Research
Foundation, Washington, DC, Vol. 5, Suppl. 3, pp. 345-352.
Doolittle.R.F. (1987) Of Urfs and Orfs University Science Books, Mill Valley, CA.
Feng.D.F., Johnson.M.S. and Doolitlle.R F (1985)7. Mol. Evol.,2\, 112-125 Fitch.W.M. (1966) J. Mol. Biol., 16, 9-16.
Fitch.W.M. and Margohash.E. (1967) Science, 155, 279-284. French.S. and Robson.B. ( 1 9 8 3 ) / Mol. Evol, 19, 171-175.
George.D.G., Barker.WC and Hunt.L.T (1990) Methods Enzvmoi, 183, 333-351.
Gonnet.G.H. (1984) Handbook of Algorithms and Data Structures. Addison-Wesley, London, UK
Gonnet.G.H. and Benner.S.A (1991) Computational Biochemistry at the E TH Department Informatik, E.T.H., Zurich, Swiuerland, Technical Report 154. Gonnet.G H., Cohen.M.A. and Benner.S.A. (1992) Science, 256, 1443-1445 Gotoh.O. (1982) / Mol Biol., 162, 705-708.
Grantham.R (1974) Science, 185,862-864.
Henikoff.S. and HenikoffJ G. (1992) Proc. Nail Acad. Sci. USA, 89, 10915-10919.
Jones,DT. Taylor.WR and ThorntonJ M. (1992) Comput Appl. BIOSCI., 8. 275-282.
Karlin.S and Altschul.S.R (1990) Proc. Natl Acad. Sci. USA, 87. 2264-2268 Kelly.L. and Holladay.L.A. (1987) Protein Engng, 1, 137-140.
Kubota,Y., Takahashi.S , Nishikawa.K and Ooi.T. (1981) J Theor. Biol.. 91.
347-361
LevinJ.M., Robson.B and GamierJ. (1986) FEBS Lett., 205, 303-308. McLachlan.A.D. ( 1 9 7 1 ) / Mol. Biol, 61, 409^*24.
Miyata.T, Miyazawa.S. and Yasunaga.T. (1979) / Mol Evol., 12, 219-236. Miyazawa.S. and Jemigan.R.L. (1993) Protein Engng, 6, 267-278. Needleman.S.B. and Wunsch.C.D (1970) / Mol. Biol., 48, 443^53. RaoJ K.M. (1987) Int. J Peptide Protein Res., 29. 276-281
RislerJ.L., Delorme.M.O.. Delacroix.H. and Henaut.A. (1988) J. Mol Biol.. 204, 1019-1029.
Smith.T.F. and Waterman.M.S. (1981)/ Mol. Biol., 147. 195-197. Swanson.R. (1984) Bull Math. Biol.. 46, 187-203.
Taylor,W.R. (1986) / Theor. Biol., 119, 205-218