HAL Id: tel-02122045
https://hal.archives-ouvertes.fr/tel-02122045v2
Submitted on 2 Sep 2019HAL is a multi-disciplinary open access archive for the deposit and dissemination of sci-entific research documents, whether they are pub-lished or not. The documents may come from teaching and research institutions in France or abroad, or from public or private research centers.
L’archive ouverte pluridisciplinaire HAL, est destinée au dépôt et à la diffusion de documents scientifiques de niveau recherche, publiés ou non, émanant des établissements d’enseignement et de recherche français ou étrangers, des laboratoires publics ou privés.
Towards better estimates of carbon stocks in Bornean
logged-over Dipterocarp forests
Andes Rozak
To cite this version:
Andes Rozak. Towards better estimates of carbon stocks in Bornean logged-over Dipterocarp forests. Ecology, environment. AgroParisTech; Københavns universitet, 2018. English. �NNT : 2018AGPT0008�. �tel-02122045v2�
THÈSE POUR OBTENIR LE GRADE DE DOCTEUR
DE L’INSTITUT DES SCIENCES ET INDUSTRIES DU VIVANT ET DE
L’ENVIRONNEMENT – AGROPARISTECH
N° : 2018AGPT0008
En Spécialité : Ecologie et Biodiversité
École doctorale GAIA – Biodiversité, Agriculture, Alimentation, Environnement, Terre, Eau – n°584 Portée par l’Université de Montpellier
Unité de Recherche Forêts et Sociétés (CIRAD)
Titre de la thèse :
Vers une meilleure estimation des stocks de carbone dans les
forêts exploitées à Diptérocarpées de Bornéo
Présentée par
Andes Hamuraby ROZAK
Le 29 novembre 2018Sous la direction de M. Plinio SIST (Directeur de thèse)
et M. Karsten RAULUND-RASMUSSEN (Co-Directeur de thèse)
Devant le jury composé de
Mme. Alexia STOKES, Directeur de Recherche, INRA, France Président Mme. Michelle Amy PINARD, Professor, University of Aberdeen, Royaume Uni Rapporteur M. Yves LAUMONIER, Chercheur, CIFOR, Indonésie Rapporteur M. Markku KANNINEN, Professor, University of Helsinki, Finlande Examinateur M. Thomas NORD-LARSEN, Associate Professor, University of Copenhagen, Danemark Examinateur
M. Plinio SIST, Chercheur HDR, CIRAD, France Invité
UNIVERSITY OF COPENHAGEN
FACULTY OF SCIENCE
DEPARTMENT OF GEOSCIENCES AND NATURAL RESOURCE MANAGEMENT
PhD Thesis
Andes Hamuraby Rozak
Towards better estimates of carbon stocks
in Bornean logged-over Dipterocarp forests
Supervisors : Plinio Sist
Karsten Raulund-Rasmussen Submitted on : 13 September 2018
2
Towards better estimates of carbon stocks in Bornean
logged-over Dipterocarp forests
Andes Hamuraby ROZAK
A thesis presented for the dual degree
Doctorat AgroParisTech
and
Doctor of Philosophy University of Copenhagen
Ècole Doctorale GAIA, AgroParisTech, France
PhD School of Science, University of Copenhagen, Denmark
Presented and defended on 29 November 2018
3
This thesis was funded by the Education, Audiovisual, and Culture Executive Agency of
the European Commission
under
the Erasmus Mundus Joint Doctorate Programme (EMJD)
Forest and Nature for Society (FONASO)
Host institutions :
CIRAD
UPR Forêts et Sociétés
Campus International de Baillarguet TA C-105/D
34398 Montpellier Cedex 5
France
AgroParisTech
Campus d’Agropolis International
648 rue Jean-François Breton
34093 Montpellier Cedex 5
France
University of Copenhagen
Department of Geosciences and Natural Resource Management
Rolighedsvej 23
1958 Frederiksberg Copenhagen
Denmark
4
Table of Contents
Acknowledgments ...14 List of acronyms ...16 Abstract ...17 Résumé (français) ...18 Resumé (Danks) ...20 Publications ...21 1 General introduction ...221.1. Tropical forests and carbon issue ...23
1.2. On the importance of production forests ...24
1.3. Assessing C stocks in tropical forests ...27
1.4. Methods to estimate C stocks in tropical forests ...33
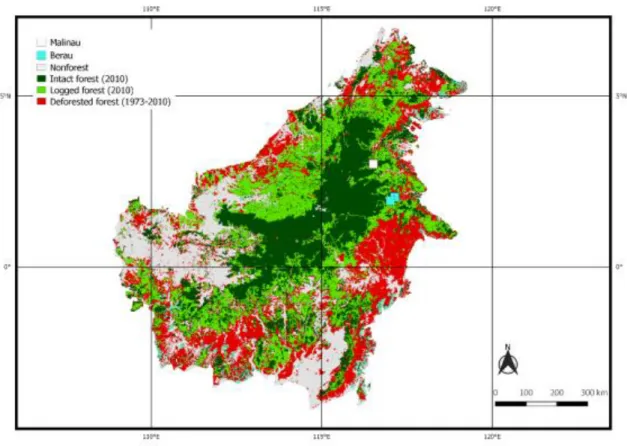
1.5. The overview of the Bornean forest ...34
1.5.1 Logging practices in Borneo ...36
1.6. Study objective, research question, and hypothesis ...37
1.7. Thesis outline ...38
2 How do we estimate deadwood stocks in disturbed forests? A carbon stocks assessment study in Bornean logged forests ...40
Abstract ...41
2.1 Introduction...42
2.2 Materials and methods ...43
2.2.1 Study site ...43
2.2.2 Study design ...44
2.2.3 Volume and mass estimation of deadwood ...45
2.2.4 Deadwood specific density ...46
2.2.5 Tree biomass estimation ...47
2.2.6 Litter stocks ...47
2.2.7 Data analysis ...47
2.3 Results ...49
2.3.1 Deadwood stocks ...49
2.3.2 Methods comparison for deadwood measurement ...50
2.3.3 Number of sampling units and effort needed to efficiently estimate deadwood 52 2.3.4 Above-ground carbon stocks ...53
5
2.4 Discussion ...57
2.4.1 Methodological considerations to assess deadwood stocks in logged forests ...57
2.4.2 Minimal sample size and effort to estimate deadwood ...58
2.4.3 Variability of total C stocks in logged forests ...58
2.5 Conclusions ...60
Acknowledgments ...60
Complementary Figures ...61
Supplementary Information ...63
3 The imprint of logging on tropical forest carbon stocks: a Bornean case-study ...78
Abstract ...79
3.1 Introduction...80
3.2 Materials and methods ...81
3.2.1 Study site ...81
3.2.2 Experimental design ...81
3.2.3 Logging intensity and C stocks ...82
3.2.4 Data analyses ...84
3.3 Results ...85
3.3.1 Total C stocks in a logged forest ...85
3.3.2 Drivers of C pools ...89
3.4 Discussion ...89
3.4.1 C stocks in logged forests and its driver...90
3.4.2 Implications for sustainable forest management ...91
3.5 Conclusions ...91
Acknowledgments ...92
Supplementary Table ...93
Supplementary Figure ...99
Supplementary Information ...100
4 Depletion of soil organic carbon stocks in Bornean logged forests ...102
Abstract ...103
4.1 Introduction...104
4.2 Materials and methods ...105
4.2.1 Study site ...105
4.2.2 Logging intensity, soil sampling and litter ...106
6
4.2.4 Statistical analysis ...107
4.3 Results ...108
4.3.1 Overview of logging intensity, litter C stocks, C concentration, available phosphorus, and clay content ...108
4.3.2 Soil mass and SOC stocks ...109
4.3.3 Drivers of SOC stocks ...111
4.4 Discussion ...113
4.4.1 Wet combustion method underestimating SOC stocks in a logged forest ...115
4.4.2 Effect of litter C stocks on SOC stocks...115
4.4.3 Integrating SOC for greenhouse gas emissions calculation ...116
4.5 Conclusion ...116
Acknowledgments ...116
Supplementary tables ...118
5 Discussion ...121
5.1 Discussion ...122
5.1.1 Commercial logging and forest C stocks ...122
5.1.2 Towards an optimal logging intensity in Dipterocarp forests ...123
5.1.3 Towards refined estimates of C stocks in logged forests ...124
5.1.4 Commercial logging and forest resilience ...126
5.1.5 Contextualizing the findings to sustainable forest management...127
5.2 Another future research direction ...128
5.2.1 Analyzing the relationship between C stocks and biodiversity ...128
6 Summary and conclusions ...130
6.1. Summary of the findings ...131
6.2. Conclusions ...133
Résumé substantiel ...134
Introduction ...135
Forêts tropicales et cycles du carbone ...135
Sur l'importance des forêts exploitées ...136
Évaluation des stocks de C dans les forêts tropicales ...138
Vue d'ensemble des forêts de Bornéo ...139
Pratiques d’exploitation forestière à Bornéo ...140
Objectif, question de recherche et hypothèse ...141
Matériel et méthodes ...142
7
Mesure des stocks de C à Berau, Kalimantan du Est ...143
Mesure des stocks de C à MRF, Kalimantan du Nord ...143
Résultats et discussion ...144
Résumé des résultats ...144
Discussion des résultats ...146
Dansk resumé ...150 Introduktion ...151 Metoder ...152 Resultater og diskussion ...153 Konklusion ...154 Bibliography ...155
8
List of Tables
Table 1-2 Selected studies examining the effect of logging on each C pool and total C stocks in tropical forests. Total C stocks define as the sum of above- and below ground C (AGC and BGC), deadwood C, litter C, and soil organic carbon (SOC). ...29 Table 1-3 Conservative default factor for estimating deadwood (DFDeadwood) and litter (DFLitter)
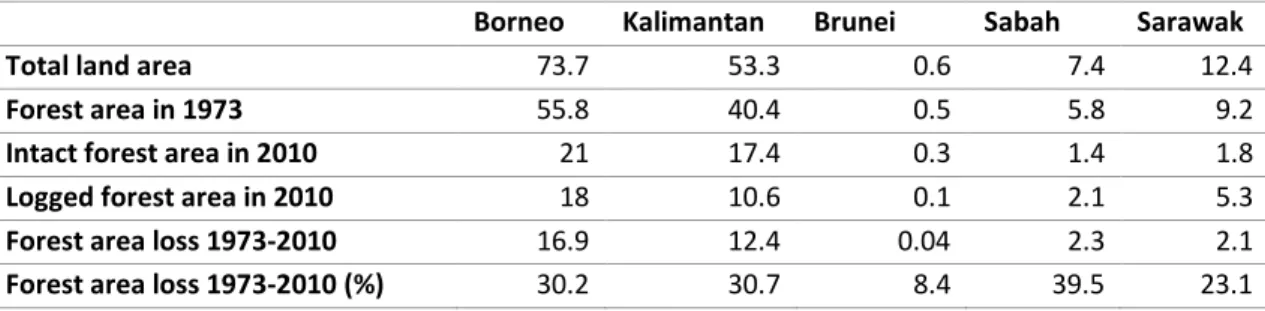
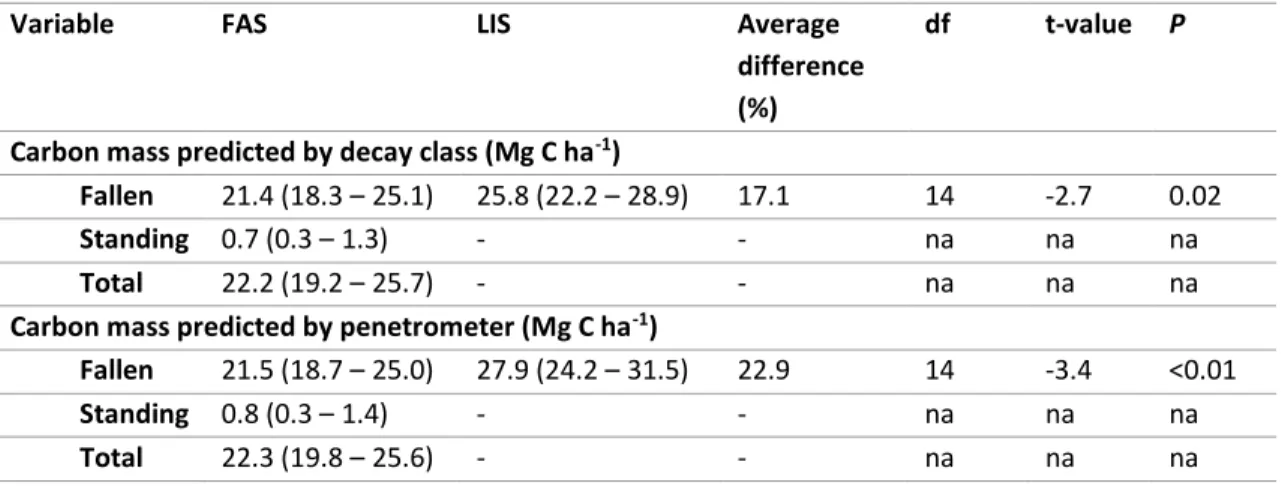
stocks as a percentage of AGC for tropical forests. Values were extracted from UNFCCC (2015). ...33 Table 1-1 Summary of forest area in Borneo in the year 1973 and 2010 (in million ha). Data were extracted from Gaveau et al. (2014). ...36 Table 2-1 The average of fallen, standing, and total deadwood stocks (Mg C ha-1, 95% CI) estimated by LIS and FAS. ...49 Table 2-2 Summary of sampling variance (S2), bias (Bias2), root mean square error (RMSE) and
efficiency (E) for deadwood stocks (Mg C ha-1) estimated by decay class and
penetrometer for each site (n = 5) and all sites (n = 15). Bias2 in LIS assumed to be
zero and negative bias2 assigned as zero (*). ...50
Table 2-3 The average time of installation, measurement and total time required per sampling unit (hour, 95% CI) on predicting deadwood stocks using LIS and FAS methods. The average total time of FAS representing the average time required to install, measure, and walking of three subplots (100 m2). ...51
Table 2-4 The number of sampling unit required (n) and respective effort needed (hours) to estimate mean fallen deadwood mass with N percent error (%) around the mean using FAS and LIS with a visual decay classification. ...52 Table 2-5 The average tree density (ha-1) and above-ground carbon stocks (AGC, Mg C ha-1) in
each site. Values in parentheses indicate 95% CI. ...53 Table 2-6 The average of fallen, standing, and total deadwood volume (m3 ha-1, 95% CI)
estimated by LIS and FAS. ...63 Table 2-7 Summary of variance (S2), bias (Bias2), root mean squared error (RMSE) and efficiency
(E) for fallen deadwood volume (m3 ha-1) each site. Bias2 in LIS assumed to be zero
and negative bias2 assigned as zero (*). ...64
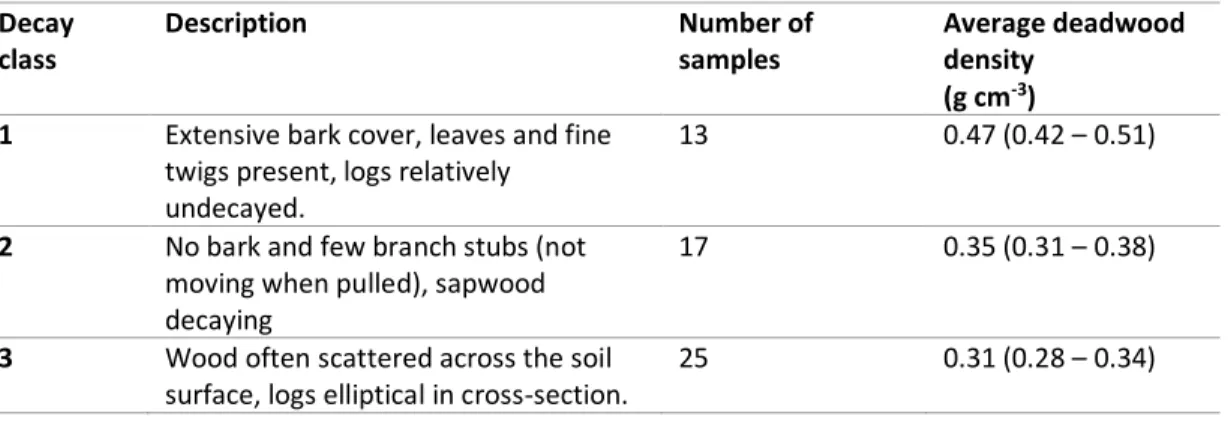
Table 2-8 Decay classes and corresponding deadwood density (± 95% CI). ...65 Table 2-9 Species list, above-ground carbon (AGC, Mg C ha-1), cumulated AGC (Mg C ha-1), and
cumulated percentage to total AGC (%) in each study site. Tree species were ranked by decreasing size according to their AGC in each site. ...68 Table 2-10 Family list, above-ground carbon (AGC, Mg C ha-1), cumulated AGC (Mg C ha-1), and
cumulated percentage to total AGC (%) in each study site. Tree families were ranked by decreasing size according to their AGC in each site. ...76
9 Table 3-1 Goodness of fit (BIC, marginal and conditional R2) of the best model, coefficients (β),
standard error (SE), and p-values (significant values are in bold) of explanatory variables retained for each C pool. In all cases, logging intensity range between 0 and
55% of initial biomass removed (n = 15). ...89
Table 3-2 Pre-logging forest structure and logging intensity at 0.25-ha subplot scale: number of pre-logging stem (tree), pre-logging basal area (m2) pre-logging biomass (Mg), number of tree harvested (tree), tree biomass harvested (Mg), number of tree killed (tree), tree biomass killed (Mg) due to logging, and logging intensity (%) in 0.25-ha subplot level. ...93
Table 3-3 Decay classes and corresponding wood density (± standard error). Letters figure out significant difference among classes at P <0.05. ...94
Table 3-4 The average (± standard error) of C stocks (Mg C ha-1) by C pools and logging intensity group. Logging intensity was grouped into 3 classes corresponding to 0-33rd, 34-66th, and 67-100th percentiles of the logging intensity distribution, respectively. Letters figure out significant differences at P <0.05 after pairwise comparisons using Dunn’s test. ...94
Table 3-5 The average (± standard error) of proportion C pools by total C stocks (%) for each logging intensity group. Logging intensity was grouped into 3 classes corresponding to 0-33rd, 34-66th, and 67-100th percentiles of the logging intensity distribution, respectively. Letters figure out significant differences at P <0.05 after pairwise comparisons using Dunn’s test. ...94
Table 3-6 Model fit statistics for mixed-effect models of C pools included logging intensity, mean slope, clay content, phosphorus content, and nitrogen content as fixed effects and plot as a random effect. Bold number on p-value shows significant variables (P < 0.05). ...95
Table 3-7 The most three parsimonious models for each C pool explaining the variability of C stocks in MRF ranked according to increasing of BIC. ...96
Table 3-8 The relative importance value (%) of logging intensity, mean slope, clay, nitrogen, and available phosphorus content in the soil for each C stock. In all cases, logging intensity range between 0 and 55% of initial biomass removed (n = 15). ...97
Table 3-9 The relative importance value (%) of logging intensity, mean slope, clay, nitrogen, and available phosphorus content in the soil for each C stock. Logging intensity range between 1.5 and 55% of initial biomass removed (excluding 0% of logging intensity, n = 13). ...98
Table 3-10 Eigenvalue and percentage of variance for each principal component. ...100
Table 3-11 The contribution for each soil variable in each dimension. ...101
10 Table 4-1 The goodness of fit (BIC, marginal and conditional R2), coefficients (β), standard errors
(SE), and p-values (P, significant values are in bold)of the best model retained for each layer in MRF. ...111 Table 4-2 The goodness of fit (BIC, marginal and conditional R2), the coefficient (β), standard
error (SE), and p-value (P, significant values are in bold)of the best model retained for each accumulation SOC stocks in MRF. ...112 Table 4-3 Pre-logging forest structure, biomass loss, and logging intensity (%) at 0.25-ha subplot scale. Pre-logging forest structure includes number of logging stem (tree), pre-logging basal area (m2), and pre-logging biomass (Mg). Biomass loss includes number
of tree harvested (tree), tree biomass harvested (Mg), number of tree killed (tree), and tree biomass killed (Mg) due to logging. ...118 Table 4-4 Logging intensity, slope, litter C stock and by layer C concentration (Walkley-Black), available P (Bray) and clay content of the investigated 0.25-ha plots. ...118 Table 4-5 Model-averaged importance (%) of each fixed factor included in the model i.e. logging intensity, slope, litter, clay, and available phosphorus for each accumulated depth. ...119 Table 4-6 Model-averaged importance (%) of each fixed factor included in the model i.e. logging intensity, slope, litter, clay, and available phosphorus for each depth. ...120
11
List of Figures
Figure 1-1 Hypothesized effect of logging intensity on C stocks under different logging intensities (A) and hypothesized of the dynamic of each C pool following logging (B). Lines in panel B show the dynamic of each C pool along time. ...26 Figure 1-2 Studies on C stocks in tropical forests based on literature searches in ISI Web of Science and Scopus database. Panel A shows the number of C stock studies in intact, logged, and secondary forests (n = 69 studies). The Boolean operators used for panel A was tropical forest AND (carbon stock OR deadwood stock OR litter OR soil organic carbon OR coarse woody debris OR above ground biomass). Panel B shows the breakdown studies on each C pool and total C stocks (AGC, BGC, deadwood, litter, and SOC) in logged forests (n = 25 studies). The Boolean operators used for panel B was: (selective logging OR reduced impact logging OR conventional logging OR logging intensity OR degraded forest) AND tropical forest AND (carbon stock OR deadwood stock OR litter OR soil organic carbon OR coarse woody debris OR above ground biomass). Panel A and B only show field-based studies, excluding modeling and remote sensing studies. Panel C shows a comparison of the average value of each C pool (Mg C ha-1) between intact and logged forests., Panel D shows the proportion
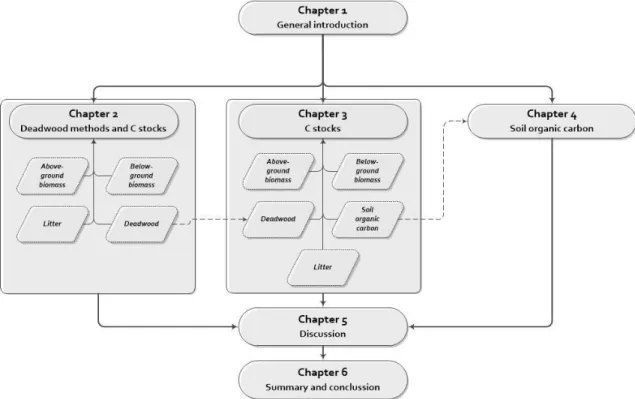
of each C pool (%) to total C stocks. The white font numbers (panels A and B) show the number of studies for each pie. The error bars in panel C indicate one standard error of the mean (Mg C ha-1 ± SE). ...28
Figure 1-3 Forest status in Borneo based on Gaveau et al. (2014). Study sites of this thesis are in Malinau (white box) and Berau (blue boxes). ...35 Figure 1-4 Thesis structure and connections between chapters. ...39 Figure 2-1 Map of study sites in Berau, East Kalimantan and sampling design set up at each of the 3 sites sampled: For LIS, dashed lines show 300-m transect lines located 50 m apart of each other; FAS are illustrated with blue squares (10 m x 10 m each) randomly placed along the transect lines in each 100-m section. Each 300-m line transect and a set of 3 FAS is considered as an independent sampling unit, resulting in 5 sampling units by site. Green areas (20 m x 300 m each) were used for tree inventory. Black squares (1 m x 1 m each) within FAS were used for litter sampling. ...44 Figure 2-2 The coefficient of variation (%) of mass by number of sampling unit estimated by FAS and LIS. Both masses estimated by FAS and LIS were simultaneously predicted using decay class and penetrometer. Each point represents 1000 simulations of each method. The horizontal dashed line shows an illustrated 10% coefficient of variation. ...51 Figure 2-3 Above-ground carbon (AGC, Mg C ha-1), cumulated AGC (Mg C ha-1), and cumulated
percentage to total AGC (%) of 10 species in each site. ...54 Figure 2-4 Above-ground carbon (AGC, Mg C ha-1), cumulated AGC (Mg C ha-1), and cumulated
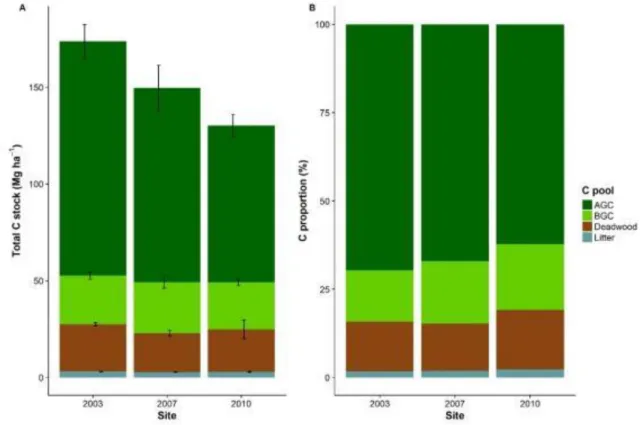
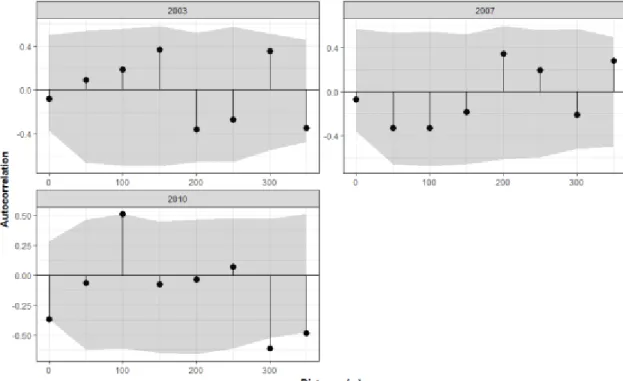
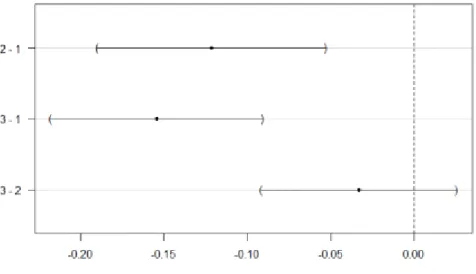
12 Figure 2-5 Total C stocks (A) and proportion of C (B) for each pool among sites. Error bars indicate one standard error of the mean. ...56 Figure 2-6 Spatial autocorrelation of deadwood stocks for each site. Grey areas show 95% CI.61 Figure 2-7 Pair-wise comparisons from Tukey’s HSD for fallen deadwood stocks estimated by FAS and LIS and total deadwood stocks estimated by FAS presented with 95% confidence intervals after simple linear model among sites. Any CIs that do not contain 0 are statistically different from zero. ...61 Figure 2-8 Pair-wise comparisons from Tukey’s HSD for the time required among method presented with 95% confidence intervals. Any CIs that do not contain 0 are statistically different from zero. ...62 Figure 2-9 Pair-wise comparisons from Tukey’s HSD for fallen deadwood volume estimated by FAS and LIS and total deadwood volume estimated by FAS presented with 95% confidence intervals after simple linear model among sites. Any CIs that do not contain 0 are statistically different from zero. ...63 Figure 2-10 Pair-wise comparisons from Tukey’s HSD for each decay class presented with 95% confidence intervals. Any CIs that do not contain 0 are statistically different from zero. ...66 Figure 2-11 Asymptotic exponential model for wood density prediction using dynamic penetrometer as a function of penetration index...66 Figure 2-12 The residual plot of the penetrometer model. ...67 Figure 2-13 Comparison between actual and predicted wood density by model. The solid black line is a linear model with 95% CI. The dashed black line is a reference line (1:1). ...67 Figure 3-1 Total C, AGC>20, BGC>20, and deadwood stocks along a gradient of logging intensity (n
= 15 subplots, P <0.05). The solid black line is a linear model with 95% confidence interval. The solid blue line is a linear model excluding 0% logging intensity with 95% confidence interval. ...86 Figure 3-2 AGC5-20, BGC5-20, litter and SOC stocks along a gradient of logging intensity (n = 15
subplots, P >0.05). The solid black line is a linear model with 95% confidence interval. The solid blue line is a linear model excluding 0% logging intensity with 95% confidence interval. ...87 Figure 3-3 Total C stocks (A) and its proportion (B) for each pool in different logging intensity group 16 years after logging. Logging intensity was grouped into 3 classes corresponding to 0-33rd (0-2.1%), 34-66th (2.1-19%), and 67-100th (19-57%)
percentiles of the logging intensity distribution, respectively. The stocks and proportions of AGC>20, BGC>20, AGC5-20, BGC5-20, deadwood, and litter were averaged
from 28 subplots, while SOC from 15 subplots. Error bars indicate one standard error of the mean...88 Figure 3-4 Spatial autocorrelation of logging intensity for each plot. In plot R06, there was a quite strong autocorrelation for the first 30 m distance class as the values were larger than
13 expected the null hypothesis of no autocorrelation (95% CI). After 30 m, logging intensity appears to be independent. ...99 Figure 3-5 Spatial autocorrelation of above-ground tree biomass for each plot. Grey areas show 95% CI. ...99 Figure 3-6 Scree plot for each principal component/dimension. ...100 Figure 4-1 Variability of (A) concentrations of soil organic C (mg g-1), (B) available phosphorus
(µg g-1), and (C) clay content (%) by each soil layer. Bars show standard error of the
mean and letters indicate significant differences among layer after Tukey’s post-hoc contrasts (P <0.05). ...108 Figure 4-2 Variation of SOC stocks along soil mass across 15 0.25-ha subplots (A) and SOC stocks (B) by layer (light gray solid bar) and accumulated SOC stock (dark grey solid bar). Bars show standard error of the means. Letters show significant differences among layers. ...109 Figure 4-3 SOC stocks along a gradient of logging intensity. The solid black line shows a linear model with 95% confidence interval (n = 15). The solid blue line shows a linear model excluding plot where no logging ioccured with 95% confidence interval (n = 14). .110 Figure 4-4 The relative importance (%) of logging intensity, slope, clay, available phosphorus, and litter C stocks in determining SOC stocks by layer (A) or accumulated across layers (B). Negative or positive importance values indicate the influence of each variable on SOC stocks. Letter “o” indicates when a variable is spanning 0. Asterisks show variables retained in the most parsimonious models at each layer. ...113 Figure 5-1 The value of C stocks (Mg C ha-1) 16 years following logging predicted from the linear
models presented in Chapter 3. Logging intensity 1% (of the pre-logging biomass lost) is assumed as unmanaged or logged at low intensity, 20% is assumed as the typical logging intensity employed in Indonesian production forests, and 35% is assumed as a high logging intensity. ...123 Figure 5-2 Percentage of the difference of deadwood (A) and litter (B) stocks estimated through a default factor (UNFCCC (2015) relative to the observed values (n=28 subplots). 124 Figure 5-3 Percentage of the difference of total C stocks estimated through expansion factor relative to observed values (A) and the comparison of total C stocks when deadwood and litter C stock are estimated by direct measurement and the use of default factor in each logging intensity group (B). Logging intensity was grouped into 3 classes i.e. unmanaged or logged at low intensity (0-2% of initial biomass lost), medium intensity (2-20%), and high intensity (>20%). The error bars in Panel B indicate one standard error of the mean of each logging intensity group. ...125 Figure 5-4 Linear models between species rarefaction index (A) and Shannon-Wiener index (B) on AGC, BGC, and total C in tree biomass. The solid blue line is a linear model with 95% confidence interval. ...129
14
Acknowledgments
First of all, I want to thank God Almighty for giving me strength and health to finish my doctoral study. “QS 3: 173: … Sufficient for us is Allah, and [He is] the best Disposer of affairs”.
I would like to thank the Education, Audiovisual, and Culture Executive Agency of the European Commission through the Erasmus Mundus Joint Doctorate program - Forest and Nature for Society (FONASO) (contract no. 2014-2) for giving me the opportunity to pursue doctoral education in AgroParisTech (France) and University of Copenhagen (Denmark). This study was also carried out in the framework of the Tropical managed Forest Observatory (TmFO) project, supported by CIRAD and the Forest, Tree, and Agroforestry Research Program of the Consultative Group on International Agricultural Research (CGIAR). I would also like to thank Cibodas Botanic Gardens – Indonesian Institute of Sciences (LIPI), to give me a permission to pursue this doctoral study.
I am thankful my respected supervisor’s team Dr. Plinio Sist, Dr. Ervan Rutishauser, and Prof. Karsten Raulund-Rasmussen for their outstanding supervision during my study. Without your support, guidance, mentorship, and patience this research would not have been possible. To Ervan, I especially owe thanks for the great discussion we have had and for your patience in teaching me to learn R and also for helping and guiding me to analyze the data.
I would also like to thank Dr. Vincent Freycon, Dr. Sylvie Gourlet-Fleury, Prof. Jørgen Bo Larsen, Dr. Martial Bernoux, Dr. Raphaël Manlay, Dr. Christian Cilas, and the late Dr. Sandra Brown for participating on my doctoral supervisory committee. Your support and critical way of thinking helped me to formulate the approaches to my doctoral project. The support from FONASO team: Prof. Carsten Smith-Hall (FONASO Co-ordinator), Birgitte Krogh Pederson, Mia Brand, and Ida Marie Krogager Noes (FONASO Secretariat), is also appreciated.
I am grateful to Murielle Salas and Myriam Niel (AgroParisTech); Annie Molina, Pascale Hatot, Helene Grammatico (UR Forêts et Sociétés, CIRAD) and Barbro Haar (University of Copenhagen) for all the support provided during my study in Montpellier and Copenhagen. A big thanks to all the staff and fellow students in UPR Forêts et Sociétés (CIRAD) and Institut for Geovidenskab og Naturforvaltning (University of Copenhagen). To Amah, Camille, Clément, Fanny, Florian, Fritz, Gabriela, Gaël, Giacomo, and Isa in Montpellier; and Anders, Jonas, Rodrigo, and Yan Peng in Copenhagen; thank you for all your help and the fun we had during the last three and a half years.
I am also grateful to PT Hutansanggam Labanan Lestari, PT Inhutani II Unit Malinau, CIFOR, and ITTO Fellowship Program 2015 (Reference no. 008/15A) for permission and support during the fieldwork in Indonesia. Special thanks to all my field assistance: Pak Rustandi, Pak Pujiansyah, Edy Supriyono, Dendi, Sunar, Samsul Hidayat, Prapto Subagio, Martinus, Jesly, and Ari. I would
15 like also to thank Dr. Yu Fukasawa (Cardiff University) and Dr. Julien Demenois (CIRAD) for comments and constructive inputs on the specific chapter.
Saya berterima kasih kepada teman-teman Indonesia terutama PPI Montpellier dan PPI Denmark. Tidak lupa juga saya sampaikan terima kasih kepada keluarga besar Franco-Indonésien yang ada di Montpellier. Terima kasih atas segala sesuatunya yang tentu saja telah mengisi cerita kehidupan kami menjadi lebih berwarna selama tinggal di Montpellier. Khususnya untuk PPI Denmark: Mas Luthfi, Mas Khairul, Mas Syariful, Mas Malik, Bang Jaya, Kang Rizky, Mas Zetra, dan lainnya, terima kasih atas kebersamaannya selama tinggal di Kopenhagen. Untuk keluarga besar di Kuningan (Jawa Barat) dan di Purwodadi (Jawa Tengah), I owe a great deal of gratitude. Finally, a very special thanks to my lovely family: my wife (Ika Sari Rahadianti) and our children (Indrakshi Sharia Raroza, Alifiandra Hamengku Raroza, and Edwige Himeka Rozak). Terima kasih atas kebersamaan, kekompakan, dan kesabarannya selama ini. Indeed, you are my strength. “Mother Theresa: what can you do to promote world peace? Go home and love your family”.
16
List of acronyms
AFOLU : Agroforestry, Forestry, and Other Land Use
AGB : Above-Ground Biomass
AGC5-20 : Above-Ground Carbon stored in AGB (tree DBH 5-20 cm)
AGC>20 : Above-Ground Carbon stored in AGB (tree DBH >20 cm)
BGB : Below-Ground Biomass
BGC>20 : Below-Ground Carbon stored in BGB (tree DBH >20 cm)
BGC5-20 : Below-Ground Carbon stored in BGB (tree DBH 5-20 cm)
C : Carbon
CGIAR : The Consultative Group on International Agricultural Research CIFOR : Center for International Forestry Research
CIRAD : Centre de cooperation International en Recherche Agronomique pour le Développement (the French agricultural research centre for international development)
CO2 : Carbon dioxide
CVL : Conventional Logging DBH : Diameter of Breast Height
DF : Default Factor
FAO : Food and Agricultural Organization FAS : Fixed-Area Sampling method FSC : Forest Stewardship Council
HLL : Hutansanggam Labanan Lestari, an FSC-certified forest concessionaire in Berau (East Kalimantan)
IPCC : The Intergovernmental Panel on Climate Change ITTO : International Tropical Timber Organization LIS : Line-Intersect Sampling method
MRF : Malinau Research Forests, formerly known as Bulungan Research Forests REDD+ : Reducing Emissions from Deforestation and forest Degradation
RIL : Reduced-Impact Logging
SFM : Sustainable Forest Management SOC : Soil Organic Carbon
STREK : Silvicultural Treatment for the Regeneration of logged-over forest in East Kalimantan
TmFO : Tropical managed Forest Observatory
TPTI : Tebang Pilih Tanam Indonesia (the Indonesian selective logging and planting system)
17
Abstract
Tropical forests are a major reservoir of biodiversity and carbon (C), playing a pivotal role in global ecosystem function and climate regulation. However, most of the tropical forests, especially Bornean forests in Southeast Asia, are under intense pressure and threatened by anthropogenic activities such as logging, mining industry, agriculture and conversion to industrial plantation. In 2010, the area of production forests in Borneo was 26.8 million ha (approx. 36% of the total land area of Borneo) including 18 million ha (approx. 24%) of logged forests. Production forests are thus emerging as a dominant land-use, playing a crucial role in trading-off provision of goods and maintenance of ecosystem services, such as C and biodiversity retention.
Selective logging is known to reduce both above- and below-ground biomass through the removal of a few large trees, while increasing deadwood stocks through collateral damages. By creating large gaps in the canopy, microclimates in the understory and on the forest floor change locally speeding up the decomposition of litter and organic matter. The extent of incidental damages, canopy openness, as well as the speed of C recovery, was shown to be primarily related to logging intensity. However, empirical evaluations of the long-term effect of logging intensity on C balance in production forests remain rare.
The present thesis aims to assess the long-term effect of logging intensity on C sequestration in a north Bornean Dipterocarp forests (Malinau District, North Kalimantan) logged in 1999/2000. Five main C pools, namely above-ground (AGC) and below-ground (BGC) carbon in living trees, deadwood, litter, and soil organic carbon (SOC) were estimated along a logging intensity gradient (ranging from 0 to 57% of initial biomass removed).
Our result showed that total C stocks 16 years after logging, ranged from 218-554 Mg C ha-1 with
an average of 314 Mg C ha-1. A difference of 95 Mg C ha-1 was found between low logging
intensity (<2.1% of initial biomass lost) and high logging intensity (>19%). Most C (approx. 77%) was found in living trees, followed by soil (15%), deadwood (6%), and a minor fraction in litter (1%). The imprint of logging intensity was still detectable 16 years after logging, and logging intensity thus was the main driver explaining the reduction of AGC>20, BGC>20, deadwood, and
total C stocks and an increase in deadwood. Solely, logging intensity explained 61%, 63%, 38%, and 48% of variations of AGC>20, BGC>20, deadwood, and total C stocks, respectively. Logging
intensity also significantly reduced SOC stocks in the upper 30 cm layer. For total SOC stocks (0-100 cm), the negative influence of logging intensity was still perceptible, being significant in conjunction with other variables.
Our results quantify the long-term effect of logging on forest C stocks, especially on AGC and deadwood. High logging intensity (50% reduction of initial biomass) reduced total C stocks by 27%. AGC recovery was lower in high logging intensity plots, suggesting lowered forest resilience to logging. Our study showed that maintaining logging intensity, below 20% of the initial biomass, limit the long-term effect of logging on AGC and deadwood stocks.
Keywords: Above-ground biomass; below-ground biomass; deadwood; Dipterocarp forests; litter; tropical logged forests; soil organic carbon
18
Résumé (français)
Les forêts tropicales constituent le principal réservoir de biodiversité et de carbone (C), jouant un rôle central dans le cycle du carbone, le maintien de la biodiversité, la régulation du climat et l’équilibre fonctionnel général de la biosphère. Cependant, la plupart des forêts tropicales, en particulier les forêts de Bornéo en Asie du Sud-Est, subissent une pression intense et sont menacées par des activités anthropiques telles que l'exploitation forestière, l'industrie minière l’agriculture et la conversion en plantations industrielles. En 2010, la superficie des forêts de production de Bornéo était de 26,8 millions d’ha (environ 36% de la superficie totale de l’île, dont 18 millions ha (environ 24%) déjà exploités. Par conséquent, les forêts de production occupent donc une place importante à Bornéo et jouent un rôle essentiel dans la compensation des biens fournis et la maintenance des services écosystémiques, tels que la conservation du C et de la biodiversité.
L’exploitation sélective réduit la biomasse aérienne et souterraine par l’élimination de quelques grands arbres, et augmente les stocks de bois mort par des dommages collatéraux. En créant des trouées dans la canopée, le microclimat dans les sous-étages et au sol change localement et accélèrent la décomposition de la litière et de la matière organique. L'importance des dégâts, de l'ouverture de la canopée et de la rapidité du rétablissement du C s'est avéré principalement liée à l'intensité de l'exploitation forestière. Cependant, les évaluations empiriques de l'effet à long terme de l'intensité de l'exploitation forestière sur l'équilibre du C dans les forêts de production restent rares.
La présente thèse se concentre principalement sur l'évaluation de l'effet à long terme de l'intensité de l'exploitation forestière sur la séquestration de carbone dans une forêt à Diptérocarpées de Nord Bornéo (District de Malinau, Kalimantan Nord) exploitée en 1999/2000. Cinq principaux réservoirs de C, à savoir le C aérien dans les arbres vivants (AGC), le C souterrain dans les arbres vivants (BGC), le bois mort, la litière et le C organique du sol (SOC) ont été estimés le long d’un gradient d'intensité d'exploitation (0-57% de la biomasse perdue).
Nos résultats ont montré que les stocks totaux de C, 16 ans après l'exploitation, variaient de 218 à 554 Mg C ha-1 avec une moyenne de 314 Mg C ha-1. Une différence de 95 Mg C ha-1 a été
observée entre une faible intensité d'exploitation forestière (<2,1% de la biomasse initiale perdue) et une intensité d'exploitation élevée (>19%). La plus grande partie du C (environ 77%) était présente dans les arbres vivants, suivie par les stocks du sol (15%), les stocks de bois mort (6%) et une fraction mineure des stocks de litière (1%). L'empreinte de l'intensité de l'exploitation forestière était encore détectable 16 ans après l'exploitation et a été le principal facteur expliquant la réduction des AGC>20, BGC>20, du bois mort et des stocks de C et une
augmentation du bois mort. L'intensité de l'exploitation expliquait à elle seule 61%, 63%, 38% et 48% des variations des AGC>20, BGC>20, du bois mort et des stocks de C totaux, respectivement.
L'intensité de l'abattage a également réduit considérablement les stocks de SOC dans la couche supérieure de 30 cm. Pour l'ensemble des stocks de SOC (0-100 cm), l'influence de l'intensité de l'exploitation était encore perceptible, en conjonction avec d'autres variables.
Nos résultats quantifient l'effet à long terme de l'exploitation forestière sur les stocks de C forestier, en particulier sur les AGC et les bois morts. L'intensité élevée de l'exploitation forestière (réduction de 50% de la biomasse initiale) a réduit les stocks totaux de C de 27%. La récupération de l'AGC était plus faible dans les parcelles d'intensité d'exploitation forestière
19 élevée, ce qui suggère une résilience plus faible de la forêt à l'exploitation forestière. Par conséquent, une intensité d'exploitation forestière inférieure à 20%, devrait être envisagé afin de limiter l'effet à long terme sur les AGC et le bois mort.
Mots-clés : biomasse aérienne ; biomasse souterraine ; bois morts ; Forêt de Diptérocarpées ; litière ; forêt tropicales exploitées ; carbone organique du sol
20
Resumé (Danks)
Tropiske skove er rige på biodiversitet og er samtidigt et stort kulstoflager (C), og spiller dermed en afgørende rolle i globale økosystemfunktioner og regulering af klimaet. Imidlertid er de fleste af de tropiske skove, under stærkt pres og truet af menneskelige aktiviteter som skovhugst, minedrift og omdannelse til monokulturplantager, især på Borneo i Sydøstasien. I 2010 nåede arealet med skovhugst på Borneo 18 mio. ha (ca. 24% af Borneos samlede areal), eller 26,8 mio. ha (ca. 36%) hvis også skove officielt afsat til træproduktion men hvor hugst endnu ikke er gennemført regnes med. Produktionsskove er således blevet en dominerende arealanvendelse, der spiller en afgørende rolle i handel af varer og vedligeholdelse af økosystemtjenester, såsom kulstoflagring og biodiversitetsbeskyttelse.
Selektiv hugst er kendt for at reducere både den over- og underjordisk biomasse gennem fjernelse af nogle få store træer, samtidig med at mængden af dødt ved øges gennem følgeskader. Ved at skabe store huller i kronelaget ændres mikroklimaet i underskoven og på skovbunden lokalt og fremskynder nedbrydning af førne og organisk materiale. Omfanget af hændelige skader, kronetætheden, samt hastigheden hvorved kulstoflagre genopbygges er primært relateret til hugstintensiteten. Imidlertid er empiriske undersøgelser af den langsigtede effekt af hugstintensiteten på kulstofbalancen i produktionsskove sjældne.
Denne afhandling undersøger den langsigtede effekt af hugstintensitet på kulstofbindingen i Dipterocarp-skovene på Borneo. De fem største kulstoflagre, nemlig overjordisk (AGC) og underjordisk (BGC) kulstof i levende træer, dødt ved, førne og jordens organisk kulstof (SOC) blev estimeret langs en gradient af hugstintensitet (fra 0 til 57% biomassefjernelse) i Malinau Research Forests (MRF, i Nord Kalimantan) skovet i 1999/2000.
Vores resultat viste, at de samlede kulstoflagre varierede fra 218-554 Mg C ha-1 med et
gennemsnit på 314 Mg C ha-1, 16 år efter skovning i MRF. En forskel på 95 Mg C ha-1 blev fundet
mellem lav hugstintensitet (<2,1% af den oprindelige biomasse fjernet) og høj hugstintensitet (>19%). Størstedelen kulstof (ca. 77%) blev fundet i levende træer, efterfulgt af SOC-lagret (15%), dødt ved (6%) og en mindre fraktion i førne (1%). Effekten af skovdrift var stadig påviselig 16 år efter, med hugst som det primære forklarende parameter, der forklarede reduktionen af AGC>20, BGC>20, dødt ved og totalt kulstoflager og en stigning i dødt ved. Hugstintensiteten alene
forklarede 61%, 63%, 38% og 48% af variationen af henholdsvis AGC>20, BGC>20, dødt ved og
totalt kulstoflager. Hugstintensiteten reducerede også SOC-lagrene betydeligt i det øverste 30 cm lag. For det samlede SOC-lager (0-100 cm) var indflydelsen af hugstintensitet stadig synlig, idet den var signifikant i kombination med andre variabler.
Ved modellering kvantificerer vi den langsigtede effekt af skovhugst på kulstoflagrene, især på AGC og dødt ved. Høj hugstintensitet (50% reduktion af oprindelige biomasse) reducerede samlede kulstoflagre med 27%. Genopbygningen af AGC var lavere ved høje hugstintensiteter, hvilket tyder på nedsat resiliens. Derfor bør man overveje at holde hugstintensiteten, f.eks. under 20%, for at begrænse den langsigtede effekt af hugst på AGC og dødt ved.
Nøgleord: Overjordisk biomasse; underjordisk biomasse; dødt ved; Dipterocarp skov; førne; skovdrift; jordens organisk kulstof
21
Publications
Published
Rozak, A.H., E. Rutishauser, K. Raulund-Rasmussen, P. Sist. 2018. The imprint of logging on tropical carbon stocks: A Bornean case study. Forest Ecology and Management 417: 154-166. DOI: 10.1016/j.foreco.2018.03.007
Manuscript under review in Forest Ecosystems
Rozak, A.H., E. Rutishauser, P. Sist. How do we estimate deadwood stocks in disturbed forests? A carbon stocks assessment study in Bornean logged forests
Manuscript to be submitted to Plant and Soil
Rozak, A.H., E. Rutishauser, K. Raulund-Rasmussen, V. Freycon, P. Sist. Depletion of soil organic carbon stocks in Bornean logged forests.
Communication in conference
a. Rozak, A.H., K. Raulund-Rasmussen, V. Freycon, P. Sist, E. Rutishauser. 2017. Logging intensity, litter, and slope drive soil organic carbon variability in Dipterocarp logged forests. BES, GFÖ, NECOV and EEF Joint Annual Meeting: Ecology Across Borders. Ghent (Belgium): 11-14 December 2017. Oral presentation.
b. Rozak, A.H., P. Sist, E. Rutishauser. 2016. Deadwood in logged-over Dipterocarp forests of Borneo. The 53rd Annual Meeting of the Association for Tropical Biology and Conservation (ATBC).
Montpellier (France): 19-23 June 2016. Oral presentation.
Workshop
Tropical forest biodiversity and carbon storage: Developing a roadmap for a long-term forest monitoring network in Indonesia. Organized by Manchester Metropolitan University (United Kingdom) and Forest Research and Development Centre, Ministry of Environment and Forestry (Indonesia). Bogor 13-16 September 2016. Output: Brearly, F.Q., W.C. Adinugroho, F. Aini, …, A.H. Rozak, …, C.O. Webb. Opportunities and challenges for an Indonesian forest-monitoring network. Manuscript is under review in Annals of Forest Science.
The contribution of Andes Hamuraby Rozak to the papers included in this thesis:
Andes Hamuraby Rozak contributed to the research design, data collection in the field, data analysis, interpretation of the results, and writing the text for all papers (Chapter 2, 3, and 5).
22
1
General introduction
One of the main pressures faced by Bornean forest i.e. forest conversion to a non-forest land-use type such as industrial plantation and coal mining. This picture shows the borders between coal mining area and a Dipterocarp forest nearby Malinau Research Forests (North Kalimantan).
23
1.1. Tropical forests and carbon issue
While tropical forests only represent 12% of the global land surface (Keenan et al. 2015), they are estimated to be home for more than half of all known species (Dirzo and Raven 2003b; Wright 2005). They also provide important societal and environmental functions, such as timber production (e.g. Keller et al. 2007; Sasaki, Chheng, and Ty 2012), climate regulation (e.g. Bawa and Markham 1995; Bonan 2008) as well as nutrient and carbon (C) cycling (e.g. Baccini et al. 2017; Le Quéré et al. 2018; Malhi 2012; Qie et al. 2017; Vitousek and Sanford 1986). Trees are the most emblematic feature of tropical forests, forming a subtle interface between the ground and the atmosphere. Through photosynthesis, trees are sequestering C above ground in their trunk, branches, and leaves (also known as above-ground biomass, AGB), and below ground in their roots (referred to as below-ground biomass, BGB). Trees are also the important source of organic carbon in the soil (SOC) through root exudation which can account for up to 10% of total photosynthetic production (Jones, Hodge, and Kuzyakov 2004; Jones, Nguyen, and Finlay 2009). When trees die, biomass generally decomposes within a few decades (Hérault et al. 2010; Chambers et al. 2000), and contribute to form large stocks of deadwood (Pfeifer et al. 2015; Osone et al. 2016). While most of this organic material is re-emitted to the atmosphere through microbial respiration, a small fraction enters soils and enriches the SOC. Summing up the C stored in these different pools at landscape scale places tropical forests among the C-richest ecosystems (Pan et al. 2011). Indeed, tropical forests are estimated to store c. 250 Gt C in living trees (Saatchi et al. 2011) and account for 40 Pg C yr-1 (or 35%) of terrestrial gross primary
productivity (Beer et al. 2010).
Despite all the benefits delivered by tropical forests, they are still disappearing or being depleted at high rates due to anthropogenic activities (Achard et al. 2014; Baccini et al. 2017; Potapov et al. 2017). Tropical forests contribute approx. 30% of global forest cover loss, at a rate increasing by 0.2 million ha yr-1 from 2000 to 20121 (Hansen et al. 2013). The proximate cause
of deforestation is a combination of agricultural expansion and infrastructure expansion (Geist and Lambin 2002; Lambin et al. 2001). In addition to deforestation, tropical forests are being degraded through timber harvesting, uncontrolled fires, and wood fuel/charcoal (Hosonuma et al. 2012). Lumping together, forest conversion to agriculture, forestry and forest degradation is responsible for about a quarter of anthropogenic greenhouse gas emission (IPCC 2014).
Agriculture, Forestry and Other Land Use (AFOLU) have contributed significantly to greenhouse gas emissions during 1970-2010 (IPCC 2014). In 2010 particularly, AFOLU represented 25% (approx. 12 Tg CO2-eq) of total annual anthropogenic emissions. For
2007-2016, C emissions from land-use, land-use change, and forestry were estimated to be 1.3 Gt C yr-1 or approx. 10% of the global C emissions (Le Quéré et al. 2018). Emissions from deforestation
and forest degradation (including logging) represent respectively 70% and 30% of AGC losses in
1 According to Hansen et al. (2013): (1) Brazil exhibited the largest decline in annual forest loss, with a high
of over 4 million ha yr-1 (2003-2004) and a low under 2 million ha yr-1 (2010-2011), and (2) Indonesia
exhibited the largest increase in annual forest loss, with a low under 1 million ha yr-1 (2000-2003) and a
24 tropical forests (Baccini et al. 2017), but varies regionally. For instance, in tropical Asia, forest degradation from the forestry sector was estimated to form up to 45% of total C emissions emitted annually in the region, of which 50% is due to logging activities.
In order to tackle C emissions due to AFOLU, the Reducing Emissions from Deforestation and forest Degradation (REDD) scheme was initiated in 2007 by the parties of the United Nations Framework Convention on Climate Change (UNFCCC) (Hein et al. 2018; Hein and van der Meer 2012). REDD+ is a beam of actions that promotes sustainable forest management (SFM), conservation, and enhancement of forest C stocks. REDD+ goes through financial incentives in countries able to prevent the exploitation or conversion of tropical forests into more lucrative land-uses. A key concept lies into sustainable forest management (SFM), broadly defined as “the process of managing forest to achieve one or more clearly specified objectives of management with regard to the production of a continuous flow of desired forest products and services without undue reduction of its inherent values and future productivity and without undue undesirable effects on the physical and social environment” (ITTO 2005). SFM practices, such as reduced-impact logging, were shown to have several advantages over conventional logging practices, notably in reducing C emissions. For instance, switching from conventional (CVL) to reduced-impact logging (RIL) in tropical production forests could reduce C emissions by 30-50% (approx. 1.5-2.1 Gg CO2 yr-1) while maintaining the level of production (approx. 166-280 m3 of
end-use wood) under a 50-yr cycle (e.g. Sasaki et al. 2016; Sasaki, Chheng, and Ty 2012). Unfortunately, RIL is not widely employed by logging industry and still has its own challenges to be solved (such as technical capacity and the enforcement of regulatory in each country) to achieve SFM, especially in tropical production forests (Nasi and Frost 2009; Putz, Sist, et al. 2008; Schulze, Grogan, and Vidal 2008).
1.2. On the importance of production forests
Production forests refer to forests designated primarily for production of timber, fiber, bio-energy, and/or non-wood forest products (FAO 2010). In tropical regions, the selective harvest of a few commercial species is the dominant practice (Putz, Sist, et al. 2008; Sist, Garcia-Fernandez, and Fredericksen 2008; Sist, Fimbel, et al. 2003). In 2010, about half of the remaining tropical forests was designated for timber production (approx. 400 million ha from a total of 780 million ha of permanent tropical forest estate, Blaser et al. 2011). From 2005 to 2010, the area of production forests in tropical regions increased by 50 million ha. Recently, logged and secondary forests have become an increasingly prominent feature of tropical landscapes and now account for a majority of the remaining forest cover in many regions. Several studies have highlighted the importance of these forests in maintaining ecosystem function and services (Edwards, Tobias, et al. 2014), notably in maintaining biodiversity (e.g. Edwards et al. 2011; Edwards, Magrach, et al. 2014; Costantini, Edwards, and Simons 2016) and affecting C stocks (e.g. Martin et al. 2015; Sist et al. 2014; Khun and Sasaki 2014a).
Commercial logging directly affects C stocks through the direct harvest of large stems and killing/smashing on non-target trees (i.e. incidental damages). By creating large gaps in the
25 canopy, microclimates change locally (Gaudio et al. 2017; Hardwick et al. 2015) and speed up the decomposition of litter (Salinas et al. 2011) and soil organic matter (Covington 1981; Fontaine et al. 2004; Raich et al. 2006). In African tropical forests, soil organic carbon content (until 100 cm depth) was shown to be strongly affected by logging, continuing to lose C up to 45 years after logging (Chiti et al. 2015). In Amazonian forests, Berenguer et al. (2014) reported contrasting results on the effect of logging on SOC in the upper layers (until depth 30 cm): (1) in Paragominas, the stocks were higher in logged (63 Mg C ha-1) compared to intact forests (43 Mg
C ha-1), while (2) in Santerém, the stocks were comparable between logged (55 Mg C ha-1) and
intact forests (57 Mg C ha-1).
The degree of forest damage, as well as the speed of C recovery, was shown to be primarily related to logging intensity (Piponiot et al. 2016; Rutishauser et al. 2015; Sist, Sheil, et al. 2003; Sist and Nguyen-Thé 2002). Above-ground C stocks recover over time through the growth of survivors and recruited trees. In Amazonia, time of recovery was shown to primarily depend on logging intensity (Rutishauser et al. 2015). Accounting for both the biomass harvested and lost due to incidental damages, Rutishauser et al. (2015) found that a 25% reduction of pre-logging AGC stock would require approx. 43 years to recover its initial value in Amazonian forests. However, even though AGC increases through tree growth post-logging, poor logging practices or high logging intensity may induce large incidental damages among non-target trees (Shenkin et al. 2015; Sist and Nguyen-Thé 2002; Sist, Sheil, et al. 2003), and generate lagged mortality of injured trees over a few decades (Blanc et al. 2009, Lussetti et al 2016). Increased mortality could potentially increase deadwood stocks (Figure 1-1) and result in negative carbon net change (Blanc et al. 2009). The persistence of increased deadwood stocks remains to be demonstrated, but will depend on decomposition rates that were shown to vary with tree species and trunk diameter (Harmon et al. 1995; Hérault et al. 2010).
26
Figure 1-1 Hypothesized effect of logging intensity on C stocks under different logging intensities (A) and hypothesized of the dynamic of each C pool following logging (B). Lines in panel B show the dynamic of each C pool along time.
As shown above, tropical forests may either be a source or sink of C driven by the magnitude of post-logging mortality and regrowth. When logged or managed, forests tend to become a net source while short after logging, and returning to no net change after a few decades (Blanc et al. 2009). Long-term C dynamics in managed forests are driven by several variables, such as logging techniques (Pinard and Cropper 2000; Sasaki et al. 2016; Sasaki, Chheng, and Ty 2012), logging intensity (Piponiot et al. 2016; Rutishauser et al. 2015), and environmental factors (Vieira et al. 2004; Piponiot et al. 2016). Understanding the recovery of C stocks and long-term C balance in managed forests is fundamental to attest their environmental and social contribution and avoid future conversion.
27
1.3. Assessing C stocks in tropical forests
Searching with a Boolean operator (as explained in Figure 1-2) in ISI Web of Science and Scopus databases, sixty-nine studies assessing C stocks in tropical forests were found. Logged forests represent about a third (25 studies) of all studies. The majority (32 studies) are located in tropical America. Generally, the number of studies assessing total C stocks (i.e. the sum of AGC, BGC, deadwood, litter, and SOC) is higher in intact than in logged forests, disregarding the logging intensity and time since logging. The mean proportion of AGC to total C stocks are higher in intact than in logged forests (55% vs 43%, respectively), while deadwood stocks are higher in logged forest than in intact forests (10% vs 25%, respectively). It results that total C stocks in intact forests is higher than in logged forests but the mean difference is only about 20 Mg C ha -1 (340 and 320 Mg C ha-1 in intact and logged forest, respectively). C pools are highly variable in
intact and logged forest, especially deadwood stocks (Figure 1-2C). This variability is likely explained by differences of management regime (such harvest intensity as well as logging techniques) and environmental conditions (such as climate and soils) among studies.
28
Figure 1-2 Studies on C stocks in tropical forests based on literature searches in ISI Web of Science and Scopus database. Panel A shows the number of C stock studies in intact, logged, and secondary forests (n = 69 studies). The Boolean operators used for panel A was tropical forest AND (carbon stock OR deadwood stock OR litter OR soil organic carbon OR coarse woody debris OR above ground biomass). Panel B shows the breakdown studies on each C pool and total C stocks (AGC, BGC, deadwood, litter, and SOC) in logged forests (n = 25 studies). The Boolean operators used for panel B was: (selective logging OR reduced impact logging OR conventional logging OR logging intensity OR degraded forest) AND tropical forest AND (carbon stock OR deadwood stock OR litter OR soil organic carbon OR coarse woody debris OR above ground biomass). Panel A and B only show field-based studies, excluding modeling and remote sensing
studies. Panel C shows a comparison of the average value of each C pool (Mg C ha-1) between intact and
logged forests., Panel D shows the proportion of each C pool (%) to total C stocks. The white font numbers (panels A and B) show the number of studies for each pie. The error bars in panel C indicate one standard error of the mean (Mg C ha-1 ± SE).
Most studies on C stocks aimed to compare specific C pool or total C stocks between logged and unlogged forests, or in comparison with other land-use types such as secondary forests or palm oil plantations (Table 1-1). Further, most studies on C stocks also only considered logged forests as a whole and did not specifically consider logging intensity as the variable tested
29 in their studies whereas this variable is a main driver influencing forest damage and C recovery (Piponiot et al. 2016; Rutishauser et al. 2015; Sist and Nguyen-Thé 2002). However, to quantify C pools in logged forests is challenging because the tree-level process of growth and death, litter production, deadwood stocks, and SOC stocks are difficult to assess with a satellite-based system (Houghton, Hall, and Goetz 2009). Even though a more advanced remote sensing technique will be launched around 2020 through the BIOMASS mission (Le Toan et al. 2011; Scipal et al. 2010), this mission will only assess above-ground biomass excluding the other C pools that contribute around 35% to total C budget (Saner et al. 2012). Further, to tracked back logging history as well as prelogging data is difficult especially, for example, in a logging concession in Indonesia.
Table 1-1 Selected studies examining the effect of logging on each C pool and total C stocks in tropical forests. Total C stocks define as the sum of above- and below ground C (AGC and BGC), deadwood C, litter C, and soil organic carbon (SOC).
Reference Region Location Purpose of the study Time after logging C pool examined (Saner et al. 2012) SE Asia Sabah, Malaysia
To estimate impacts of logging on the C balance;
To compare C stocks between logged forests and unlogged forests
22 years Total C stocks (Osone et al. 2016) SE Asia Bukit Soeharto, East Kalimantan
To investigate the combined effects of fire and logging intensity on deadwood stocks 1 month, 15 years Deadwood, AGC (Kenzo et al. 2015) SE Asia Sabah, Malaysia
To assess the forest structure and AGB in logged forests and other forest types in the region;
To assess how forest structure and AGB differ between logged forests growing on infertile and fertile soils
20 years AGC, BGC, litter (Pfeifer et al. 2015) SE Asia Sabah, Malaysia
To estimate deadwood stocks and their relative contribution to AGC; To investigate the variation of deadwood stocks and linked to forest attributes 22 years AGC, deadwood (Prasetyo et al. 2015) SE Asia Central Kalimantan, Indonesia
To monitor litter production in various periods of logging and primary forest 1, 5, 10 years Litter (Morel et al. 2011) SE Asia Sabah, Malaysia
To present mean C stock values for different land-cover types across Sabah;
To investigate the potential for ALIS-PALSAR data to differentiate oil palm plantation from forest area;
1, 5, 8, 18, 20, 38 years
30 Reference Region Location Purpose of the study Time
after logging
C pool examined
To assess generated logarithmic relationships between AGB and SAR back-scatter for estimating AGB across Sabah (Bryan et al. 2010) Papua New Guinea Makapa, PNG
To quantify forest biomass in logged and unlogged forests, and losses caused by RIL practices at the landscape scale 10 years AGC (Lasco et al. 2006) SE Asia Mindanao, Philippines
To determine AGC and BGC of the various stages of forest cover after logging;
To analyze the C budget of the sawmill and the veneer/plywood plant 1-5, 6-10, 11-15, 16-20, 21+ years AGC, litter, SOC (Pinard and Putz 1996)
SE Asia Ulu Segama, Malaysia
To describe forest biomass stores both before and after logging; To compare logging damage between conventional logging and RIL;
To quantify the C retained in biomass due to the implementation of the harvesting guidelines 3 months, 8-12 months, 12 months AGC (Berenguer et al. 2014) America Sanatrém-Belterra and Paragominas, Brazil
To evaluate the effects of anthropogenic forest disturbance (from selective logging, fire, and fragmentation) on C stocks 6-22 years Total C stocks (van der Sande et al. 2018) America Pibiri, Guyana
To test the effects of abiotic and biotic factors on biomass stocks, SOC, and productivity
1, 6 years (AGB). 19 years (litter, SOC) AGC, litter, SOC (Roopsind et al. 2017)
America Suriname To assess the recovery of AGC and timber stocks after selective logging
32 years AGC (Vidal, West, and Putz 2016) America Eastern Brazil
To evaluate the effects of conventional logging and RIL on bole volume recovery of merchantable species recovery 20 years AGC (Piponiot et al. 2016) America Amazon Basin and the Guiana Shield
To detect the main drivers and patterns of AGC recovery in logged forests;
To model the trajectory of AGC changes over time
0-30 years AGC (Rutishauser et al. 2015) America Amazon Basin
To assess the main drivers of time-to-recovery of post-logging tree C
31 Reference Region Location Purpose of the study Time
after logging C pool examined (Sist et al. 2014) America Paragominas, Brazil
To investigate the effect of logging on AGB dynamics and among tree diameter size classes;
To propose specific recommendations to improve forest management and reduce C emissions 8 years AGC (Mazzei et al. 2010) America Paragominas, Brazil
To assess the contribution of growth, mortality, and recruitment to AGB; To predict the time needed to recover its initial AGB after RIL; To propose silvicultural recommendations related to logging intensity and allowable damage rates to improve biomass recovery in selectively logged forests
3 months, 1, 2, 4 years AGC (Blanc et al. 2009) America French Guiana
To examine the contribution of tree growth and recruitment vs tree harvesting and death to changes in AGC fluxes over 20 years;
To extrapolate the long-term consequences of differences in forest dynamics after logging to AGC balance
20 years AGC
(Palace et al. 2007)
America Juruena and Tapajos, Brazil
To examine the effect of RIL to deadwood pool compared to undisturbed forest
1 year Deadwood
(Keller et al. 2004)
America Cauaxi and Tapajos, Brazil
To quantify deadwood mass in logged and unlogged forests; To quantify the generation of deadwood by both conventional logging and RIL management
1 years Deadwood
(Tchiadje et al. 2016)
Africa Cameroon To quantify the biomass that is lost in each step of post-felling activities
Just after logging
AGC
(Carlson et al. 2016)
Africa Gabon To quantify and evaluate the drivers of deadwood in logged and unlogged forests Na Deadwood (Chiti et al. 2015) Africa Ghana, Cameroon, Gabon
To evaluate the effect of selective logging on the SOC levels in intact forests;
To evaluate whether the assessment of SOC changes due to selective logging is relevant in the framework of REDD+ 10, 15, 18, 30, 45, 50 years SOC, litter
32 Reference Region Location Purpose of the study Time
after logging C pool examined (Gourlet-Fleury et al. 2013) Africa M’Baiki, Central Africa
To quantify the response of AGB and timber stock to the treatments over of 24 years;
To examine the speed of the forest recovery in relation to the logging intensity and the effect of thinning on recovery 24 years AGC (Medjibe et al. 2011) Africa Monts de Cristal, Gabon
To assess the consequences of low-intensity RIL on AGB and tree species richness
Just after logging
AGC
To conclude, most of C stocks studies in tropical rainforest mainly focus on the individual component of the total C stocks (Table 1-2). We still have a limited understanding of all C pools (AGC, BGC, deadwood, litter, and SOC) notably in forest experiencing human-induced disturbance such as a logged forest. To our knowledge, we found only one study of total C stocks in tropical logged forests of Asia (Saner et al. 2012) and one in tropical logged forests of America (Berenguer et al. 2014). We also have very few C studies in tropical logged forests of Africa (Table 1-1). Further, no such total C stocks studies investigate the impact of logging intensity which is the main factor influencing AGC dynamic in logged forests. Particularly in Bornean logged forests, studies assessing the long-term impact of logging on the five C pools remain rare. Experimental evidence on C study, especially in Indonesian Borneo, is weak because long-term studies are scarce and few experimental sites exist in logged forests (Sist et al. 2015). Especially in production forests of Indonesia, there are, so far, only two experimental sites that well recorded logging history, prelogging data, and post-logging data i.e. STREK (in Berau, East Kalimantan, see Bertault and Kadir 1998) and MRF plots (in Malinau, North Kalimantan, see CIFOR and ITTO 2002). However, most of the data only comprise living trees, while deadwood, litter, and soil organic C are still lacking. Although these three C pools represent a low stocks and proportion of the total C stocks (Saner et al. 2012), they can have an important contribution in C emissions at a regional or global scale and therefore can have significantly impact to the future of atmospheric CO2 concentration (Houghton 2012; Houghton, Byers, and Nassikas 2015).
Extrapolated to 11 million ha of Indonesian Bornean logged forests (Gaveau et al. 2014), a small loss of 2 Mg C ha-1 from the soil will lead to the loss of approx. 22 Tg C (1 Tg = 106 Mg). Therefore,
considering that 400 million ha are designated by national forest departments for timber production (Blaser et al. 2011) and these logged forests play an important role for economic growth of many tropical countries such as Indonesia (ITTO 2015), studies on the impact of logging on C stocks, particularly the impact of logging intensity, are needed. A better understanding of the effect of logging intensity on C pools will allow silvicultural practices aiming to limit the negative impact of logging on C storage to be defined. This study aims to fill this gap and give new insights on the long-term impact of logging intensity on the major C pools in a managed forest.