Combined Tensile-Compressive Biaxial Loading of Li-ion Battery Components by
Nathaniel J. Byrd
B.S., Mechanical Engineering, North Carolina State University, 2007 Submitted to the Department Mechanical Engineering
in Partial Fulfillment of the Requirements for the Degrees of Naval Engineer
and
Master of Science in Mechanical Engineering at the
Massachusetts Institute of Technology June 2018
0 Nathaniel J. Byrd, MMXVI. All rights reserved.
DISTRIBUTION A. Approved for public release: distribution unlimited.
The author hereby grants to MIT permission to reproduce and to distribute publicly paper and electronic copies of this thesis document in whole or in part in any medium now
known or hereafter created.
Signature of Author... Certified by... Accepted by... MASSACHUSETTS IN OF TECHNOLOG
JUN 2
5
201
Signature redacted
....
...
Department of Mechanical Engineering May 2018
Signature redacted
Tomasz Wierzbicki Professor Thesis SupervisorSignature redacted
...
3TITUTE Rohan Abeyaratne
Chairman, Department Committee on Graduate Studies Department of Mechanical Engineering
COMBINE TENSILE-COMPRESSIVE BIAXIAL LOADING OF LI-ION BATTERY
COMPONENTS
by
Nathaniel J. Byrd
Submitted to the Department of Mechanical Engineering on May 11, 2018 in Partial Fulfillment of the Requirements for the Degrees of Naval Engineer and Master of Science in Mechanical
Engineering
ABSTRACT
Lithium-ion batteries under a mechanical load can develop failures in the internal multi-layer structure. Due to the flammable materials required for construction, the safety of the battery has been in question since it was first developed. Internal failures can create a short circuit which may lead to thermal runaway, resulting in fire and sometimes the explosion of the battery. Due to the increasing use of lithium-ion batteries in military and consumer products, the number of incidents involving batteries has also risen and with it a growing concern for safety. The larger batteries required for unmanned vehicles and electric vehicles increase the potential for damage due to a battery fire aboard a ship or a battery damaged in a collision.
This thesis investigates the failure mechanism of internal lithium-ion battery components when subject to
a constant out-of-plane compression while applying and increasing a decoupled in-plane tension until failure. This thesis also describes the methods used to optimize the mechanical system designed to apply
constant compression while increasing tension. The results will be used to characterize and anticipate the effect of lateral compression on the failure load of lithium-ion battery cells. The existing microstructural
based finite element model can be modified to the experimental conditions in this thesis in order to compare the experimental and modeled results. This comparison will be used to refine and validate the micro model
and ultimately bring us closer to improving the design of lithium-ion batteries.
Experimental results showed there is a quantifiable relationship between the amount of pre-compression internal battery components are exposed to and the maximum failure load. In the tested 0 to 30 MPa compression range was a 40% reduction in fracture displacement and a 20% reduction in load displacement. The change in failure order, predicted by the micro model was validated by this experimental data. However, failure did not occur in the area of compression which indicates friction due to the compression had a significant effect on testing therefore a design to eliminate friction was proposed.
Thesis Supervisor: Tomasz Wierzbicki Title: Professor of Applied Mechanics
ACKNOWLEDGEMENTS
This thesis was completed with the guidance and support of several individuals, whom I would like to thank:
The guidance, instruction, and support from the MIT 2N Naval Construction and Engineering program provided by Captain Joel Harbour, Commander Weston Grey, Commander
Johnathan Page and Mary Mullowney.
Professor Tomasz Wierzbicki, the founder of the MIT Impact and Crashworthiness Lab, for his
mentoring, guidance, and enthusiasm which were essential in this research. Dr. Elham Sahraei for her support and insightful guidance in this research. The members of the Impact and Crashworthiness Laboratory for their instruction and assistance.
Finally, I would like to thank my loving family, my wife Kasey and sons Oliver and Alexander, for the love, support, encouragement, and so much more during our time in Cambridge.
BIOGRAPHICAL NOTE
Lieutenant Commander Nathaniel Byrd is from Richmond, Virginia and graduated from North Carolina State University in 2007 with a Bachelor of Science in Mechanical Engineering. He was commissioned as a Surface Warfare Officer in the United States Navy and served tours on the guided-missile destroyer USS Paul Hamilton and, after completing nuclear power training, the aircraft carrier USS Theodore Roosevelt.
In 2014, LCDR Byrd transferred in the Engineering Duty Officer (Nuclear) community and reported to the Massachusetts Institute of Technology in May of 2015 to earn a Naval Engineer's degree and a Master of Science in Mechanical Engineering. After graduation from MIT, LCDR Byrd will report to the Supervisor of Shipbuilding Newport News in Newport News, Virginia to work in the aircraft carrier refueling and complex overhaul project office.
TABLE OF CONTENTS
ABSTRACT ... 3 ACKNOW LEDGEMENTS ... 5 BIOGRAPHICAL NOTE ... 5 TABLE OF CONTENTS ... 6 LIST OF FIGURES ... 9 LIST OF TABLES ... 10 LIST OF EQUATIONS ... 10LIST OF ACRONYMS AND ABBREVIATIONS ... 11
UNITS OF MEASUREMENT ... 11
1. INTRODUCTION ... 13
1.1 C om m ercial In d u stry ... 14
1.1.1 R ap id G ro w th ... 14
1.1.2 B a ttery Inciden ts ... 1 6 1.1.3 P olicy and R eg ulations ... 18
1.2 D epartm ent of D efense ... 18
1.2.1 P la nn ed G row th ... 18
1.2 .2 D o D P o lic ... 2 1 1.2.3 D oD B attery Incidents ... 22
1.3 P rob lem Statem ent ... 2 3 2. LITERATURE REVIEW ... 24
2.1 Lithium -Ion Battery Basics ... 24
2.1.1 Construction and Operation ... 24
2.1.2 Lithium-ion Battery Properties ... 26
2.1.3 Safety Concerns ... 2 7 2.2 Impact Crashworthiness Lab at MIT ... 28
2.2.1 Prog ression of R esearch ... 28
3. TENSION COMPRESSION SYSTEM TEST DESCRIPTION ... 29
3.1 Test Equipment and Preparation ... 29
3 .1.1 IC L E q u ip m en t ... 2 9 3.1.2 Specimen Geometry and Preparation ... 31
3.2 Material Properties and Selection ... 32
3.2.2 A node and Cathode ... 36
3.3 M echanics of O peration ... 37
3.3.1 Tension M echanism ... 3 7 3.3.2 Com pression M echanism ... 38
3.3.3 Basic Procedurefor the TCS ... 40
3.4 Problem s Encountered During Previous T esting ... 40
4. OPTIMIZATION OF EXPERIMENTAL TECHNIQUE ... 40
4.1 Equipm ent and D esign ... 40
4.1.1 TCS D esig n ... 40
4.1.2 Punch Tip Geom etry ... 42
4.2 Friction ... 44
4.2.1 M aterial ... 44
4.2.2 Lubricant ... 44
4.3 A dditional O ptim ization M ethods ... 45
4.3.1 Sp ecim en G eom etry ... 45
4.3.2 F orce D istribution using F oam ... 45
4.3.3 Rate of D isplacem ent ... 46
5. R esults ... 46
5.1 Circular Separator ... 47
5. 1. 1 Exp erim ent D escription ... 47
5.1.2 D ata C ollection ... 47
5.1.3 A nalysis ... 47
S.2 Tapered M ulti-layer Sam ples ... 50
5.2. 1 Exp erim ent D escription ... 50
5.2.2 R esults ... 51
5.2.3 Exp erim ent M odifications ... 51
5.3 T rial Circular M ulti-layered Sam ple Test ... 53
5.3. 1 Exp erim ent D escription ... 53
5.3.2 R esults ... 53
5.3.3 Exp erim ent M odifications ... 55
5.4 Final Circular M ulti-layered Sam ple T est ... 55
5.4. 1 Exp erim ent D escription ... 55
5.4.2 D ata C ollection and Processing ... 55
5.4.3 A nalysis ... 58
6. SUM M ARY AND CONCLUSIONS ... 59
6.1 O bjective ... 59
6.2 T CS Experim ent O ptim ization ... 59
6.3 Conclusion ... 60
6.4 Future W ork ... 60
BIBLIO G RA PH Y ... 62
A) TCS Basic Operating Procedure... 64 B) Exam ple of an Experim ent Sum m ary ... 65
LIST OF FIGURES
Figure 1-1: Evolution of Rechargeable Batteries to Higher Energy Density [2] ... 14
Figure 1-2: Lithium-Ion Battery Price 2010-16 [3] ... 15
Figure 1-3: Evolution of Global Electric Car Stock, 2010-2016 [4]... 16
Fig ure 1-4: Chevrolet Volt Fire [5]... 16
Figure 1-5: 787 Fire in APU (left), APU Post Fire Comparison (right) [8]... 17
Figure 1-6: Desired Capability Advancements to Support Unmanned Vehicles [13]... 19
Figure 1-7: DoD Roadmap for Unmanned Maritime Systems (2013-2038) [13]... 20
Figure 1-8: DoD Roadmap for Unmanned Aircraft Systems (2013-2038) [13]... 20
Figure 1-9: DoD Roadmap for Unmanned Ground Systems (2013-2038) [13]... 21
Figure 1-10: NASA Spacesuit Li-ion Battery [8]...21
Figure 1-11: ASDS Mini-sub Damaged and Retired due to Li-ion Battery Fire [8] ... 22
Figure 1-12: Army BB-2590/U Li-ion Battery and PP-8489 Portable Charger [8]... 23
Figure 2-1: Cross Sections of Li-ion Cells [19]2...25
Figure 2-2: Li-ion Battery Charge Discharge Cycle [211]...26
Figure 3-1: INSTRON Machine (left) with TCS Installed (right)...30
Figure 3-2: Multi-Laye red Specimen ... 31
Figure 3-3: Circular Specimen Geometry3...31
Figure 3-4: Cutting Template (left) and Tapered Specimen (right) ... 32
Figure 3-5: (a) Illustration of MD, TD, +DD, -DD a separator roll; nominal stress-strain of... 34
Figure 3-6: Force-displacement curves for biaxial punch test using 1 ", 3", "Y4, & 1" diameter punches... 35
Figure 3-7: Compression test stress-strain curve (courtesy ofXiaowei Zhang [24])... 36
Fig ure 3-8: Tension M echanism ... 38
Figure 3-9: Compression Mechanism ... 39
Figure 4-1: Clamp Ring Material Discrepancy...41
Figure 4-2: Specimen Interaction with Clamp Ring ... 41
Figure 4-3: Clamp Ring Lip (left) & Machined (right)...42
Figure 4-4: Fixed Compression Area4... 43
Figure 4-5: Polymer Punch Tips (left) and Polymer Sheet Cut to Specimen Size (right)... 44
Fig ure 4-6: Foam Types Tested... 46
Figure 5-1: Separator Load-Displacement Graph...48
Figure 5-2: Maximum Load and Displacement of Separator at Failure... 48
Figure 5-3: Average Peak Load (top) and Displacement (bottom) at Different Levels of Pre-compression...49
Figure 5-4: Typical Failures Observed in Separator...50
Figure 5-5: Tapered Multi-layer Load-Displacement Graph... 51
Figure 5-6: Failures of the Tapered Multi-layer Samples...52
Figure 5-7: Trial Circular Multi-layer Sample Load-Displacement Graph... 54
Figure 5-8: Failures of Circular Multi-layered Sample... 54
Figure 5-9: INSTRON and Bluehill@ Output for Circular Multi-layer Sample Load-Displacement Graph...56
Figure 5-10: Combined and Color Coded Circular Multi-layer Sample Load-Displacement Graph... 57
Figure 5-11: Maximum Load-displacement of Circular Multi-layer Samples at Failure ... 57
LIST OF TABLES
Table 3-1: TCS Strain Gage Panel Meter 500 N Load Cell Calibration... 30
Table 3-2: M aterial Properties of Separators ... 32
Table 3-3: Material Properties of the Anode and Cathode ... 37
Table 4-1: Punch Tips Tested... 43
LIST OF EQUATIONS
Equation 1: Li-ion Chem ical Reaction... 26Equation 2: Chem ical Reaction Occurring at the Anode ... 26
Equation 3: Chem ical Reaction Occurring at the Cathode ... 26
Equation 4: Force conversion for compression ... 30
Equation 5: Compression Area3... 39
LIST OF ACRONYMS AND ABBREVIATIONS
Al - Aluminum
APU - Auxiliary Power Unit ARL - Army Research Laboratory ASDS - Advanced Seal Delivery System BEV - Battery Electric Vehicle
Cu -Copper
DoD - Department of Defense
DON - Department of the Navy
DLA - Defense Logistics Agency EV - Electric Vehicle
FAA - Federal Aviation Administration Li - Lithium
Li-ion - Lithium-ion
NDS - National Defense Stockpile
OPNAVINST - Office of the Chief of Naval
Operations Instruction PE - Polyethylene
PHEV - Plug-in Hybrid Electric Vehicle PP - Polypropylene
UNITS OF MEASUREMENT
kWh - kilowatt hour N - newton min - minute mm - millimeterMPa - mega pascal mV - millivolt
Whkg-' - watt hour per kilogram
-I
1. INTRODUCTION
When selecting a thesis topic, my goal was to make a contribution towards an area of research that has applications in the U.S. Navy and the potential for the betterment and advancement of humanity. The Impact Crashworthiness Laboratory at MIT is focused on improving the safety of Lithium-ion batteries mainly for electric vehicle applications but I believe the end result satisfies both my personal and professional thesis criteria.
I have spent almost half of my life in the U.S Navy and am intimately familiar with the limited
space, weight restrictions, and power limits faced when deploying and conducting operations on a ship. The benefits of a safe, lightweight, high power, rechargeable storage unit are too many to list. To give an example, the designs as well as operational capabilities of unmanned and autonomous vehicles not only benefit from the improvement but require power storage units such as the lithium-ion battery.
During my time deployed overseas, I realized how dependent we are on oil when a portion of my life was spent defending the Khawr al Amiyah and al-Bashrah oil terminals in the Persian Gulf, more commonly referred to as the KAAOT and ABOT oil platforms. Improving the lithium-ion battery is not going to reduce the world's dependence on oil but replacing small engines with lithium-ion batteries is a step in shifting to a cleaner energy source.
Lastly, I have always been fascinated with space, and might be stretching a little to connect my research with space travel. However, it's really not that far off, as lithium-ion batteries are already essential for power storage on the International Space Station and smaller versions are used to power NASA space suits during space walks.
I realize my thesis work is only a very small piece but according to Sir Francis Bacon, the father
of the scientific method, progress is achieved through many small advances which accumulate to produce large leaps in science and technology [1] and this is my contribution.
1.1 Commercial Industry
Research and development for lithium-ion batteries began in the 1970's and less than 2 decades later lithium-ion batteries were available for commercial use. The potential applications for both Department of Defense (DoD) and consumer products were recognized immediately which started the integration into electronic designs. The initial integration was slow at first due to the high cost; when first introduced a lithium-ion battery cost about $3,000 per kWh which was about 20 times the cost of using a lead acid battery at $150 per kWh. However, a lighter and smaller lithium-ion battery could provide the same amount of power, Figure 1-1, making them ideal for portable and personal electronics driving further research and development that continues today [1].
250
-200
-150
-.4 -C -8 100
(50
-
U.-
0-,Pb-acid'
Smaller
I I I I0
100
200
300
4(
Energy density (WhL-1)
Figure 1-1: Evolution of Rechargeable Batteries to Higher Energy Density 121
1.1.1 Rapid Growth
Lithium-ion batteries provide a compact high power source that has resulted in rapid growth of electric vehicles and small consumer electronic products such as cell phones, tablets, and laptops. As the demand for lithium-ion batteries continues to grow improvements are made to the material
F_ 0
supply chain, chemical composition, manufacturing process, price competition, and learning curve all resulting in reducing the cost per kWh, Figure 1-2. This allowed personal electronic devices to become part of everyday life and the lithium-ion batteries that power them.
$/kWh
1,000 A BNEF observed values:
900 annual lithium-ion battery price
800 A index 800 A2010-16 700 600 A 500 A 400 300 200 100 0 2010 2012 2014 2016 2018 2020 2022 2024 2026 2028 2030
Source: Bloomberg New Energy Finance
Figure 1-2: Lithium-Ion Battery Price 2010-16 131
These improvements have made large batteries affordable for consumers allowing the market for electric vehicles to expand. The Tesla model S and X demonstrated the capability of electric vehicles exceeded most expectations. This along with the movement to reduce carbon emission levels allowed the electric vehicles to gain more of the market share. Now most major automotive manufacturers are currently producing at least one version of electric vehicle. Sales of electric vehicles are growing exponentially each year in many countries and the global stock of hybrid and electric vehicles passed 1 million in 2015 and 2 million in 2016 [4], Figure 1-3. The use of lithium-ion batteries in consumer products continue to grow and larger, more powerful batteries are becoming more and more common.
---- Others SSweden . Germany SFrance SUnited Kingdom SNetherlands SNorway SJapan United States SChina -BEV 2010 2011 2012 2013 2014 2015 2016
Figure 1-3: Evolution of Global Electric Car Stock, 2010-2016 141
(D OECD/IEA 2017 Global EV Outlook, lEA Publishing. License: www.iea.org/t&c)
1.1.2 Battery Incidents
In 2012 the U.S. Department of Transportation conducted an investigation on an incident involving the destruction of a 2011 Chevrolet Volt and three nearby vehicles, Figure 1-4. The vehicle was used for safety testing 3 weeks before the incident and no damage was noted to the battery. The investigation determined that the fire originated from the Volt's Li-ion battery due to damage
sustained during the testing [5].
Before After
201 Dode Char-er Figure 1-4: Chevrolet Volt Fire 151
2.5 2.0 1 C E U U 0.0 1 .0 ---- - - -....- -.- - ... ... 0.5 ---.-..--.-.--- 7 7'.7 .- - - -...--.. - ... .. ... ... ... ...- - - ---...-...- -... + PHEtv
Several other electric vehicle fires have occurred due to damage of the Li-ion battery and casing, including Tesla. In 2013 a Tesla Model S ran over a metal object creating significant force that punctured the quarter inch armor plate and the Li-ion battery. Designed safety features minimized the extent of the incident and include: an onboard alert system which directed the owner to stop and exit the vehicle, internal firewalls to minimize spreading, and vents which directed the flames toward the road [6].
The Federal Aviation Administration (FAA) Office of Security and Hazardous Material Safety maintains records involving "Aviation Cargo and Passenger Baggage Events Involving Smoke, Fire, Extreme Heat or Explosion Involving Lithium Batteries". They currently have 191 incidents that include brief descriptions dating from March of 1991 to January 2018 [7]. These air travel and transit incidents have not been limited to passenger or cargo items, in 2013 and 2014 three separate incidents occurred involving the auxiliary power unit on the 787 planes, two on the ground in Boston, Massachusetts and Narita, Japan and another in flight Takamatsu, Japan. This resulted in the fleet being grounded for over 3 months while a world-wide investigation occurred. The National Transportation Safety Board determined the probable cause was an internal short that developed due to mechanical stresses. Thermal runaway allowed the failure to spread to multiple cells but the fires were contained in the units. This did result in the redesign of the auxiliary power unit (APU) and additional FAA certification process requirements[8].
.1A5
1.1.3 Policy and Regulations
The number of incidents involving Li-ion batteries grows with number of Li-ion batteries in use and will lead to increased policy and regulations. The safety of EVs are getting a lot of attention and manufacturers are incorporating many safety features to produce a safe consumer product. The Department of Transportation is investigating vehicle and battery design and many additional elements including: new firefighting requirements, wrecked vehicle transportation and disposal, and even minimum noise for pedestrian awareness [9]. The FAA has restrictions in place for personal electronic device Li-ion batteries as well as large shipments of Li-ion battery cargo [10]. These policies and restrictions placed on Li-ion batteries increase overall safety of the products but could negatively impact the Li-ion battery market. On the other hand increasing the safety of Li-ion batteries by improving internal structure, optimizing casing, battery placement, and incorporating safety features like firewalls, temperature monitoring, and directed ventilation would reduce regulations and improve consumer confidence in the safety of Li-ion batteries.
1.2 Department of Defense 1.2.1 Planned Growth
The impact the Li-ion battery could have on different missions and operating environments of organizations within the Department of Defense (DoD) was recognized early in development. The light weight, compact, and high power density characteristics which drove success in the commercial industry also led to the integration of Li-ion batteries into many existing systems. The military applications have a broad range and provide energy storage and power for missiles, lasers, tactical vehicles, unmanned vehicles, and military personal electronic devices such as portable reconnaissance and communication equipment. The advantages of the compact size and reduced weight are magnified when operating in the air, on the ocean surface, under water, or launching the equipment into space, Figure 1-10, since adding either weight or size comes with a significant
cost [8].
To operate in marine environments where vessels have very limited cargo space, weight is restricted by displacement, and increasing size comes with a significant hydrodynamic resistance penalty, all require a battery with advantages that Li-ion batteries offer. This is why the Department of the Navy (DON) began testing lithium-ion batteries in the late 1970's and today the Office of Naval Research continues to focus on understanding the failure modes of lithium-ion batteries.
The Army Research Laboratory continues to enhance the capability of lithium-ion batteries. Recently, their research with the University of Maryland developed an aqueous lithium-ion battery with a higher power density comparable to non-aqueous lithium batteries [11]. Over the last few years the Defense Logistics Agency (DLA) has recognized the growing importance of lithium and has listed it as a strategic material and determined a minimum amount to maintain in the National Defense Stockpile [12].
Advancements in Li-ion batteries and several other areas of technology have led to the recent focus on unmanned and autonomous vehicles and systems. In 2013 the President's Budget request for
developing, testing, and evaluating unmanned vehicles and systems was $5.6 billion over 5 years
[13]. The Unmanned Systems Integrated Roadmap (2013) describes the DoD's plan for developing
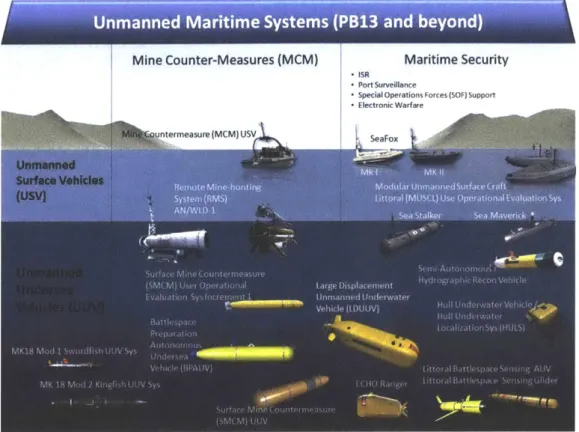
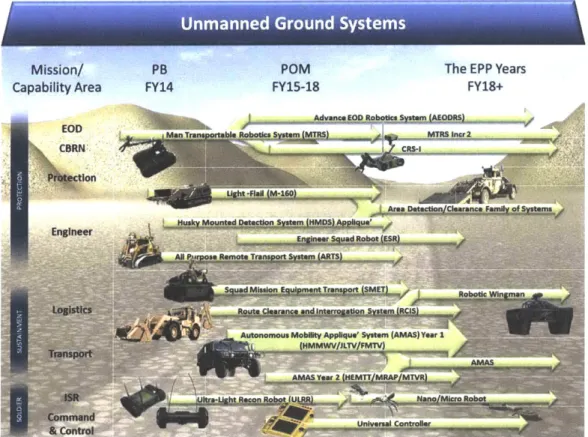
and integrating unmanned systems into operations from 2013 through 2038. An essential part of each phase of the plan are the improvements of energy storage and specifically, "Lithium-Chemistry Batteries", shown in the highlighted portions of Figure 1-6. The many different types of systems, current, and potential applications for marine, air, ground, and space systems can be seen in Figure 1-7,Figure 1-8Figure 1-9Figure 1-10 respectively.
Desired Capabilty
wear ierm: miniaxurizea rosiuon,
Navigation, Time (PNT) solutions; Miniaturized Warning and Self-Protection Systems; Adaptive Power
Senerators; Improved /Smaller
fatteries and Lithium-Chemistry
Batteries; Overall Power
Improvements without Additional
/olume, Weight and Heat.
a-ierm: improvements in
icro and Nano Technology; mproved Power and Energy
ensity.
cong term:
Improvements in Energy Storage and Energy Harvesting; Extreme
Environmental
Conditions Battery
Technology.
Mine Counter-Measures (MCM) untermeasure(MCM)USV Unmanned Surface Vehicles (USV) Maritime Security * ISR -Port Surveillance
Special Operations Forces (SOF) Support
-Electronic Warfare SeaFox
Figure 1-7: DoD Roadmap for Unmanned Maritime Systems (2013-2038) 113j
USAF .4uu
e-PnetratIng MQ-Sleaper
USAF
GroI 5 RQ-4B Global Hawk
- >13201bs USN
-> FLISO MQ-4C Triton
Persistent
GrouD4 V 0 C -- C Gray Eagle
* > 1320Olbs US<AFIS USA MQ-18 Predator RQ-5 Hunter 10 1 Tactical Group 3 -1320 lbs
< FLSO USN / USMC USA / USMC/SO M
< 250knots STUAS RQ-7Shadow U
Small Tactical , SN USN UC-ASS USN MQ-SB/C SSOCOMEUAS untundea USAF MQ-L USN UCAS FAA-XO( USC
MVCWUAS USA VTOL
Mission/ Capability Area EOD CBRN Ention Engineer
I
I
Logistics Transport -ISR Command & Control FigurePB POM The EPP Years
FY14 FY15-18 FY18+
g Mrn Tr o 2 botdcS
Ral Clesrace aralivofSwstemns
All iose Remote Transpr Sstem
Squad Mission E uiement Trane (MERbT)tcW
Autonomous Mobiity AppqSm (AMAS)Year I
AASY 2 uM
1-9: DoD Roadinap for Unmanned Ground Systems (2013-2038) 1131
EXTRAVEHICULAR MOBILITY UNIT
Batte
Figure 1-10: NASA Spacesuit Li-ion Battery 181
1.2.2 DoD Policy
Department of Defense has strict guidelines for the responsible use of Li-ion batteries on ships since a fire on a vessel when submerged or at sea cannot only impact operations but risks the safety of equipment, the vessel, sailors, and their lives. The Navy established the Lithium Battery Safety Program in 1982 in response to several incidents the DON experienced during early research
involving Li-ion batteries including a fatality [14]-[16]. The program provides detailed guidance to obtain approval to use or transport a specific Li-ion battery in a specified system. The Naval Sea Systems Command (NAVSEA) instruction states, "the purpose of the manual is to establish
safety guidelines for the selection, design, testing, evaluation, use, packaging, storage,
transportation and disposal of lithium batteries" [15]. The tests required for approval include:
* Short Circuit
" High-rate overcharge/discharge
" High temperature abuse: external heating, and internal heating " Physical: nail penetration, crush, and impact
Due to the risks associated with Li-ion batteries the thorough testing and certification requirements limits the use of equipment with Li-ion power supplies for the DON as well as DoD.
1.2.3 DoD Battery Incidents
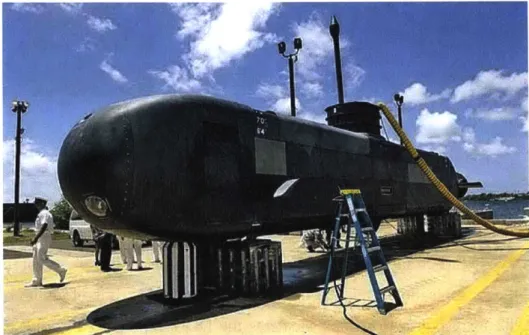
Even with strict certification requirements incident involving Li-ion batteries occur and each slows the integration of Li-ion batteries into more systems. In 2008 an Advance Seal Delivery System
(ASDS) was connected to charging its Li-ion batteries at a charging station when a fire occurred.
Severe damage occurred estimated over $200 million and SOCOM, Special Operations Command, determined it would be more cost effective to retire the mini-sub [8]. The ASDS hull is now used as a shipyard mini-sub trainer at Pearl Harbor [17].
I"
Figure 1-11: ASDS Mini-sub Damaged and Retired due to Li-ion Battery Fire 181
22
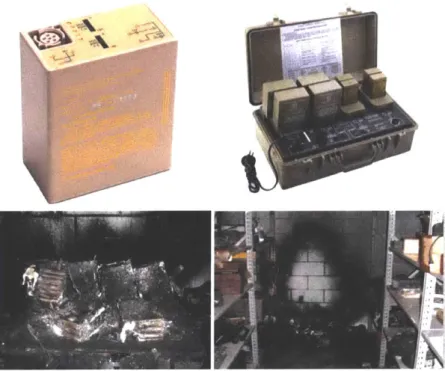
jUftA
The Army uses BB-2590/U Li-ion batteries with the PP-8489/U portable charger for many different applications and all batteries must pass testing established by the Army. Three fires have occurred involving these using these units in 2010, 2011, and 2015 [8].
Figure 1-12: Army BB-2590/U Li-ion Battery and PP-8489 Portable Charger 181
1.3 Problem Statement
Lithium-ion batteries under a mechanical load can develop failures in the internal multi-layer structure. Due to the flammable materials required for construction the safety of the battery has been in question since it was first developed. Internal failures can create a short circuit which may lead to thermal runaway, resulting in fire and sometimes the explosion of the battery. Due to the increasing use of Li-ion batteries in military and consumer products, the number of incidents involving batteries has risen and with it a growing concern for safety. Larger batteries required for unmanned and electric vehicles increase the risk associated with storing batteries onboard naval ships and severity of damage from a collision involving an electric vehicle.
In 2009 the Impact and Crashworthiness Lab (ICL) was established at MIT to study Li-ion batteries in order to produce a computational model and improve safety. One study in 2016 investigated the failure mechanisms leading to internal short circuits under different loading scenarios. From this
a microstructural based model was developed to predict load-displacement and failure of internal components under crushing loads with different ratios of tension and compression [18].
This thesis investigates the failure mechanism of internal Li-ion battery components when subject to a constant out-of-plane compression while increasing in-plane tension to the point of failure. This constant compression models the internal pressure a battery may be subject to due to certain designs, operating environments such as the ocean, or damage to the external protective casing. This thesis will also demonstrate the methods used to optimize a mechanical system designed to apply constant compression while increasing tension. The results will be used to characterize and anticipate the effect of lateral compression on the failure load of lithium-ion battery cells. The existing micro model can then be modified to the experimental conditions in this thesis in order to compare the experimental and modeled results. This comparison will be used to refine and validate the micro model and ultimately bring us closer to improving the design of Li-ion batteries.
2. LITERATURE REVIEW
The literature review provides the background information necessary to understand the experimental setup, material selection, and design. This section will introduce the components, operation, advantages, and safety concerns of the lithium-ion battery. Then provide details on the Impact and Crash Worthiness Laboratory at MIT including; the objective, research areas, and the progression of research that led to this thesis.
2.1 Lithium-Ion Battery Basics 2.1.1 Construction and Operation
All battery cells store chemical energy and convert it into electrical energy require four basic
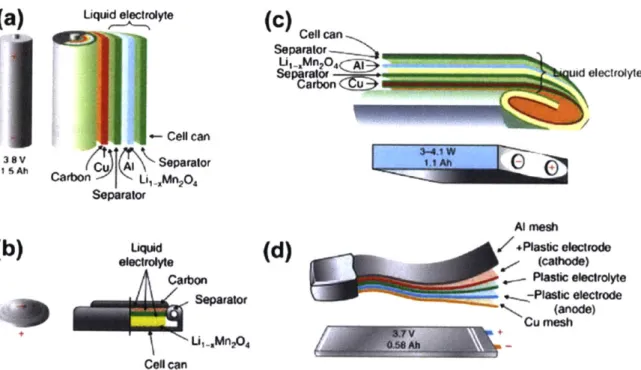
components: the anode, cathode, separator, and electrolyte. A battery consists of one or more cells and cells come a variety of shapes and may have a hard casing or soft pouch outer casing. The battery internal components described below are arranged in a multi-layered sample with 4 layers: separator, Al with double-sided coating of active material (cathode), separator, and Cu with double-sided coating of graphite (anode) which can be rolled to form the cylindrical cell in Figure 2-1 (a) or can cell (c) [19].
(+) Cathode - a lithium metal oxide coating such as cobalt oxide (CoO2) on an aluminum (Al) conductor as the positive (+) electrode that is reduced by acquiring electrons
(-) Anode - carbon or graphite (C6) on a copper (Cu) conductor as the negative electrode that is
oxidized by releasing electrons
Electrolyte - a variation of Lithium (Li) salt dissolved in an organic solvent acts as a medium
allowing the ions to move between anode and cathode
Separator - a porous polymer provides a physical barrier to prevent contact between anode and
cathode while allowing Li-ions to pass through
(a)
Uquid eleclrolyteCell can iji C u A Sepsralor Separator
(b)
UqWd electrolyte Cartbon Sepaator * l-MnA Cell ca(C)
MCell can Separatorx Sepaao id electrolyte Al mesh(d)
+Plas'ic OW e M- Plastic electrolyte --Pthi electrode (anode) Cu mneshFigure 2-1: Cross Sections of Li-ion Cells 1191
Discharging a battery describes the conversion of stored chemical energy to electrical energy, shown in Figure 2-2 and governed by reaction in Equation 1. When discharging, the right arrows,
Li deintercalates freeing itself from the graphite becoming a (+) Li-ion and releases an (-) electron,
Equation 2. The anode's conducting Cu electrode is connected through external circuitry providing the path for electrical energy to flow and provide power. The Li-ion travels in the electrolyte and passes through the porous separator to the cathode then intercalates into the metal oxide absorbing an electron in the process, Equation 3. To charge the battery power from external circuitry is
required and reverse occurs, following the left arrows. Li deintercalates from the cathode, Equation
3, causing the metal to oxidize producing a (+) Li-ion and an (-) electron. The electron travels from
cathode to the anode via external circuitry. The (+) Li-ion travels in the electrolyte through the separator to intercalate into the graphite, Equation 2, at the anode [20].
Equation 1: Li-ion Chemical Reaction
LiC6 + C002 * C6 + LiCo02 Equation 2: Chemical Reaction Occurring at the Anode
LiC6 = C6+ Li- + e-Equation 3: Chemical Reaction Occurring at the Cathode
C002+ Li++ e-= LiCoO2
Discharge
VW
Charge Meter (+) Terminal a, CathodeI
Separator Charge ... ... Anode (-) TerminalU.S. DEPARTMENT OF Office of ENERGY EFFICIENCY
ENERGY
& RENEWABLE ENERGYFigure 2-2: Li-ion Battery Charge Discharge Cycle 1211
2.1.2 Lithium-ion Battery Properties
This section will describe properties of Li-ion batteries both advantageous and those that bring up safety concerns [20], [22]. This focus is on secondary battery cells, meaning they can be recharged
and reused a finite number of times as opposed to primary battery cell which can only be used once.
More affordable: The cost to manufacture a battery, shown in Figure 1-2.
Fast charge rate: The rate the battery can undergo the chemical reactions to store energy,
usually described by the time it takes to fully charge a "dead" battery.
Long cycle life: The number of times a battery can be recharged.
High energy density: The amount of energy stored in the battery. For a certain type of
battery specific energy is normally used to describe and compare the amount of energy a battery can hold, Figure 1-1.
Wide operating range: The range of temperatures the chemical reaction will occur so the
battery can be used in.
High power density: The amount of power that can be drawn from a battery. For a certain
type of battery specific power is normally used to describe and compare the amount of current a battery can supply.
Growing safety concern: Failures of the battery which can result in harm of personnel or
equipment. Recently, Li-ion batteries been experiencing failures resulting in a growing concern for safety.
Low self-discharge: Describes the rate a battery undergoes the chemical reactions at the
anode and cathode without an external electrical connection. Meaning the energy stored dissipates over time providing no useful power or work. Li-ion batteries have low self-discharge compared to other types.
Long shelf life: The length of time a battery can be stored (years) and later used. Li-ion
batteries have a long shelf life.
Low Toxicity: Standards are in place to protect people and the environment, the reason
nickel cadmium batteries are no used.
No Maintenance: Some chemical compositions require filling electrolytic solution and venting gasses from the battery.
2.1.3 Safety Concerns
Except for safety, all the characteristics have resulted in the rapid growth of the Li-ion battery market which in turn has led to an increasing number of incidents that has shifted the focus to safety. Two main components tied to safety are the battery casing protects from external factors and the separator provides protection internally. To improve safety the different methods of
failures of Li-ion batteries resulting in fire or explosions are being investigated. These failures occur mainly due to manufacturing defects, operational heating, mechanical abuse, electrical abuse, or thermal abuse. Safety features have been and are continuing to be developed to prevent or minimize the occurrence of these types of failures. Over charging can produce a combustible gas to prevent this circuitry was developed and integrated into many battery systems. When a battery cell is damaged it may develop a short circuit producing heat which can ignite the flammable electrolytic solution in the cell. Even when the damage is minimal, the heat developed could cause further damage to the cell feeding on itself. This is known as thermal runaway and will produce a larger short and more heat which can spread in the form of heat or fire to other cells and lead to the combustion and sometimes explosion of the battery [22], [23].
2.2 Impact Crashworthiness Lab at MIT
Instead of focusing on improving performance, Professor Wierzbicki's Impact Crashworthiness Lab (ICL) at MIT conducts research in several areas, one which focuses on modelling failure mechanics of Li-ion batteries. This is one of the few academic groups working to model battery cells, others include Princeton, University of Michigan, and Michigan State University.
2.2.1 Progression of Research
Several studies conducted at the ICL have led to selecting the research for this thesis. The external and internal battery components were studied to determine characteristics [24], [25]. Tests were then conducted on both dry cells and actual battery cells to determine failure mechanics. These results were used to build a micro-structural computational model for certain battery cell types. Further testing was conducted to improve and validate the results of the model. Next, compression was added to the model to simulate an area of the battery casing damage which caused localized internal out-of-plane compression [18]. This compression was proportional to the amount of in-plane tension applied and the modelled results were validated by experimental results. The next step is the subject of this thesis, to decouple the out-of-plane compression and the in-plane tension to further develop the micro model. A test device was designed but limited testing was conducted and significant problems were encountered [26]. This thesis will also investigate the issues with the current system to optimize the device and experimental technique to improve results.
3. TENSION COMPRESSION SYSTEM TEST DESCRIPTION
This section introduces the equipment used, material tested, and describes the mechanics of operation. A general description of specimen construction and preparation is included and the reasoning behind the different geometries is discussed in Section 4.
3.1 Test Equipment and Preparation
This section describes the equipment used to conduct the combined tensile-compressive biaxial loading testing and how the specimens were assembled to represent dry internal components of LI-ion battery cells. All testing was conducted at ICL using installed commercial machines fitted with equipment designed and manufactured at MIT.
3.1.1 ICL Equipment
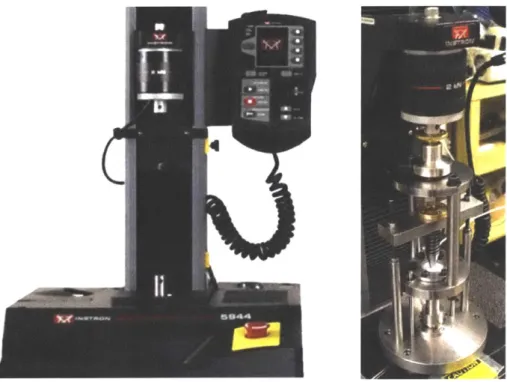
All testing used the Tension Compression System (TCS), designed by Sagy Hakoon with guidance
from Professor Tomasz Wierzbicki and Dr. Elham Sahraei, to apply a constant, static compressive load while allowing tension to increase [26]. The TCS is mounted to the base or lower testing are
of the INSTRON machine, model 5944, and connects to the upper portion of the INSTRON using
an adapter, designed by Xiaowei Zhang [24]. This allows the INSTRON to control vertical displacement of the samples installed in the TSC, Figure 3-1 shows the INSTRON without and with the TCS installed.
Figure 3-1: INSTRON Machine (left) with TCS Installed (right)
Separate load cells were used to provide accurate real time measurements of both the compressive and tensile loads. The constant compressive force was measured with a 500 N load cell installed in the base of the TCS. The load cell was connected to DP25-S Strain Gage Panel Meter and calibrated in accordance the user manuals [27], [28] to 0.25 newton per unit, shown in Table 3-1 and Equation 4.
Table 3-1: TCS Strain Gage Panel Meter 500 N Load Cell Calibration
Input Unit 1 mV
Unit Screen Resolution 100
Converting to force [N/unit shown] 0.25 N/unit
Conversion for 100 Units 25 N/100units
Equation 4: Force conversion for compression
Force [N]= (meter reading in [mV])*(0.25 [N/mV])
The INSTRON was equipped with a 2 kN load cell that connected and moved vertically with the adapter connecting to the TCS and measured the changing in-plane tensile force. The INSTRON
machine was connected to a computer that used Bluehill software to measure, record and plot the force, displacement, and record the time for each.
3.1.2 Specimen Geometry and Preparation
Specimen tested consisted of single and multi-layered samples to model the internal components of a Li-ion battery. The main internal battery component that prevents short circuits is the separator which made up the single layer specimen and was mainly used for the earlier tests while optimizing the equipment configuration and test conditions. Next, multi-layered samples, shown in Figure
3-2, were used and layered to model the internals of a Li-ion battery cell as shown in Figure 2-1:
Cross Sections of Li-ion Cells [19].
Separator
Separator
Figure 3-2: Multi-Layered Specimen
The circular sections were placed between two sheets of paper and cut with a circular cutting punch to a diameter of 44.45 mm. The specimen were inserted into a clamp ring for testing leaving a 30 mm inner diameter circular section for testing, Figure 3-3. The clamp ring removed the cut edge from the test.
30mm inner diameter
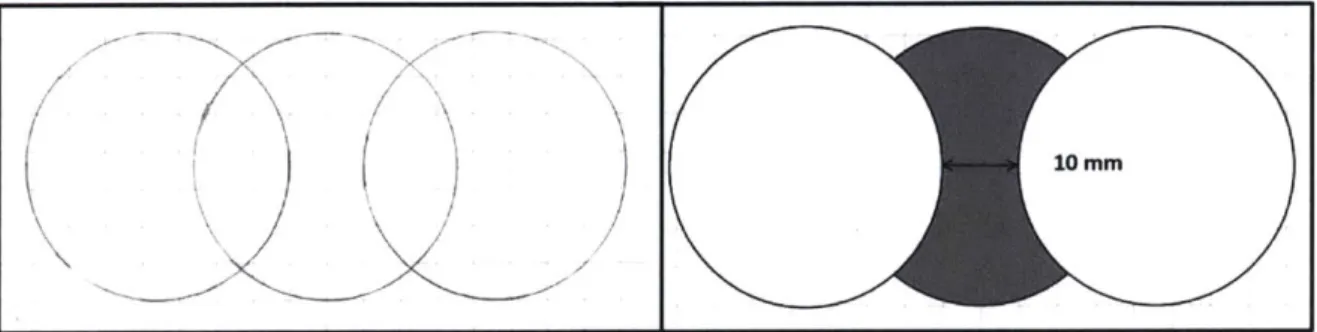
Another sample geometry tested was made using the circular cutting punch with three cuts to produce a tapered specimen, shown in Figure 3-4. The major disadvantages of the tapered samples were they took longer to make and introduced the cut tapered edges into the test. Before testing each edge was visually inspected and samples with noticeable damage along the exposed edge were removed and discarded.
10 MM
Figure 3-4: Cutting Template (left) and Tapered Specimen (right)
3.2 Material Properties and Selection
This section covers the properties of the materials tested and the method for selecting the type of separator.
3.2.1 Separator Selection
Several different types of separators were considered for testing, these were purchased from MTI Corp, have been used in previous research, all are currently used in Li-ion batteries, and have properties listed in Table 3-2.
Table 3-2: Material Properties of Separators
Graph Manufacturing Thickness Pore Size
Reference Process (i) (pm)
b PP Dry 25 36-46% 0.01-0.1
c PP-PE-PP Dry 25 39% 0.5-0.2
d A1203-PE-AI203 Wet 16 (2,12,2) 37% 0.1
The separator will be subject to a combined tension and compression in a biaxial punch test so the selection was based on the tensile tests, biaxial punch tests, and compression tests previously conducted at the ICL by Xiaowei Zhang. The results of the uniaxial tensile test produced the stress
strain curves shown in Figure 3-5 [24]. The polypropylene (PP) in (b) and polyethylene (PE) used
in PP-PE-PP, the tri-layer in (c) have very anisotropic properties so failure would occur much earlier in any direction other than MD (a). These separators would introduce another variable of
alignment in the biaxial test. The A1203-PE-A 203, ceramic coated in (d) and the non-woven in
(e) have close to isotropic properties and failure occurs in roughly the same stress range. The
non-woven is very weak so the ceramic coated was selected for the higher, approximately 5 times the
(a) 0.2 0.4 0.6 0.8 1.0 1.2 1.4 Engineering strain (mm/mm) (b) ----C --. .C ,aC eramic-coated MD eramic-coated TD eramic-coated +DD eramic-coated -DD I I. I . . I . I I . - . 0.0 0.2 0.4 0.6 0.8 1.0 1.2 1.4 Engineering strain (mm/mm) CL 0-.GCD C C -200 180 160 140 120 100 80 60 40 20 1.6 200 180 160 140 120 100 80 LP60 40 20 0 .6 0.0 0.2 04 0.6 0.8 1.0 1-2 1.4 1.6 Engineering strain (c) 30-25 -20 -15 10 5 a00 0.05 0.10 0.1 - Nonwoven MD --- Nonwoven TD ---o- Nonwoven +DD - Nonwoven -DD -0.0 0.2 (d) 0.4 0.6 08 1.0 1.2 1.4 Engineering strain (mm/mm) 5 1.6 (e)
Figure 3-5: (a) Illustration of MID, TD, +DD, -DD a separator roll; nominal stress-strain of
(b) dry-processed PP separator, (b) dry-processed tri-layer separator, (c) wet-processed
ceramic-coated separator, (e) nonwoven separator in the four directions (courtesy of Xiaowei Zhang 1241) 200 180 160 140 120 100 80 60 40 20 (U -PP MD --- PP TD -o-PP +D -- PP -DD n 0.0 - Trilayer MD Trilayer TD Trilayer +DD - Trilayer -DD 200 180 160 140 120 100 80 60 40 20 -0 (n C .) C wU . I . a ... , . , . , . , . , . , . I D 0 , . , . I . I - I
The results of the biaxial punch test are shown in Figure 3-6 [24], and were used to select the separator. The PP and PE-PP-PE have two modes of failure, shown in (b) and (c), where the ceramic in (d) and non-woven in (e) have a single mode of failure. This is due to the isotropic
properties resulting from the manufacturing and the A1203-PE-A20 3, ceramic coated separator
was selected due to the single mode of failure as well as the increased strength compared to non-woven. 0 2 4 6 8 10 12 14 16 Displacem ent (mm)
Dry processed PP
(b)
- Ceramic-coated_D1" --- Ceramic-coatedD1/2" -o- Ceramic-coated_Dl/4" -0- Ceramic-coated_D1 /8 60 50 0 U-40 30 20 10 0 18 0 ZL 0 2 4 6 8 10 12 14 16 18 Displacement (mm)Wet processed PE
(d)
0 2 4 6 8 10 12 14 16 18 Displacement (mm)Dry processed
trilaver
(c)
30 25 20 -10 --- Nonwoven _D" -o-Nonwoven_D1/2' 5 -- 3-- NonwovenD1/4" -a-NonwovenD1/8" o . I . -0 2 4 6 8 10 12 14 16 18 Displacement (mm)E-spinning Nonwoven
(e)
Figure 3-6: Force-displacement curves for biaxial punch test using I", 'A", 'A", & %" diameter punches
b) dry-processed PP separator, (b) dry-processed tri-layer separator, (c) wet-processed
ceramic-coated separator, (e) nonwoven separator (courtesy of Xiaowei Zhang
. -
0
.- . I . I . I . I . -PP01/2_01 _-PP01/2"_02 - PP_D1/4" 01 PP_D1/4"_02/
Mode 1 -/
. Mode A TrilayerD 1/2"_.01 -TrilayerD1/2"_02 - TrilayerD 1/4"_01 TrilayerD1/4"_02 40 35 30 25 20 15 10 5 180 160 140 120 100 80 60 40 20 0 0 LL- U-' i U-' ..The results of the compression test are shown in Figure 3-7 [24] and were used to select the
separator. The compression ranges being considered for the testing were from 0 to 50 MPa. The
PP, PE, and tri-layer had the best stress-strain characteristics but the ceramic coated was selected
based on tensile test and punch test results. Of note, the ceramic coated separator has an almost linear relationship in the ranges of compression tested.
120 -Ceramic-coated Trilayer 100 -Non-woven pp Q_ 80 60 -CD S 40 -CM 20 0.0 0.1 0.2 0.3 0.4 0.5 0.6 Engineering strain (mm/mm)
Figure 3-7: Compression test stress-strain curve (courtesy of Xiaowei Zhang 1241)
3.2.2 Anode and Cathode
Internal battery components were removed from dry cells to construct the multi-layered specimen. The anode and cathode have a metal foil center and are coated as described in Section 2.1.1 and have properties listed in Table 3-3.
Table 3-3: Material Properties of the Anode and Cathode
Mass Density Young's Modulus Poisson's Thickness Combined Internal component (p) [kg/m3]
(E) [GPa] Ratio (v) [pm] Thickness [pm]
Anode Coating 879 2.5 0.010 63.5111 141
Copper (anode) 8930 110 0.343 14
Cathode Coating 2162 5.9 0.010 54112
Aluminum (cathode) 2680 385 0.330 20 128
Note: [1] Each side of the anode and cathode are coated, this is thickness per side [2] Average values are provided
3.3 Mechanics of Operation
This section describes the mechanism of operation that allow the Tension Compression System (TCS), designed by Sagy Hakoon with guidance from Professor Tomasz Wierzbicki and Dr. Elham Sahraei, to apply constant in-plane compression that is decoupled from an increasing out-of-plane tension [26].
3.3.1 Tension Mechanism
The tension mechanism is a slight modification to a proven method that has been used to apply tension in the radial direction in previous research conducted at the ICL [24]-[26]. The specimen is held in a clamp ring which is lowered at a fixed rate onto a stationary punch while the time, load, and displacement are measured and recorded, as seen in Figure 3-8. These measurements are based on input from the INSTRON's 2 kN load cell to the Bluehill software. The punch tips can be changed and allows for experimentation with different diameter, material, and compression areas.
Punch
Clamp ring
Figure 3-8: Tension Mechanism
3.3.2 Compression Mechanism
To add a constant in-plane compression that is decoupled from the tension mechanism the TCS uses compression spring. The compression spring provides a relatively constant compression through its own tip to the specimen which is located between the spring tip and punch tip. This compression force is measured using the additional load cell located in the base of the TCS. In the cross section view at bottom you see the battery specimen is placed in the clamp ring on top of the
punch. The force is applied by compressing the spring and measured with the load cell located beneath the punch. The required force for the desired compression is calculated based the area of the flat portion of the punch, Equation 5, then using the strain meter conversion, Equation 4, and adjusting force the compression spring to the desired compression, Equation 6.
500N Compression Sprn Specimen reolaceable punch 500N Compression Punch Tip 0 20
S
Compression Spring TipFigure 3-9: Compression Mechanism
Equation 5: Compression Area
Tr*diameter2
Acompression = 4
Equation 6: Compression Spring Force
F= OcompressionA compression [N]
3.3.3 Basic Procedure for the TCS
To simultaneously apply the decoupled tension and compression requires the equipment is set-up
in a very specific order. Appendix A) describes the set up and operation of the TCS to aid in any future research involving the device.
3.4 Problems Encountered During Previous Testing
Previous testing did not produce the desired and hypothesized failure mode where the point of failure would be centered on the punch. Many of the failures occurred at the boundary of the clamp ring or outside the area of pre-compression. There was only a small amount of testing initially conducted with the TCS and the problems were not able to produce consistent expected results. Further testing was recommended to optimize experimental technique for more consistent results.
4. OPTIMIZATION OF EXPERIMENTAL TECHNIQUE
This section explores the experimental parameters varied in order to optimize the experiment for consistent repeatable results. To reduce time and material costs the initial optimization tests were conducted on the separator only samples. Once previous problems were corrected and consistent results were achieved the experiment was further optimized for the multi-layer samples.
4.1 Equipment and Design
The radial in-plane tension should be the highest at the center of the punch tip for any level of pre-compression. The samples were expected to fail on or near the center of the punch tip though in my initial testing many failed near the clamp ring boundary and this was independent of the level of pre-compression. This unexpected error had to be corrected prior to any optimization. The designer was contacted to ensure the TCS device was set up correctly and for any additional advice on optimization.
4.1.1 TCS Design
After running several tests and varying many different parameters there was no reduction in number of boundary failures. This indicated the unexpected failure location was the result of a design or manufacturing error. A thorough review of the CAD drawings were conducted to determine if the failure could be caused by a design error but nothing significant was noted. Next, the TCS components were examined and compared to the CAD drawings and the material
discrepancy was easily identified. The lip on the upper portion of the clamp ring had not been machined when manufactured, the lip is highlighted in green in Figure 4-1. As the clamp ring was lowered onto the punch, the rough edge would concentrate stress causing the failure of the
specimen at the boundary, the specimen interaction with the clamp ring lip is shown in Figure 4-2
with the specimen added in red. This rough clamp ring lip and machined clamp ring lip are shown in Figure 4-3. Tests conducted after this correction moved the failure location closer to the expected and for no compression the failure occurred at the center of the punch tip.
Figure 4-1: Clamp Ring Material Discrepancy
Figure 4-2: Specimen Interaction with Clamp Ring
/
/
NH- -A
Figure 4-3: Clamp Ring Lip (left) & Machined (right)
4.1.2 Punch Tip Geometry
The TCS punch tip could be unscrewed to allow testing with different punch tip diameters, geometries, and materials which are listed in Table 4-1. The non-metal tips would deform slightly as the compressive force was increased and this produced the compression area. Small changes in the compression area significantly change the amount of force required to produce the desired level. This added another variable which could not easily be measure or accounted for. The metal punch tips with no fixed compression area experienced a similar effect though the compression areas produced using different types of foam to distribute the force.
Measuring and adjusting the force to apply a specific amount of pre-compression required a fixed area for the force to act on the specimen. Metal punch tips with small flattened areas were used to provide the fixed area for compression. Two different diameter compression areas, 6 mm and 3 mm, were used and the flat compression area is shown in Figure 4-4. The punches with the larger fixed compression area were not ideal for testing since the maximum compression that could be applied was much lower. Another issues was the compression spring acted on a tip which had a diameter of just over 7mm so ensuring proper alignment between the two tips was difficult with separator samples and would be even more difficult using multi-layer samples. Proper alignment means the upper, compression spring tip overlapped the lower, punch tip compression area on all sides to produce a uniform compression.
To ensure a repeatable test the metal punch tips with a 3mm fixed compressive area were used. The largest diameter radial punched were desired to produce in-plane radial tension. However, using the larger 1" diameter punches with separator only samples produced failure near the clamp
ring boundary even after the surface was machined. This was due to the larger angle produced which can be seen in Figure 4-2, this was corrected by using the smaller %" punch tip.
Table 4-1: I'unich Tips Tested
# Materia Diameter Compression Area
[inches] [mm] Diameter [mm]
1 teflon 1 25.4 not fixed
2 teflon 3/4 19 not fixed
3 metal 1 25.4 3 4 metal 3/4 19 3 5 metal 1/2 12.5 3 6 metal 1 25.4 6 7 metal 3/4 19 6 8 metal 1/2 12.5 6
9 metal 1 25.4 not fixed
10 metal 3/4 19 not fixed
11 metal 1/2 12.5 not fixed
12 metal 1/4 6.4 not fixed
Compression area
Compression
12.50-
spring
tip
03#8
r hness
0 7.30
Figure 4-4: Fixed Compression Area
4.2 Friction
Friction is present and increases as the sample is lowered onto the punch and friction is also produced by the compression mechanism. This is a possible explanation for the failure occurring off center since the fracture locus will change depending on the friction coefficient. In order to reduce the friction coefficient different materials, lubrication, and contact interfaces were tested.
4.2.1 Material
A fluorocarbon polymer was used to reduce the friction coefficient, the punch tip and sheet are
shown in Figure 4-5. First, it was incorporated into the punch tip but due to the compression of the
punch tip described in Section 4.1.2 the tips could not be utilized for testing. In order to gain the reduced friction benefits of the polymer a thin sheet was tested in several locations. When placed between the punch tip and the sample, it would deform or fold as the sample was lowered onto the punch. To prevent this, the polymer sheet was cut to the sample size and tested in the clamp ring with the specimen. However, the polymer failed before the specimen so could not be incorporated into a multi-layer sample. The polymer was used to reduce the friction between the foam and the specimen tested which also provided the same contact surface with the specimen regardless of which foam was tested.
Figure 4-5: Polymer Punch Tips (left) and Polymer Sheet Cut to Specimen Size (right)
4.2.2 Lubricant
Lubricant was applied in several locations to reduce the friction coefficient. First, the grease was applied to the samples but the changes in sample properties depended on amount of grease, time