HAL Id: inserm-00396217
https://www.hal.inserm.fr/inserm-00396217
Submitted on 12 Mar 2010HAL is a multi-disciplinary open access archive for the deposit and dissemination of sci-entific research documents, whether they are pub-lished or not. The documents may come from
L’archive ouverte pluridisciplinaire HAL, est destinée au dépôt et à la diffusion de documents scientifiques de niveau recherche, publiés ou non, émanant des établissements d’enseignement et de
Adherence to a Mediterranean diet, cognitive decline,
and risk of dementia.
Catherine Feart, Cécilia Samieri, Virginie Rondeau, Hélène Amieva, Florence
Portet, Jean-François Dartigues, Nikolaos Scarmeas, Pascale
Barberger-Gateau
To cite this version:
Catherine Feart, Cécilia Samieri, Virginie Rondeau, Hélène Amieva, Florence Portet, et al.. Adherence to a Mediterranean diet, cognitive decline, and risk of dementia.: Mediterranean Diet, Cognitive Decline and Dementia. Journal of the American Medical Association, American Medical Association (AMA), 2009, 302 (6), pp.638-48. �10.1001/jama.2009.1146�. �inserm-00396217�
TITLE PAGE
Title
Adherence to the Mediterranean Diet, Cognitive Decline and Risk of Dementia
Authors
Catherine Féart, PhD, Cécilia Samieri, MPH, Virginie Rondeau, PhD, Hélène Amieva, PhD, Florence Portet, MD, PhD, Jean-François Dartigues, MD, PhD, Nikolaos Scarmeas, MD, Pascale Barberger-Gateau, MD, PhD
Author Affiliations: Research Center INSERM, U897, Bordeaux, France; Univ Victor Segalen Bordeaux 2, Bordeaux, France (Drs Féart, Samieri, Rondeau, Amieva, Dartigues and Barberger-Gateau), INSERM, U888, Montpellier, France; Univ Montpellier 1, Montpellier, France (Dr Portet) and Department of Neurology, Columbia University Medical Center, New York, NY, USA (Dr Scarmeas)
Corresponding author: Catherine FEART
Address: Equipe Epidémiologie de la nutrition et des comportements alimentaires, INSERM, U897, Université Victor Ségalen Bordeaux 2, ISPED case 11, 146 rue Léo-Saignat, F-33076 BORDEAUX Cedex – France
Phone: (33) 5 57 57 48 95; Fax: (33) 5 57 57 14 86 E-mail: Catherine.Feart@isped.u-bordeaux2.fr Date of the revision: 05/27/09.
Short running head
ABSTRACT
Context. Higher adherence to a Mediterranean diet (MeDi) is linked to lower risk for mortality and chronic diseases, but its association with cognitive decline is unclear. Objective. To investigate the association of the MeDi with change in cognitive performance and risk for dementia in elderly French persons.
Design, Setting and Participants. Prospective cohort study of 1410 individuals from Bordeaux (France) included in the Three-City cohort in 2001-2002 and re-examined at least once over 5 years. Adherence to the MeDi (scored as 0 to 9 ) was computed from a food frequency questionnaire and 24 hour recall.
Main outcomes measures. Cognitive performance was assessed on 4 neuropsychological tests: Mini-Mental State Examination (MMSE), Isaacs Set Test (IST), Benton Visual Retention Test (BVRT) and Free and Cued Selective Reminding Test (FCSRT). Incident cases of dementia (n=99) were validated by an independent expert committee of neurologists. Results. Adjusting for age, sex, education, marital status, energy intake, physical activity, depressive symptomatology, taking ≥5 drugs/d, Apolipoprotein E, and cardiovascular risk factors , higher MeDi score was associated with fewer MMSE errors (β= -0.006, 95% CI -.01 to -0.004, P =.03 for one point of the MeDi score). Adjustment for stroke attenuated this association. FCSRT, IST, or BVRT performance over time were not significantly associated with MeDi adherence. The association of greater MeDi adherence (score 6-9) with fewer MMSE errors and better FCSRT scores was not significant in the entire cohort, but among those who remained free from dementia over 5 years, the association was significant (adjusted for all factors except stroke, for MMSE, β=-0.006, 95%CI -0.01 – -0.0007, P=.03; for
FCSRT, β=-0.05, 95% CI 0.006 -0.10, P= .03.) Both P values increased to .06 when stroke was added to the model. MeDi adherence was not associated with the risk for incident
dementia (HR=1.04, 95%CI 0.91-1.20, P=.53), although power to detect a difference was limited.
Conclusion. Higher MeDi adherence, was associated with slower MMSE cognitive decline but not consistently with other cognitive tests; this relationship was attenuated when adjusting for stroke. Higher MeDi adherence was not associated with risk for incident dementia.
INTRODUCTION
The traditional Mediterranean diet (MeDi) is characterized by high consumption of plant foods (vegetables, fruits, legumes and cereals), high intake of olive oil as the principal source of mono-unsaturated fat but low intake of saturated fat, moderate intake of fish, low-to-moderate intake of dairy products, low consumption of meat and poultry, and wine consumed in low-to-moderate amounts, normally with meals.1 MeDi adherence has been associated with longer survival, reduced risk of cardiovascular or cancer mortality, and reduced risk of neurodegenerative disease.2, 3 The MeDi might also have protective effects against cognitive decline in older individuals since it combines several foods and nutrients potentially
protective against cognitive dysfunction or dementia such as fish, mono-unsaturated fatty acids, vitamins B12 and folate, antioxidants (vitamin E, carotenoids, flavonoids), and
moderate amounts of alcohol.4-10 A single study showed a reduced risk for Alzheimer Disease (AD) and Mild Cognitive Impairment (MCI) in participants with greater MeDi adherence.11, 12
These results were obtained in a non-Mediterranean older population, mainly US Hispanics and Blacks (<30% of Whites), which limits its generalizability.
The present study examined whether MeDi adherence was associated with change in
cognitive performance and with lower risk of allcause dementia or AD over a 5-year period in a sample of older community dwellers in France.
METHODS Participants
The Three-City (3C) study is a prospective cohort study of vascular risk factors of dementia; the methodology has been described elsewhere.13 The 3C study protocol was approved by the
Consultative Committee for the Protection of Persons participating in Biomedical Research at Kremlin-Bicêtre University Hospital (Paris). A sample of 9294 community dwellers aged 65 and over was selected in 1999-2000 from the electoral rolls of three French cities (Bordeaux, Dijon and Montpellier). All participants gave written informed consent. Three follow-up examinations were performed, 2 (wave 1, 2001-2002), 4 (wave 2, 2003-2004) and 7 (wave 3, 2006-2007) years after baseline examination. Data collection included socio-demographic information, lifestyle, symptoms and medical complaints, medical history, blood pressure, tobacco use, drug use, anthropometrical data, neuropsychological testing, and blood sampling. The present study is based on waves 1, 2 and 3 in Bordeaux, the only center where the standard data collection was completed with a comprehensive dietary survey in 1811 participants (94% of those examined at wave 1). Among them, 1712 had no missing dietary data and 1597 completed the screening procedure for diagnosis of dementia described below. We excluded 73 participants with dementia at baseline. The study sample comprises the 1410 non-demented participants (92.5%) who had at least one follow-up re-examination over 5 years: 1340 were re-examined at wave 2 and 1213 at wave 3. Wave 3 was closed on December 2007 in the Bordeaux Center of 3C.
Dietary assessment and MeDi score
At wave1, participants were visited at home by a specifically trained dietician who
administered a food frequency questionnaire (FFQ) and a 24H dietary recall.14, 15 Data from these questionnaires were validated in an independent subsample of 3C.16 The 24H recall was used to estimate nutrient intake in g/d, total energy intake in kcal/d and to compute the
monounsaturated fatty acid-to-saturated fatty acid (MUFA-to-SFA) ratio. Based on the FFQ, frequency of consumption of 40 categories of foods and beverages for each of the 3 main meals and 3 between-meals snacks was recorded in 11 classes. The food items were converted into number of servings per week and then aggregated into 20 food and beverage groups as described earlier.15 We identified the food groups considered to be part of the MeDi:
vegetables, fruits, legumes, cereals including bread, pasta and rice (whole and refined grains), fish, meat, dairy products, and alcohol. The number of servings/week for each food group was determined and the MeDi score was computed as follows: a value of 0 or 1 was assigned to each food group using sex-specific medians of the population as cut-offs. For beneficial components (vegetables, fruits, legumes, cereals and fish), individuals whose consumption was below the median were assigned a value of 0, vs 1 for the others. For components presumed to be detrimental (meat and dairy products), individuals whose consumption was below the median were assigned 1, vs 0 for the others. For alcohol, one point was given to men if their consumption was within 7-to-14 glasses per week (10-to-20g/d) and for women if consumption was within 1-to-4 (1.4-to-5.7g/d) glasses per week. These cut-offs
corresponding to the second quartile of distribution of total alcohol in this population (AU: reference?)were chosen to represent mild-to-moderate consumption. For MUFA-to-SFA ratio, ratios below the sex-specific median were given a value of 0 vs 1 for those above the median. The MeDi score was generated by adding the scores (0 or 1 point) for each food category for each participant. Thus, the MeDi score could range from 0 to 9, with higher scores indicating greater MeDi adherence.2
Evaluation of cognitive functions and diagnosis of dementia
Trained psychologists administered a battery of neuropsychological tests. Four tests were administered at the baseline of our study (wave 1 of the 3C study):
i. the Mini Mental State Examination (MMSE)17 is a sum-score, evaluating various
dimensions of cognition, used as an index of global cognitive performance. Scores range from 0 to 30.
ii. the Isaacs Set Test (IST)18 evaluates semantic verbal fluency abilities and speed of
verbal production. Individuals have to generate a list of words (with a maximum of 10) belonging to a specific semantic category in 15 seconds. Four semantic categories are used successively (cities, fruits, animals and colors). Score range from 0 to 40. iii. the Benton Visual Retention Test (BVRT)19 evaluates immediate visual memory.
After the presentation for 10 seconds of a stimulus card displaying a geometric figure, individuals are asked to identify the initial figure among 4 possibilities. Fifteen figures are successively presented and scores range from 0 to 15.
iv. the Free and Cued Selective Reminding Test (FCSRT)20 involves verbal episodic memory. Sixteen words belonging to 16 semantic categories are presented during the encoding phase. Afterwards, three successive recall trials are performed, each trial starting with a free recall inviting participants to retrieve as many words as possible. Then, for words not retrieved, the examiner provides a category cue to enhance recall. We considered the total free recall score as corresponding to the sum of the 3 free recalls ranging from 0 to 48.
These cognitive tests were administered at each follow-up except for the FCSRT, which was not administered at wave 2.
The diagnosis of dementia was based on a two step procedure following administration of the battery of neuropsychological tests.13 At each wave, the participants who were suspected of dementia on the basis of their present neuropsychological performances and decline relatively to a previous examination were examined by a neurologist. Then, an independent committee
of neurologists reviewed all potential cases of dementia and analysed in depth the medical history of each participant to obtain a consensus on the diagnosis and etiology according to the criteria of the Diagnostic and Statistical Manual of Mental Disorders, fourth edition. They confirmed 99 incident cases of dementia (28 at wave 2 and 71 at wave 3) and 66 probable or possible AD (19 at wave 2 and 47 at wave 3) over the 5 years of follow-up.
Covariates
Socio-demographic information included age, sex , education, income and marital status. Vascular risk factors included Body Mass Index (BMI in kg/m2), smoking status, history of cardiovascular or cerebrovascular disease, hypertension (blood pressure ≥ 140/90 mmHg or treated), diabetes (glucose ≥ 7.2 mmol/L or treated) and hypercholesterolemia (total cholesterol ≥ 6.2 mmol/L). Moreover, taking five drugs/d or more was considered as an indicator of comorbidity.13Apolipoprotein E (ApoE) genotype was considered dichotomously: presence of at least one ε4 allele (only 13 individuals were homozygotes) versus no ε4 allele. Depressive symptomatology was assessed on the Center for Epidemiological Studies-Depression scale (CES-D, used as continuous variable).21 Practice and intensity of physical exercise were assessed by two questions: ‘Do you practice sports?’ (yes/no) and ‘Do you perspire when you practice sport?’ (never/sometimes/most of the time/always). A three-level variable was computed to describe intensity of physical exercise as already published.14 Statistical analyses
All statistical analyses were performed with SAS Statistical package (Version 9.1 SAS Institute).
Participants were classified according to categories of the MeDi score. The MeDi categories 0-3, 4-5 or 6-9 were defined so as to be nutritionally relevant, close to tertiles of the
distribution of the MeDi score in our sample and similar to those of the US study.11
MeDi score using Chi-Square statistics for class variables and analysis of variance (ANOVA) followed by 2X2 comparison post-hoc tests for continuous variables (2-sided tests, accepted significance at P<.05). The characteristics of the 1410 participants with follow-up were compared to those of individuals who were not re-examined (N=114).
We used mixed models to examine the association between the MeDi score and the evolution of cognitive performances on each test over time. The outcomes of interest were the repeated measures of individual scores on the 4 cognitive tests. Total scores were modelled for IST, BVRT, and FCSRT. The square root of the number of errors ( 30 − MMSE ) was used for MMSE to approximate to a normal distribution as required for linear mixed model analyses.22 Thus, an increase in the number of errors on the MMSE score with time indicated cognitive decline. The beta coefficient for MeDi score represented the association of MeDi with baseline mean cognitive scores and the beta coefficient for the MeDi interaction with time (i.e., the slope) represented the association of MeDi effect on the change in the cognitive scores over time. A negative beta coefficient for MeDi X time indicates that an increase in the MeDi score was associated with fewer MMSE errors over time whereas a positive beta coefficient indicates better cognitive performances on the FCSRT, IST and BVRT with increasing MeDi adherence over time. In other exploratory models (sensitivity analyses), we repeated these analyses excluding individuals with incident dementia (n=99).
Cox proportional hazard models with delayed entry and age as a time scale23 were performed to estimate the risk for incident dementia and AD as a function of baseline MeDi adherence. Hazard ratios (HR) were estimated for the MeDi score considered as a continuous variable (1-point increase) and for the MeDi score considered as a categorical variable (0-3 as reference vs 4-5 and 6-9).
We applied the same strategy of selection of covariates for both Cox proportional hazard models and mixed models. First, model 1 was adjusted for the factors that were significantly
different at P<.10 between categories of MeDi score in univariate analysis: age, sex, education, ApoE genotype in addition to marital status, practice of physical exercise, total energy intake, and taking ≥5 drugs/d.. Although not significantly different at P<.10 , CES-D score, which is a potential confounder for age-related cognitive decline or dementia, was also introduced in model 1. Then, cardiovascular risk factors (tobacco, BMI, hypertension, hypercholesterolemia and diabetes) were entered as additional adjustment variables in model 2. Stroke was added separately as adjustment variable in model 3. Further control for cardiovascular risk factors and stroke in the same model was also performed.
Finally, we analyzed whether possible associations between MeDi adherence and cognitive decline were driven by associations of particular food categories. These analyses were adjusted for age, sex, education, marital status, total energy intake, practice of physical exercise, taking ≥5 drugs/d, CES-D score and ApoE genotype and their interaction with time (model 1).
We calculated the power of the study to detect incident dementia. Assuming a 26.4% prevalence of a high MeDi score (6-9), compared with the MeDi score 0-5 and 99 incident dementia cases over 5 years, the cohort size of 1410 provides a power of 45% to detect a HR of 0.6 as found in the US study.11
RESULTS
The study sample consisted of 1410 individuals, aged 75.9y on average at wave 1 (range 67.7-94.9). The median follow-up was 4.1y between waves 1 and 3. The MeDi score ranged from 0 to 8 with less than 4% of the total population in the extreme values (0 or 8); 44% participants had a MeDi score of 4 or 5. The mean (SD) MeDi score was 4.36 (1.66) and its distribution was normal.
As expected, greater MeDi adherence was characterized by higher intake of vegetables, fruits, legumes, cereals and fish and lower intake of meat and dairy products (Table 1).
Greater MeDi adherence was associated with male sex and being married but not education, income, or physical activity (Table 2). Individuals in the middle or high MeDi categories had a lower mean BMI and higher mean energy intake than those in the lowest category. Mean baseline MMSE, FCSRT and BVRT scores did not differ across MeDi categories. However, mean annual decline on the MMSE and FCSRT significantly decreased with increasing MeDi adherence with a difference of 0.7 point of MMSE score and 1.1 point of FCSRT score between the lowest and highest MeDi categories, over 5 years. Incidence of dementia was not significantly associated with the MeDi score.
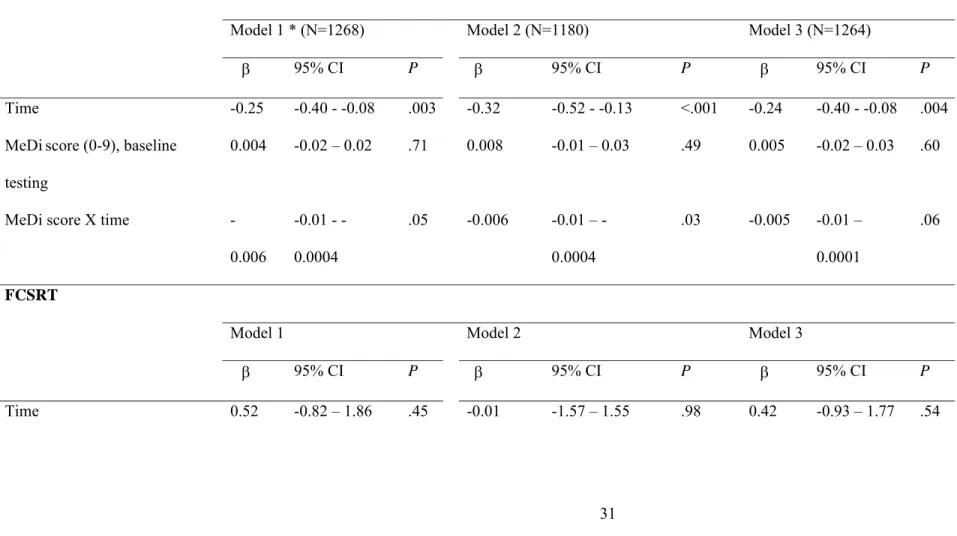
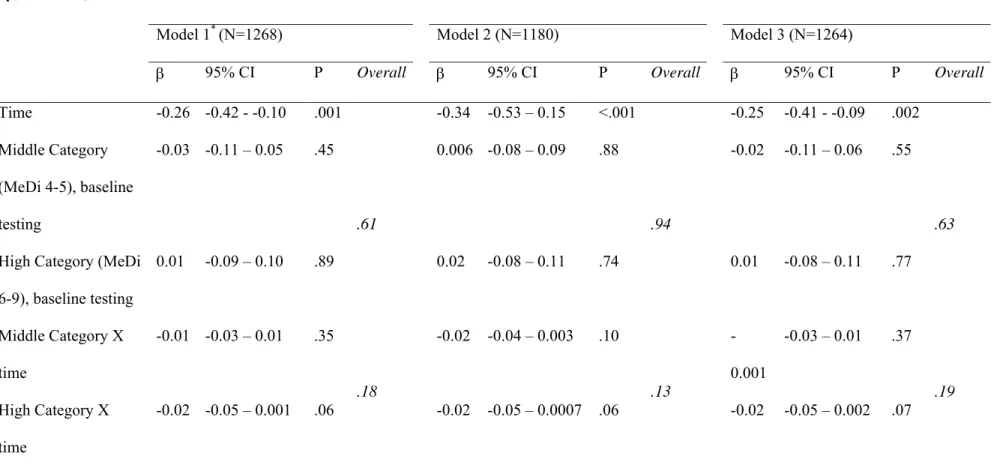
The associations between cognitive decline and the MeDi score as a continuous variable are shown in Table 3 and associations with the MeDi score as a categorical variable are shown in Table 4. . In longitudinal analyses, each additional unit of MeDi score was associated with fewer MMSE errors at follow-up (Table 3, model 2). This association was attenuated when stroke was added to the model (Model 3). [Au: the prior deleted sentence does not reflect what was shown in the tables.] Conversely, MeDi adherence analyzed as a categorical variablewas not associated with MMSE performance over time (Table 4), and MeDi as a continuous or a categorical variable was not associated with FCSRT, IST or BVRT performances over time (Tables 3 and 4).
Those who developed incident dementia (N=99) or AD (N=66) over 5 years were older (79.4y and 79.1y respectively vs 75.7y, P<.0001) at wave 1 than those who remained free from dementia over time. MeDi adherence, as a continuous or categorical variable, was not associated with the risk for incident dementia or AD in multivariate analyses (Table 5).
In sensitivity analyses, we assessed the association between cognitive decline and MeDi adherence as a continuous variable (Table 6) or as a categorical variable (Table 7), excluding individuals with incident dementia (n=99). In longitudinal analyses, each additional unit of MeDi score was associated with fewer MMSE errors at follow-up only when cardiovascular risk factors were taken into account but not when stroke was added to the model (Table 6). A similar pattern for the FCSRT was also observed when MeDi adherence increased. Results were similar when MeDi was considered as a categorical variable (Table 7). For example, a women who remained free from dementia over 5 years, with low MeDi adherence (score 0-3) would lose 0.9 point on the MMSE score and 2.2 points on the FCSRT score over 5 years, whereas she would have lost respectively 0.5 point and 1.1 points with a high MeDi adherence (score 6-9). [Au: Please revise this example to pertain to the results not those who developed incident dementia.]
There was no association between MeDi as a continuous or categorical variable and IST or BVRT performances over time.
[Au: since it is unclear how many analyses were performed and this seems less
important given that the results are only significant in a very few analyses, it would be best to delete this.]DISCUSSION
In this population-based cohort study, higher adherence to a Mediterranean-type diet was associated with slower decline of MMSE but not other cognitive tests and was not associated with the risk for incident dementia over 5 years of follow-up . This association was
factors, but was attenuated afteradjusting for stroke tirely consistent with the previous study on this topic. In that cohort study of a large community-based population without dementia in New York, higher MeDi adherence was associated with a reduced risk for MCI and AD.11, 12 However, two important differences between the US study and the present one could explain such discrepancies. First the length of follow-up (range 0.2-13.9y or 0.9-16.4y in US studies vs 1.6-6.1y in the 3C cohort) differed. In addition, country-specific characteristics of the dietary patterns may partly explain the discrepancies observed between the French and US studies 24 despite similar mean MeDi scores.[Au: please present a sensitivity analysis to
address the issue addressed in your cover letter, making the cutpoints in MeDi
comparable between the US and French populations. The portion of the letter to which I refer is: “23)…Altogether, these country-specific characteristics of the dietary patterns may partly explain the discrepancies observed between the French and US studies. Moreover, adherence to the MeDi may reflect specific health concerns and behaviours that may differ between countries regarding in particular use of supplements or other food groups that are not considered in the MeDi score computation.
Indeed, multi-vitamins and multi-supplements use seems to be a major difference between US and French dietary behaviours. Indeed, dietary supplement use is increasingly common in the US where 52% of adults reported taking a dietary supplement in the past month and 35% reported regular use of a multi-vitamin-multimineral product (Radimer et al. Am J Epidemiol, 2004;160:339-349). Moreover, the US older persons were more likely to be multi-vitamin users (63%) (Rock, Am J Clin Nutr, 2007;85:227S-279S). In France, the multi-vitamin use seems largely lower than in the USA. Less than 10% of the participants of 3C study
(Bordeaux sample) reported a regular use of multi-vitamin (Féart et al. Int J Vitam Nutr Res, in press). In the French E3N-EPIC cohort, 29% of women, aged 45 to 60y, were regular dietary supplements users (at least 3 per week) (Touvier et al. Eur J Clin Nutr, 2009;63:39-47).
One reference has been added in the Discussion section: Kant, J Am Diet
Assoc,2004;104:615-635. “
Moreover, adherence to the MeDi may reflect specific health concerns and behaviours that may differ between countries regarding in particular use of supplements or other food groups that are not considered in the MeDi score computation. This may explain the inconsistent results since the MeDi score was computed according to sex-specific medians of consumption of only 9 food groups of each study sample.
Other explanations for such discrepancies are related to cognitive decline in the prodromal phase of dementia. We used 4 tests evaluating different cognitive domains that could be affected in a specific sequence during the time course preceding the clinically defined dementia syndrome.25 Interestingly, the two tests related to diet in our study, i.e. the MMSE
considered as the hallmark of pathological cognitive aging.25, 26 (AU: FCSRT was not
related – Please revise. The difference in results with and without the incident dementia cases are not substantially different for the 1 test, the FSCRT.)Conversely, the BVRT involves working memory, a cognitive domain particularly sensitive to normal aging. Therefore, our results suggest that the MeDi may delay decline in cognitive functions
specifically involved in pathological brain aging but only at least five years before the clinical diagnosis of dementia. The MeDi would be unable to delay dementia onset or slow down cognitive decline in the five years preceding the clinical diagnosis.
Taken together, these results suggest that the MeDi may have a long-term effect. Beneficial effects would exist during the long prodromal phase of dementia25 rather than in the very last
years preceding dementia. There might be a window of opportunity where greater MeDi adherence could provide beneficial effects on cognitive decline. After that time, the
physiopathological processes conducting to dementia could probably not be reversed by diet. During the prodromal phase of dementia, successive emergence of cognitive deficits on IST and BVRT seems to appear more than 10 years before the diagnosis of dementia25. This result could partly explain the significant difference between baseline IST scores across categories of MeDi adherence. Over time, slopes of cognitive decline relative to IST appeared to be similar across categories of MeDi which may explain in part the non-significant effect. The clinical implications of these results may seem modest but would be sizeable with longer follow-up and as expected with respect to the literature on cognitive decline in older persons. The differences of mean annual decline of cognitive performances across categories of MeDi adherence indicated a clinically significant effect on the MMSE and FCSRT which was confirmed by multivariate analyses in subjects free from dementia over time.
A solid biological foundation for the health benefits of the MeDi has already been provided. The potential mechanisms involve a decrease in oxidative stress, inflammation and vascular
disease, which also participate in the pathophysiology of neurodegenerative disease.27, 28
Individuals with higher MeDi adherence have been shown to have higher plasma
concentrations of some presumed beneficial biomarkers.29-31 The strong evidence relating the MeDi to lower risk of vascular disease is supported in part by our results, which indicate that the association between cognitive decline and MeDi was attenuated when adjusting for stroke, but the opposite was true for cardiovascular risk factors in general. More research is needed to better understand the biological mechanisms involved in the relation between the MeDi and cognitive decline.
Our results should be interpreted with caution because of some potential methodological limitations. The MeDi score is based on a traditional Mediterranean reference pattern defined a priori which does not consider the overall correlation between foods.33 Dietary patterns derived by a priori34 or a posteriori methods15 were already associated with a significantly reduced risk for AD and fewer cognitive symptoms in the 3C cohort. The use of sex-specific cut-off points to develop the MeDi score does not really measure adherence to a universal traditional MeDi pattern but rather to a specific pattern.35 The hallmark of the traditional MeDi is a very high consumption of olive oil leading to a high MUFA-to-SFA ratio.36 As
already reported in a non-Mediterranean population,11, 12 we found a relatively low MUFA-to-SFA ratio, but we verified that consumption of olive oil was positively correlated with the MeDi score and with the MUFA-to-SFA ratio (data available on request). A relatively short follow-up could also introduce a bias due to sub-clinical dementia inducing changes of dietary habits in the phase preceding dementia. In sensitivity analyses excluding incident dementia cases over 5 years, the significant association between greater MeDi adherence and slower cognitive decline tends to confirm such a potential bias. Another interpretation of these results might be the lack of protective effect of the MeDi when the neurodegenerative process of dementia is too advanced to be reversed by diet. Moreover, a selection bias cannot be
dismissed. Participants with missing follow-up (N=114) were older, had a lower mean BMI, higher mean CES-D score, higher mean consumption of drugs/d and lower cognitive performance on each test than those with available follow-up. Individuals with missing follow-up also had a slightly lower mean MeDi score (4.09 vs 4.36, P=.09) than the others. Another limitation concerning cognitive tests was their potential ceiling or floor
effects.Moreover, our study lacked the power to definitively be able to detect an association with incident dementia; our cohort size provided an a posteriori power of less than 10% to detect a HR of 0.9 for incident dementia as observed in our study. Finally, we cannot rule out the possibility of residual confounding by unknown risk factors such as a general healthier lifestyle of MeDi adherents. Despite these limitations, the strengths of the present study are its size, the population-based design, and control for several potential confounders. In particular, we controlled for depressive symptomatology since links between cognitive impairment and depression are well documented.25, 37
This study shows that higher MeDi adherence is associated with slightly slower MMSE decline but not other measures of cognitive decline in older persons, especially in those who remained free from dementia over five years. The MeDi pattern probably does not fully explain the better health of people who adhere to it but it likely contributes directly. The MeDi may also indirectly constitute an indicator of a complex set of favorable social and lifestyle factors that contribute to better health. Further research is needed to allow the generalization of these results to other populations and to establish whether the MeDi slows cognitive decline or reduces incident dementia in addition to its cardiovascular benefits.
ACKNOWLEDGMENTS
Funding / Support: The Three-City Study is conducted under a partnership agreement between the Institut National de la Santé et de la Recherche Médicale (INSERM), the Institut de Santé Publique et Développement of the Victor Segalen Bordeaux 2 University, and Sanofi-Aventis. The Fondation pour la Recherche Médicale funded the preparation and initiation of the study. The 3C Study is also supported by the Caisse Nationale Maladie des Travailleurs Salariés, Direction Générale de la Santé, Mutuelle Générale de l’Education Nationale, Institut de la Longévité, Regional Governments of Aquitaine and Bourgogne, Fondation de France, and Ministry of Research - INSERM Programme “Cohortes et collections de données biologiques.” Financial support for 3C-COGINUT project was provided by the French National Research Agency (ANR-06-PNRA-005). C. Féart was funded by Association France Alzheimer. C. Samieri was funded by Aquitaine Regional Government.
Role of the sponsors: Study sponsors played no role in thedesign and conduct of the study; collection, management, analysis,and interpretation of the data; and preparation, review, or approval of the manuscript.
Author Contributions:
Dr C Féart had full access to all of the data in the study and takes responsibility for the integrity of the data and the accuracy of the data analysis.
Design and conduct of the study: Barberger-Gateau, Dartigues Collection: Barberger-Gateau, Dartigues, Portet
Management: Barberger-Gateau
Analysis and interpretation of data: Féart; Rondeau, Samieri, Scarmeas Preparation of the manuscript: Féart, Barberger-Gateau
Review and approval of the manuscript: Féart, Samieri, Rondeau, Amieva, Portet, Dartigues, Scarmeas, Barberger-Gateau
Dr Féart performed and is responsible for the statistical analyses for this study. Financial disclosures: None
Additional Contributions: We thank Ray Cooke (L.A.C.E.S., Univ. Bordeaux 2, France) for revising the English.
REFERENCES
1. Willett WC, Sacks F, Trichopoulou A, et al. Mediterranean diet pyramid: a cultural model for healthy eating. Am J Clin Nutr. 1995;61(6 Suppl):1402S-1406S.
2. Trichopoulou A, Costacou T, Bamia C, Trichopoulos D. Adherence to a Mediterranean diet and survival in a Greek population. N Engl J Med. 2003;348(26):2599-2608.
3. Sofi F, Cesari F, Abbate R, Gensini GF, Casini A. Adherence to Mediterranean diet and health status: meta-analysis. Bmj. 2008;337:a1344.
4. Reynolds E. Vitamin B12, folic acid, and the nervous system. Lancet Neurol. 2006;5(11):949-960.
5. Solfrizzi V, Colacicco AM, D'Introno A, et al. Dietary intake of unsaturated fatty acids and age-related cognitive decline: a 8.5-year follow-up of the Italian Longitudinal Study on Aging. Neurobiol Aging. 2006;27(11):1694-1704.
6. Stampfer MJ, Kang JH, Chen J, Cherry R, Grodstein F. Effects of moderate alcohol consumption on cognitive function in women. N Engl J Med. 2005;352(3):245-253. 7. Gomez-Pinilla F. Brain foods: the effects of nutrients on brain function. Nat Rev
Neurosci. 2008;9(7):568-578.
8. Luchsinger JA, Mayeux R. Dietary factors and Alzheimer's disease. Lancet Neurol. 2004;3(10):579-587.
9. Engelhart MJ, Geerlings MI, Ruitenberg A, et al. Dietary intake of antioxidants and risk of Alzheimer disease. Jama. 2002;287(24):3223-3229.
10. Letenneur L, Proust-Lima C, Le Gouge A, Dartigues JF, Barberger-Gateau P. Flavonoid intake and cognitive decline over a 10-year period. Am J Epidemiol. 2007;165(12):1364-1371.
11. Scarmeas N, Stern Y, Tang MX, Mayeux R, Luchsinger JA. Mediterranean diet and risk for Alzheimer's disease. Ann Neurol. 2006;59(6):912-921.
12. Scarmeas N, Stern Y, Mayeux R, Manly JJ, Schupf N, Luchsinger JA. Mediterranean diet and mild cognitive impairment. Arch Neurol. 2009;66(2):216-225.
13. The 3C Study Group. Vascular factors and risk of dementia: design of the Three-City Study and baseline characteristics of the study population. Neuroepidemiology. 2003;22:316-325.
14. Feart C, Jutand MA, Larrieu S, et al. Energy, macronutrient and fatty acid intake of French elderly community dwellers and association with socio-demographic characteristics: data from the Bordeaux sample of the Three-City Study. Br J Nutr. 2007;98:1046-1057.
15. Samieri C, Jutand MA, Feart C, Capuron L, Letenneur L, Barberger-Gateau P. Dietary patterns derived by hybrid clustering method in older people: association with
cognition, mood, and self-rated health. J Am Diet Assoc. 2008;108(9):1461-1471. 16. Simermann J, Barberger-Gateau P, Berr C. Validation of a Food Frequency
Questionnaire in older population. 25th annual congress of SFNEP: clinical nutrition and metabolism. Montpellier (France); 2007.
17. Folstein MF, Folstein SE, McHugh PR. Mini Mental State : A practical method for grading the cognitive state of patients for the clinician. J Psychiatr Res. 1975;12:189-198.
18. Isaacs B, Kennie AT. The Set test as an aid to the detection of dementia in old people. Br J Psychiatry. 1973;123(575):467-470.
19. Benton A. Manuel pour l’application du Test de Rétention Visuelle. Applications cliniques et expérimentales. Paris: Centre de Psychologie appliquée; 1965.
20. Grober E, Buschke H. Genuine memory deficits in dementia. Dev neuropsychol. 1987;3:13-36.
21. Berkman LF, Berkman CS, Kasl S, et al. Depressive symptoms in relation to physical health and functioning in the elderly. Am J Epidemiol. 1986;124:372-388.
22. Jacqmin-Gadda H, Fabrigoule C, Commenges D, Dartigues JF. A 5-year longitudinal study of the Mini-Mental State Examination in normal aging. Am J Epidemiol. 1997;145(6):498-506.
23. Lamarca R, Alonso J, Gomez G, Munoz A. Left-truncated data with age as time scale: an alternative for survival analysis in the elderly population. J Gerontol A Biol Sci Med Sci. 1998;53(5):M337-343.
24. Kant AK. Dietary patterns and health outcomes. J Am Diet Assoc. 2004;104(4):615-635.
25. Amieva H, Le Goff M, Millet X, et al. Prodromal Alzheimer's disease: successive emergence of the clinical symptoms. Ann Neurol. 2008;64(5):492-498.
26. Dubois B, Feldman HH, Jacova C, et al. Research criteria for the diagnosis of Alzheimer's disease: revising the NINCDS-ADRDA criteria. Lancet Neurol. 2007;6(8):734-746.
27. Cummings JL. Alzheimer's disease. N Engl J Med. 2004;351(1):56-67. 28. Steele M, Stuchbury G, Munch G. The molecular basis of the prevention of
Alzheimer's disease through healthy nutrition. Exp Gerontol. 2007;42(1-2):28-36. 29. Bach-Faig A, Geleva D, Carrasco JL, Ribas-Barba L, Serra-Majem L. Evaluating associations between Mediterranean diet adherence indexes and biomarkers of diet and disease. Public Health Nutr. 2006;9(8A):1110-1117.
30. Dai J, Jones DP, Goldberg J, et al. Association between adherence to the Mediterranean diet and oxidative stress. Am J Clin Nutr. 2008;88(5):1364-1370.
31. Giugliano D, Esposito K. Mediterranean diet and metabolic diseases. Curr Opin Lipidol. 2008;19(1):63-68.
32. Scarmeas N, Stern Y, Mayeux R, Luchsinger JA. Mediterranean diet, Alzheimer disease, and vascular mediation. Arch Neurol. 2006;63(12):1709-1717.
33. Jacques PF, Tucker KL. Are dietary patterns useful for understanding the role of diet in chronic disease? Am J Clin Nutr. 2001;73(1):1-2.
34. Barberger-Gateau P, Raffaitin C, Letenneur L, et al. Dietary patterns and risk of dementia: the Three-City cohort study. Neurology. 2007;69(20):1921-1930. 35. Bach A, Serra-Majem L, Carrasco JL, et al. The use of indexes evaluating the
adherence to the Mediterranean diet in epidemiological studies: a review. Public Health Nutr. 2006;9(1A):132-146.
36. Panza F, Capurso C, D'Introno A, et al. Mediterranean diet, mild cognitive
impairment, and Alzheimer's disease. Exp Gerontol. 2007;42(1-2):6-7; author reply 8-9.
37. Sanchez-Villegas A, Henriquez P, Bes-Rastrollo M, Doreste J. Mediterranean diet and depression. Public Health Nutr. 2006;9(8A):1104-1109.
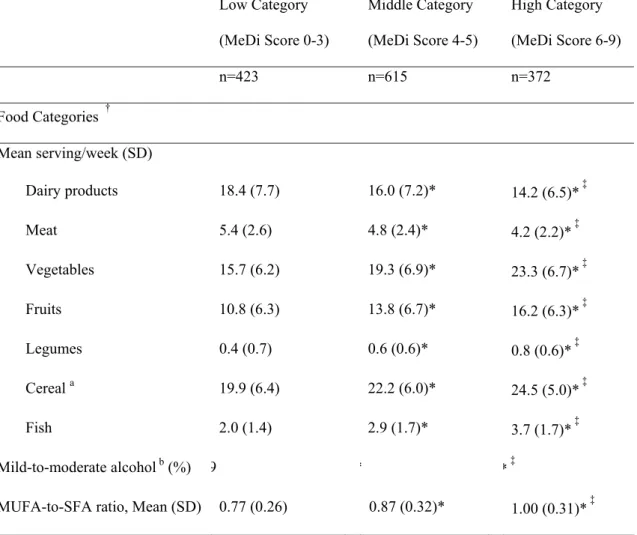
Table 1. Mean number of servings per week for individual food categories, proportion of mild-to-moderate alcohol consumers and mean ratio of daily intake of MUFA-to-SFA by categories of Mediterranean Diet score among older persons living in Bordeaux, The Three-City study (2001-2002). (N=1410) Low Category (MeDi Score 0-3) Middle Category (MeDi Score 4-5) High Category (MeDi Score 6-9) n=423 n=615 n=372 Food Categories † Mean serving/week (SD) Dairy products 18.4 (7.7) 16.0 (7.2)* 14.2 (6.5)* ‡ Meat 5.4 (2.6) 4.8 (2.4)* 4.2 (2.2)* ‡ Vegetables 15.7 (6.2) 19.3 (6.9)* 23.3 (6.7)* ‡ Fruits 10.8 (6.3) 13.8 (6.7)* 16.2 (6.3)* ‡ Legumes 0.4 (0.7) 0.6 (0.6)* 0.8 (0.6)* ‡ Cereal a 19.9 (6.4) 22.2 (6.0)* 24.5 (5.0)* ‡ Fish 2.0 (1.4) 2.9 (1.7)* 3.7 (1.7)* ‡ Mild-to-moderate alcohol b (%) 9 * * ‡
MUFA-to-SFA ratio, Mean (SD) 0.77 (0.26) 0.87 (0.32)* 1.00 (0.31)* ‡
Abbreviations: MeDi Mediterranean diet; MUFA-to-SFA Monounsaturated fatty acid-to-saturated fatty acid ratio (intake g/d)
†
All P –values <.0001 for the analysis of variance (ANOVA) or for the Chi-Square test (proportion of mild-to-moderate alcohol consumers) among categories of Mediterranean diet score
* 2X2 significant comparisons (P<0.05) for mean number of servings per week for individual food categories, proportion of mild-to-moderate alcohol consumers and mean ratio of daily intake of MUFA-to-SFA between categories of Mediterranean diet score taking the lowest category as reference group or ‡between individuals in middle and high categories of Mediterranean diet score.
a Cereals included consumption of cereals, bread and pasta and rice (whole and refined grains) b For alcohol intake, we attributed a value of 1 for people whose consumption was mild-to
moderate, corresponding to the second quartile of distribution of total alcohol intake. One point was given to men if their consumption was within 7-to-14 glasses per week (10-to-20g/d) and to women if consumption was within 1-to-4 (1.4-to-5.7g/d) glasses per week.
Table 2. Demographic, clinical and dietary characteristics and cognitive performances by categories of Mediterranean diet score among older
persons living in Bordeaux, The Three-City study, wave1 (2001-2002). (N=1410) [Au: Here and throughout the manuscript, please refer to
any number “n” that does not refer to the entire study sample using a lower case “n”, not an upper case “N”. Upper case “N” is used only when referring to the entire sample.]
Low Category (MeDiScore 0-3) (n=423) Middle Category (MeDi Score 4-5) (n=615) High Category (MeDi Score 6-9) (n=372) Demographic characteristics P
Age, (N) mean (SD),y (423) 76.1 (4.9) (615) 75.9 (4.9) (372) 75.8 (4.6) .63
Women, (N) % (288) 60.1 (380) 61.8 (215) 57.8 .01 Education, (N) % .32 no or primary school (150) 35.5 (184) 30.1 (115) 31.1 secondary (113) 26.8 (171) 28.0 (100) 27.0 high school (96) 22.8 (132) 21.6 (82) 22.2 university (63) 14.9 (124) 20.3 (73) 19.7
Monthly income (€), (N) % .56 refused to answer (25) 5.9 (42) 6.8 (25) 6.7 < 750 (40) 9.5 (40) 6.5 (25) 6.7 750-1500 (153) 36.2 (205) 33.3 (122) 32.8 1500-2250 (99) 23.4 (155) 25.2 (88) 23.7 > 2250 (106) 25.1 (173) 28.1 (112) 30.1 Marital Status, (N) % <.0001 married (211) 50.0 (343) 56.0 (246) 66.5 divorced/separated (37) 8.8 (45) 7.3 (27) 7.3 widowed (150) 35.5 (183) 29.8 (72) 19.5 single (24) 5.7 (42) 6.9 (25) 6.7
Practice of physical exercise, (N) % .09
no (244) 57.7 (318) 51.7 (199) 53.4
moderate (69) 16.3 (108) 17.6 (73) 19.6
intensive (20) 4.7 (56) 9.1 (31) 8.3
Clinical characteristics
CES-D scores, (N) mean (SD) (420) 8.2 (7.4) (612) 7.5 (7.5) (369) 7.3 (6.8) .17
BMI, (N) mean (SD) (393) 26.1 (4.3) (573) 25.5 (4.0)* (346) 25.5 (3.8)* .03
Total energy intake (kcal/d)
(N) mean (SD) (423) 1544 (502) (615) 1641 (503)* (372) 1680 (498)* <.001 Hypertension, (N) % (213) 50.5 (302) 49.3 (203) 54.6 .26 Hypercholesterolemia, (N) % (142) 33.8 (217) 35.5 (150) 40.4 .13 Diabetes, (N) % (49) 11.6 (54) 8.8 (31) 8.3 .22 Smoking status, (N) % .08 never (270) 63.8 (391) 63.6 (238) 64.0 ex-smoker (126) 29.8 (184) 29.9 (124) 33.3 current smoker (27) 6.4 (40) 6.5 (10) 2.7 Stroke, (N) % (10) 2.4 (8) 1.3 (6) 1.6 .42 Number of drug/d >5, (N) % (228) 53.9 (294) 47.8 (171) 46.0 .06 ApoE4 carrier, (N) % (63) 16.8 (105) 18.8 (63) 18.3 .73
(N) mean (SD)
MMSE score (423) 27.6 (1.9) (611) 27.7 (1.9) (372) 27.6 (2.0) .39
IST score (422) 31.0 (6.5) (602) 32.1 (6.5)* (367) 31.7 (6.4) .02
BVRT score (414) 11.3 (2.2) (598) 11.6 (2.1) (369) 11.7 (2.1) .08
FCSRT score (386) 24.1 (6.8) (563) 24.1 (6.7) (347)24.9 (6.5) .19
Annual cognitive decline
(N) mean (SD) MMSE score (411) -0.20 (0.63) (597) -0.12 (0.49) (362) -0.07 (0.62)* .01 IST score (394) -0.76 (1.44) (561) -0.81 (1.35) (343) -0.87 (1.43) .54 BVRT score (384) -0.08 (0.57) (553) -0.05 (0.5) (342) -0.08 (0.58) .61 FCSRT score (283) -0.24 (1.11) (438) -0.04 (1.13) (264) +0.02 (1.17)* .02
Incidence of dementia (for 100 person-years) (95% CI)
2.02 (1.36 – 2.68) 1.51 (1.05 – 1.98) 1.45 (0.86 – 2.04) .64
Commentaire [mw1] : Au: It is surprising that this result is significantly different since the values are so close. Can you please verify?
Abbreviations: MeDi Mediterranean diet, MMSE Mini-Mental State Examination; IST Isaacs Set Test; BVRT Benton Visual Retention Test; FCRST Free and Cued Selective Reminding Test; BMI, Body Mass Index; CES-D Center for Epidemiological Studies-Depression scale; ApoE4 Apolipoprotein E ε4
P -value for the Chi-Square test or analysis of variance (ANOVA) among categories of Mediterranean diet score
* 2X2 significant comparisons (P<0.05) for means of age, mean baseline cognitive scores, mean annual cognitive decline, BMI, CES-D score, and energy intake between categories of Mediterranean diet score taking the lowest category as reference group
Table 3. Change in cognitive performances per additional unit of the Mediterranean diet score (0-9) over 5 years of follow-up among older persons living in Bordeaux, The Three-City study (2001-2007).
MMSE
30 −
Model 1 * (N=1268) Model 2 (N=1180) Model 3 (N=1264)
β 95% CI P β 95% CI P β 95% CI P
Time -0.25 -0.40 - -0.08 .003 -0.32 -0.52 - -0.13 <.001 -0.24 -0.40 - -0.08 .004
MeDiscore (0-9), baseline
testing
0.004 -0.02 – 0.02 .71 0.008 -0.01 – 0.03 .49 0.005 -0.02 – 0.03 .60
MeDi score X time
-0.006 0.01 -0.0004 .05 -0.006 0.01 – -0.0004 .03 -0.005 -0.01 – 0.0001 .06 FCSRT
Model 1 Model 2 Model 3
β 95% CI P β 95% CI P β 95% CI P
MeDi score (0-9), baseline testing
0.12 -0.09 – 0.33 .25 0.09 -0.13 – 0.31 .42 0.11 -0.09 – 0.33 .29
MeDi score X time 0.04 -0.01 – 0.08 .11 0.04 -0.004 – 0.09 .07 0.04 -0.008 – 0.08 .11
IST
Model 1 Model 2 Model
3
β 95% CI P β 95% CI P β 95% CI P
Time 0.99 -0.59 – 2.59 .22 1.65 -0.22 – 3.52 .08 0.98 -0.62 – 2.58 .23
MeDi score (0-9), baseline testing
0.14 -0.16 – 0.44 .37 0.07 -0.24 – 0.39 .64 0.11 -0.19 – 0.41 .46
MeDi score X time 0.01 -0.04 – 0.07 .59 0.03 -0.03 – 0.08 .31 0.01 -0.04 – 0.07 .60
BVRT
Model 1 Model 2 Model 3
β 95% CI P β 95% CI P β 95% CI P
Time 0.57 0.10 – 1.03 .02 0.79 0.24 – 1.33 .005 0.51 0.04 – 0.97 .03
testing
MeDi score X time -0.002 -0.02 – 0.01 .78
-0.0005
-0.02 – 0.01 .95 -0.03 -0.02 – 0.01 .74
Abbreviations: MeDi Mediterranean diet; MMSE Mini-Mental State Examination; IST Isaacs Set Test; BVRT Benton Visual Retention Test; FCSRT Free and Cued Selective Reminding Test; CI Confidence Intervals
* Linear mixed models: the beta coefficient for MeDi score represents the association of MeDi with baseline mean cognitive scores and the beta
coefficient for the MeDi interaction with time (i.e., the slope) represents the association of MeDi with the change in cognitive scores over time.
For MMSE x time, a negative beta coefficient indicates that a higher MeDi score was associated with fewer MMSE errors over time, whereas for
FCSRT, IST and BVRT, a positive beta coefficient indicates slower decline in cognitive performance.
Model 1: Model adjusted for age, sex, education, marital status, total energy intake, practice of physical exercise, taking ≥5 drugs/d, Center for Epidemiological Studies-Depression scale score and Apolipoprotein E genotype and their interaction with time
Model 2: Model 1 + additional adjustment for Body Mass Index, hypertension, hypercholesterolemia, diabetes and tobacco and their interaction with time
Table 4. Evolution of cognitive performances over 5 years of follow-up by categories of Mediterranean diet score among older persons living in Bordeaux, The Three-City study (2001-2007).
MMSE
30 −
Model 1* (N=1268) Model 2 (N=1180) Model 3 (N=1264)
β 95% CI P Overall β 95% CI P Overall β 95% CI P Overall
Time -0.26 -0.42 - -0.10 .001 -0.34 -0.53 – 0.15 <.001 -0.25 -0.41 - -0.09 .002
Middle Category (MeDi 4-5), baseline testing
-0.03 -0.11 – 0.05 .45 0.006 -0.08 – 0.09 .88 -0.02 -0.11 – 0.06 .55
High Category (MeDi 6-9), baseline testing 0.01 -0.09 – 0.10 .89 .61 0.02 -0.08 – 0.11 .74 .94 0.01 -0.08 – 0.11 .77 .63 Middle Category X time -0.01 -0.03 – 0.01 .35 -0.02 -0.04 – 0.003 .10 -0.001 -0.03 – 0.01 .37 High Category X time -0.02 -0.05 – 0.001 .06 .18 -0.02 -0.05 – 0.0007 .06 .13 -0.02 -0.05 – 0.002 .07 .19
FCSRT
Model 1 Model 2 Model 3
β 95% CI P Overall β 95% CI P Overall β 95% CI P Overall
Time 0.58 -0.75 – 1.91 .39 0.08 -1.47 – 1.62 .92 0.49 -0.84 – 1.83 .47
Middle Category (MeDi 4-5), baseline testing
-0.30 -1.13 – 0.52 .47 -0.49 -1.35 – 0.37 .26 -0.34 -1.17 – 0.49 .42
High Category (MeDi 6-9), baseline testing 0.58 -0.35 – 1.50 .22 .12 0.49 -0.47 – 1.46 .32 .28 0.54 -0.38 – 1.47 .25 .32 Middle Category X time 0.15 -0.003 – 0.32 .10 0.13 -0.04 – 0.31 .14 0.14 -0.03 – 0.32 .11 High Category X time 0.19 -0.008 – 0.38 .06 .13 0.19 -0.007 – 0.39 .06 .15 0.19 -0.01 – 0.38 .06 .14 IST
Model 1 Model 2 Model 3
Time 1.09 -0.48 – 2.67 .17 1.78 -0.07 – 3.64 .06 1.07 -0.52 – 2.66 .19 Middle Category
(MeDi 4-5), baseline testing
1.51 0.32 – 2.70 .01 1.32 0.08 – 2.55 .04 1.39 0.20 – 2.58 .02
High Category (MeDi 6-9), baseline testing 0.66 -0.68 – 1.99 .33 .04 0.51 -0.89 – 1.90 .48 .10 0.54 -0.80 – 1.87 .43 .06 Middle Category X time -0.07 -0.28 – 0.14 .50 -0.01 -0.22 – 0.21 .94 -0.07 -0.29 – 0.14 .50 High Category X time 0.01 -0.23 – 0.25 .93 .69 0.09 -0.16 – 0.33 .48 .66 0.01 -0.23 – 0.25 .93 .69 BVRT
Model 1 Model 2 Model 3
β 95% CI P Overall β 95% CI P Overall β 95% CI P Overall
Middle Category (MeDi 4-5), baseline testing
0.08 -0.16 – 0.33 .50 0.02 -0.22 – 0.27 .84 0.08 -0.16 – 0.32 .51
High Category (MeDi 6-9), baseline testing 0.07 -0.20 – 0.34 .60 .78 0.01 -0.27 – 0.29 .94 .98 0.07 -0.20 – 0.34 .62 .80 Middle Category X time 0.04 -0.02 – 0.10 .25 0.04 -0.02 – 0.10 .18 0.03 -0.03 – 0.09 .29 High Category X time 0.02 -0.05 – 0.08 .65 .50 0.03 -0.04 – 0.10 .44 .41 0.01 -0.06 – 0.08 .71 .55
Abbreviations: MeDi Mediterranean diet; MMSE Mini-Mental State Examination; IST Isaacs Set Test; BVRT Benton Visual Retention Test; FCSRT Free and Cued Selective Reminding Test; CI Confidence Intervals
* Linear mixed models: the beta coefficient for MeDi score represents the association of MeDi with baseline mean cognitive scores and the beta
coefficient for the MeDi interaction with time (i.e., the slope) represents the association of MeDi with the change in cognitive scores over time.
FCSRT, IST and BVRT, a positive beta coefficient indicates slower decline in cognitive performance.The lowest category of MeDi score was chosen as referent.
Model 1: Model adjusted for age, sex, education, marital status, total energy intake, practice of physical exercise, taking ≥5 drugs/d, Center for Epidemiological Studies-Depression scale score and Apolipoprotein E genotype and their interaction with time
Model 2: Model 1 + additional adjustment for Body Mass Index, hypertension, hypercholesterolemia, diabetes and tobacco and their interaction with time
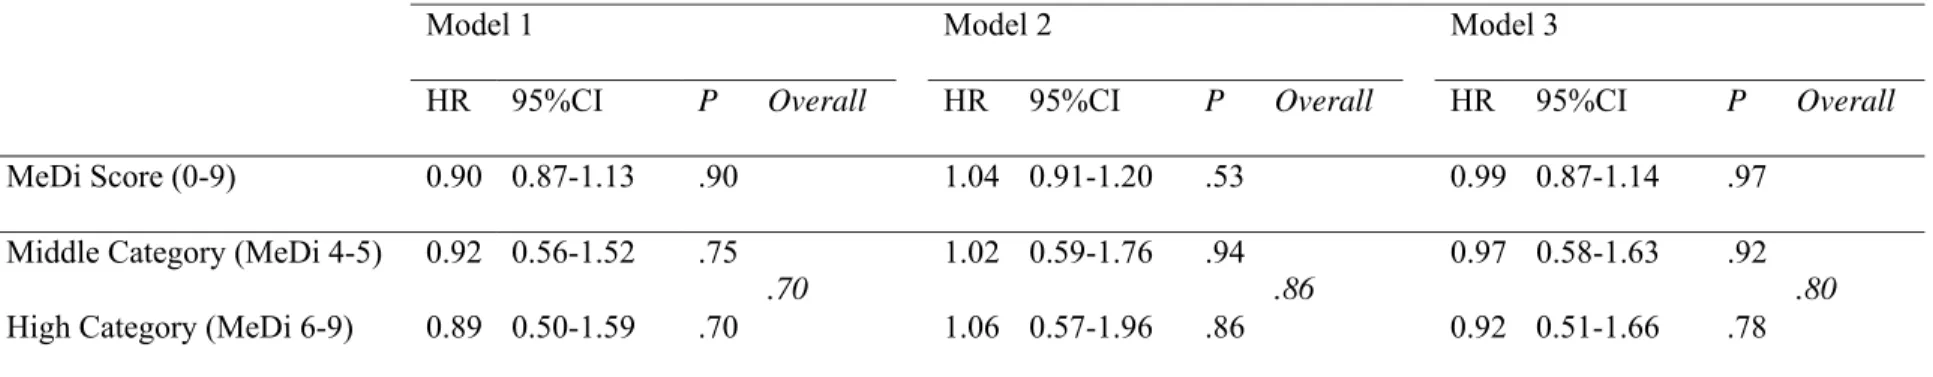
Table 5. Mediterranean Diet adherence and age-adjusted risk for dementia and Alzheimer Disease among older persons living in Bordeaux, The
Three-City study, wave 1 (2001-2002). (N=99 incident cases of dementia, N=66 incident cases of Alzheimer Disease) Risk for dementia for an increase of 1 point of MeDi score or compared to the low MeDi score category
Model 1 Model 2 Model 3
HR 95%CI P Overall HR 95%CI P Overall HR 95%CI P Overall
MeDi Score (0-9) 0.90 0.87-1.13 .90 1.04 0.91-1.20 .53 0.99 0.87-1.14 .97
Middle Category (MeDi 4-5) 0.92 0.56-1.52 .75 1.02 0.59-1.76 .94 0.97 0.58-1.63 .92
High Category (MeDi 6-9) 0.89 0.50-1.59 .70
.70
1.06 0.57-1.96 .86
.86
0.92 0.51-1.66 .78
.80
Risk for Alzheimer Disease for an increase of 1 point of MeDi score or compared to the low MeDi score category
Model 1 Model 2 Model 3
HR 95%CI P Overall HR 95%CI P Overall HR 95%CI P Overall
MeDi Score (0-9) 0.92 0.78 – 1.08 .92 0.99 0.83 – 1.17 .88 0.93 0.79 – 1.09 .37 Middle Category (MeDi 4-5) 0.76 0.42 – 1.39 .38 0.93 0.48 – 1.79 .82 0.80 0.43 – 1.46 .46 High Category (MeDi 6-9) 0.67 0.33 – 1.37 .28 .26 0.81 0.37 – 1.75 .59 .59 0.70 0.34 – 1.43 .33 .31
P -value for Cox proportional hazard models with delayed entry and age as a time scale.
Model 1: Model adjusted for sex, education, marital status, total energy intake, practice of physical exercise, taking ≥5 drugs/d, Center for Epidemiological Studies-Depression scale score and Apolipoprotein E genotype
Model 2: Model 1 + additional adjustment for Body Mass Index, hypertension, hypercholesterolemia, diabetes and tobacco Model 3: Model 1 + additional adjustment for stroke
Table 6. Change in cognitive performance over 5 years of follow-up for each additional unit of the Mediterranean diet score (0-9) among older
persons, excluding those who developed incident dementia, living in Bordeaux, The Three-City study (2001-2007).
MMSE
30 −
Model 1 * (N=1182) Model 2 (N=1104) Model 3 (N=1180)
β 95% CI P β 95% CI P β 95% CI P
Time -0.11 -0.27 - -0.05 .19 -0.14 -0.33 - 0.05 .14 -0.10 -0.26 - 0.06 .22 MeDiscore (0-9) 0.009 -0.01 – 0.03 .40 0.01 -0.01 – 0.03 .25 0.01 -0.01 – 0.03 .36 MeDi score X time -0.005 -0.01 - 0.0003 .06 -0.006 -0.01 – 0.0007 .03 -0.005 -0.01 – 0.0003 .06
FCSRT
Model 1 Model 2 Model 3
β 95% CI P β 95% CI P β 95% CI P
Time 0.49 -0.84 – 1.82 .47 -0.09 -1.63 – 1.46 .91 0.46 -0.87 – 1.80 .50 MeDi score (0-9) 0.07 -0.14 – 0.28 .52 0.03 -0.19 – 0.25 .78 0.07 -0.14 – 0.28 .50 MeDi score X time 0.04 -0.0007 – 0.09 .05 0.05 0.006 – 0.10 .03 0.04 -0.001 – 0.09 .06
IST
Model 1 Model 2 Model 3
β 95% CI P β 95% CI P β 95% CI P
Time 0.16 -1.45 – 1.76 .85 0.39 -1.52 – 2.30 .69 0.11 -1.50 – 1.72 .89 MeDi score (0-9) 0.05 -0.26 – 0.37 .74 0.01 -0.32 – 0.34 .93 0.03 -0.28 – 0.35 .82 MeDi score X time 0.02 -0.03 – 0.08 .42 0.04 -0.02 – 0.09 .18 0.02 -0.03 – 0.08 .43
BVRT
Model 1 Model 2 Model 3
β 95% CI P β 95% CI P β 95% CI P
Time 0.47 -0.004 – 0.94 .05 0.62 0.06 – 1.18 .03 0.45 -0.02 – 0.93 .06 MeDiscore (0-9) 0.01 -0.05 – 0.07 .67 0.004 -0.06 – 0.07 .90 0.01 -0.05 – 0.07 .66 MeDi score X time -0.004 -0.02 – 0.01 .65 -0.002 -0.02 – 0.01 .83 -0.003 -0.02 – 0.01 .63
Abbreviations: MeDi Mediterranean diet; MMSE Mini-Mental State Examination; IST Isaacs Set Test; BVRT Benton Visual Retention Test; FCSRT Free and Cued Selective Reminding Test; CI Confidence Intervals
* Linear mixed models: the beta coefficient for MeDi score represents the association of MeDi with baseline mean cognitive scores and the beta
coefficient for the MeDi interaction with time (i.e., the slope) represents the association of MeDi with the change in cognitive scores over time.
For MMSE x time, a negative beta coefficient indicates that a higher MeDi score was associated with fewer MMSE errors over time, whereas for
FCSRT, IST and BVRT, a positive beta coefficient indicates slower decline in cognitive performance.
Model 1: Model adjusted for age, sex, education, marital status, total energy intake, practice of physical exercise, taking ≥5 drugs/d, Center for Epidemiological Studies-Depression scale score and Apolipoprotein E genotype and their interaction with time
Model 2: Model 1 + additional adjustment for Body Mass Index, hypertension, hypercholesterolemia, diabetes and tobacco and their interaction with time
Table 7. Change in cognitive performances over 5 years of follow-up by categories of Mediterranean diet score among older persons, excluding
those who developed incident, living in Bordeaux, The Three-City study (2001-2007).
MMSE
30 −
Model 1* (N=1182) Model 2 (N=1104) Model 3 (N=1180)
β 95% CI P Overall β 95% CI P Overall β 95% CI P Overall
Time -0.12 -0.28 - 0.04 .14 -0.16 -0.35 - -0.03 .10 -0.11 -0.27 - 0.05 .16 Middle Category
(MeDi 4-5), baseline testing
-0.02 -0.11 – 0.06 .59 0.01 -0.07 – 0.10 .72 -0.02 -0.10 – 0.06 .65
High Category (MeDi 6-9), baseline testing 0.02 -0.07 – 0.12 .60 .54 0.04 -0.06 – 0.14 .45 .75 0.03 -0.06 – 0.12 .53 .52 Middle Category X time -0.01 -0.03 – 0.009 .27 -0.02 -0.04 – 0.0007 .06 -0.01 -0.06 – 0.001 .27
High Category X time -0.02 -0.04 – 0.002 .07
.19 -0.02 -0.05 - -0.0007 .04 .08 -0.02 -0.05 – 0.001 .06 .18 FCSRT
Model 1 Model 2 Model 3
β 95% CI P Overall β 95% CI P Overall β 95% CI P Overall
Time 0.58 -0.74 – 1.90 .39 0.04 -1.49 – 1.57 .96 0.55 -0.77 – 1.87 .41 Middle Category
(MeDi 4-5), baseline testing
-0.34 -1.17 – 0.49 .42 -0.51 -1.37 – 0.35 .25 -0.33 -1.16 – 0.50 .44
High Category (MeDi 6-9), baseline testing 0.37 -0.56 – 1.29 .44 .25 0.27 -0.70 – 1.23 .59 .18 0.38 -0.55 – 1.31 .42 .25 Middle Category X time 0.18 0.006 – 0.35 .04 0.17 -0.007 – 0.35 .06 0.18 0.002 – 0.35 .048
High Category X time 0.19 0.001 – 0.39 .048
.07 0.21 0.01 – 0.41 .04 .08 0.19 -0.003 – 0.39 .05 .08 IST
Model 1 Model 2 Model 3
β 95% CI P Overall β 95% CI P Overall β 95% CI P Overall
Middle Category (MeDi 4-5), baseline testing
1.42 0.20 – 2.65 .02 1.22 -0.06 – 2.50 .06 1.34 0.11 – 2.57 .03
High Category (MeDi 6-9), baseline testing 0.36 -1.01 – 1.74 .60 .05 0.26 -1.19 – 1.70 .72 .13 0.27 -1.10 – 1.65 .70 .06 Middle Category X time -0.05 -0.26 – 0.16 .62 0.01 -0.20 – 0.24 .89 -0.05 -0.27 – 0.16 .62
High Category X time 0.02 -0.22 – 0.25 .89
.79 0.10 -0.15 – 0.35 .43 .69 0.01 -0.22 – 0.26 .90 .79 BVRT
Model 1 Model 2 Model 3
β 95% CI P Overall β 95% CI P Overall β 95% CI P Overall
Time 0.43 -0.04 – 0.90 .07 0.62 0.05 – 1.19 .03 0.42 -0.05 – 0.89 .08 Middle Category (MeDi 4-5), baseline testing 0.04 -0.19 – 0.29 .71 .90 -0.002 -0.25 – 0.25 .98 .98 0.05 -0.19 – 0.29 .70 .89
High Category (MeDi 6-9), baseline testing 0.06 -0.21 – 0.33 .66 0.02 -0.26 – 0.30 .91 0.06 -0.21 – 0.33 .65 Middle Category X time 0.03 -0.03 – 0.10 .30 0.042 -0.02 – 0.11 .20 .41 0.03 -0.03 – 0.09 .31
High Category X time 0.002 -0.07 – 0.07 .94
.48
0.017 -0.06 – 0.09 .65 0.002 -0.07 – 0.07 .95
.50
Abbreviations: MeDi Mediterranean diet; MMSE Mini-Mental State Examination; IST Isaacs Set Test; BVRT Benton Visual Retention Test; FCSRT Free and Cued Selective Reminding Test; CI Confidence Intervals
* Linear mixed models: the beta coefficient for MeDi score represents the association of MeDi with baseline mean cognitive scores and the beta
coefficient for the MeDi interaction with time (i.e., the slope) represents the association of MeDi with the change in cognitive scores over time.
For MMSE x time, a negative beta coefficient indicates that a higher MeDi score was associated with fewer MMSE errors over time, whereas for
FCSRT, IST and BVRT, a positive beta coefficient indicates slower decline in cognitive performance.
Model 1: Model adjusted for age, sex, education, marital status, total energy intake, practice of physical exercise, taking ≥5 drugs/d, Center for Epidemiological Studies-Depression scale score and Apolipoprotein E genotype and their interaction with time
Model 2: Model 1 + additional adjustment for Body Mass Index, hypertension, hypercholesterolemia, diabetes and tobacco and their interaction with time