DOE/ET-51013-321
Charged Fusion Product Diagnostic
on the Alcator C-Mod Tokamak
D.H.C. Lo
November 1996
This work was supported by the U. S. Department of Energy Contract No. DE-AC02-78ET51013. Reproduction, translation, publication, use and disposal, in whole or in part by or for the United States government is permitted.
Charged Fusion Product Diagnostic
on the Alcator C-Mod Tokamak
by
Daniel Hung Chee Lo
B.S., Nuclear Engineering, University of Wisconsin
-
Madison (1988)
Submitted to the Department of Nuclear Engineering
in partial fulfillment of the requirements for the degree of
Doctor of Philosophy
at the
MASSACHUSETTS INSTITUTE OF TECHNOLOGY
October 1996
©
1996 Massachusetts Institute of Technology. All rights reserved.
Author..
Certified
Certified by....
Certified by....
.... ..epartment of Nuclear Engineering
October 14, 1996
b)y...
Rejean L. Boivin
Research Scientist, Plasma Fusion Center
Thesis Supervisor
Richard D. Petrasso
Principal Research Scientist, Plasma Fusion Center
Thesis Supervisor
... ...
Ian H. Hutchinson
Professor, Department of Nuclear Engineering
Thesis Reader
Accepted by ...
Charged Fusion Product Diagnostic
on the Alcator C-Mod Tokamak
by
Daniel Hung Chee Lo
Submitted to the Department of Nuclear Engineering on October 14, 1996, in partial fulfillment of the
requirements for the degree of Doctor of Philosophy
Abstract
This thesis presents the development and experimental results of a charged fusion product (CFP) spectrometer for the Alcator C-Mod tokamak. Based on an ion-implanted silicon detector, the spectrometer has a reentrant design that brings the detector inside the vacuum vessel of Alcator C-Mod for intercepting CFPs. A 3-dimensional orbit code, EPSILON, has been written to calculate the CFP detection efficiency. The calculated efficiency has an overall uncertainty of 29% due to uncer-tainties in the poloidal field structure, the dimension/location of the spectrometer, and the fusion source profile.
The detection of D-D protons has made possible the independent measurements of the fusion rate in Alcator C-Mod. General agreement with fusion rates measured with the neutron diagnostic system were found. The plasma current dependence of the D-D proton flux agrees well with results from modelling by EPSILON. From the measured D-D proton linewidths in the energy spectrum, central ion temperature measurements have been made in ohmic discharges. These were found to compare well with the temperature measurements made from other diagnostics.
Through benchtop experiments and MCNP modeling, competing signals from neutron-capture 'y rays and neutrons generated during plasma discharges are found to limit the operating range of the CFP spectrometer. Given the finite counting capa-bility of the electronics, these counts dominate at high neutron rates. Consequently, fusion rate measurements have been possible for discharges with neutron rate of up to about 6 x10" /s, whereas satisfactory ion temperature measurements have been restricted to cases where the neutron rate is below 0.4 x 10" /s. The combined effects of detector volume reduction, processing speed enhancement of the electronics, and optimized detector shielding need to be studied to eradicate the problem.
Thesis Supervisor: Richard D. Petrasso
Acknowledgments
I would like to thank my supervisors R6jean Boivin and Richard Petrasso for their advice and assistance at different stages of my graduate student career here. Heartfelt thanks to R6jean for his guidance, tolerance, understanding, and encouragement that have made the completion of my thesis possible and have kept me from going over the edge. And to Rich, thanks for introducing me to the many aspects of scientific research. I also thank Prof. Ian Hutchinson for his critical reading of my thesis and
his many probing questions.
A warm thank-you also goes out to the many technicians, scientisits and engineers, and support staff of Alcator C-Mod. I want to especially thank Prof. Kevin Wenzel for his advice and friendship. I thank Dr. Catherine Fiore and Dr. John Rice for their discussion and assistance on various technical issues. I thank Dr. Bob Granetz for entertaining my many silly questions even when I caught him at the worst times. And to Frank Silva, Ed Fitzgerald, and Bob Childs, thanks again and again!
Thanks to my parents and my sister for their constant love and belief in me throughout my years at MIT. It brings me comfort and stability to know that you have always been behind me. And then there are all the friends, especially Vinh and PJ, who have kept me afloat when the weight felt too overwhelming. I also especially treasure the friendship of Maria, Mercedes, Gerry, Bob G., Chi Kang, Jody, Jim L., Jim R., Dimitri, and Cristina. Saving the best for last, I express my love and gratitude to Judith for having gone through it all with me.
Part of the research was performed under appointment to the Magnetic Fusion Energy Technology Fellowship program administered by Oak Ridge Associated Uni-versities for the U.S. Department of Energy.
Contents
1 Introduction
1.1 Fusion . . . . 1.2 Tokamak . . . .. .. . .. 1.3 Charged Fusion Products as a Diagnostic 1.4 The Alcator C-Mod Tokamak . . . .
1.4.1 Machine Characteristics... 1.4.2 Description of Related Diagnostics 1.5 Thesis Organization . . . . 17 17 18 19 25 25 27 29 and Systems
2 Charged Fusion Products from the Cockcroft-Walton erator
2.1 Cockcroft-Walton Linear Accelerator . . . . 2.2 Beam Target Reaction Kinematics . . . . 2.3 Experimental Results . . . . 2.3.1 D-D Reaction . . . . 2.3.2 D-3He Reaction . . . . 2.3.3 D-T Reaction . . . . 2.3.4 Other Reactions . . . . Linear Accel-31 31 34 37 37 42 43 45 3 Experimental Studies of Charged-Particle Sensitive Depth in Silicon
Detectors
3.1 Charged Particle Interaction with Matter . . . .
47
3.2 Semiconductors as Charged Particle Detectors . . . . 50
3.3 Apparatus and Source of Charged Particles . . . . 54
3.4 Results and Discussion . . . . 55
4 The Charged Fusion Product Spectrometer 61 4.1 Mechanical Design . . . .... 61
4.2 Electrical Design . . . . 66
4.3 Later Modifications . . . . 69
4.4 Calibration . . . . 72
4.5 Dead Time Correction . . . . 73
5 Orbit Calculations 77 5.1 Charged Fusion Product Orbits . . . . 77
5.1.1 Physics Model of Code . . . . 78
5.1.2 Inputs . . . . 82
5.1.3 Fusion Source Profile . . . . 82
5.2 Detection Efficiency Calculations . . . . 86
5.2.1 The Code EPSILON . . . . 86
5.2.2 Validity Check . . . . 93
5.2.3 Uncertainty . . . . 96
5.3 Prompt Loss Studies . . . . 100
6 Fusion Reaction Rate Measurements 105 6.1 Charged Fusion Products from Alcator C-Mod . . . . 105
6.1.1 Spectral Time Evolution . . . . 105
6.1.2 Effects of Ranging Foils . . . . 108
6.1.3 Reverse Field Operation . . . . 111
6.2 Fusion Rate . . . . 112
6.2.1 SCA Fusion Rate Time History . . . 112
6.3 Current Scan . . . . 7 Ion 7.1 7.2 7.3 Temperature Diagnostic
Fusion Reaction Rate . . . . . . .. Ion Temperature from Energy Spectra . . . . Temperature Measurements . . . . 7.3.1 Spectral Analysis . . . . 7.3.2 Discussion . . . . 7.3.3 Difficulties at High Neutron Rate . . . . 8 Problems with the CFP Spectrometer
8.1 Influences of Hard X Rays . . . . 8.2 Influences of Neutrons . . . . 8.2.1 Correlation of Low-Energy Background Counts w Signal . . . . 8.2.2 Neutron Spectrum . . . . 8.2.3 Neutron Interaction . . . . 8.2.4 Experimental Investigation of Detector Sensitivity 8.2.5 Detector Response . . . . 8.3 No ICRF Pickup . . . . 8.4 Electronics . . . . 8.4.1 Charge Sensitive Preamplifier . . . . 8.4.2 Shaping Amplifier . . . . 8.4.3 Multichannel Analyzer . . . . 8.4.4 Overall High Count Rate Scenario . . . .
9 Summary and Future Work
9.1 Summary ... ... 9.2 Further Investigation ... ith Neutron 118 125 125 128 133 133 138 143 145 147 151 153 154 156 159 164 171 171 173 173 174 176 179 179 180
A The Cluster-Impact Fusion Debacle 183
B Evaluation of f SdV and f Sdr 187
List of Figures
The Tokamak . . . . 20
Charged fusion product orbits in tokamak .. . . . 22
Cross-section of the Alcator C-Mod tokamak . . . . 26
Schematic of the Cockcroft-Walton accelerator . . . . 32
Schematic diagram of the target chamber . . . . 33
Binary nuclear reaction . . . . 34
D-D proton Kinematics . . . . 35
D-D charged fusion product spectra . . . . 38
D-D 3He spectrum . . . . 39
D-D neutron spectra . . . . 40
Spectrum of D-3He fusion products . . . . 42
D-T a spectrum . . . . 43
D-T neutron activated -y ray spectrum of copper . . . . 44
Li-p gamma spectra . . . . 46
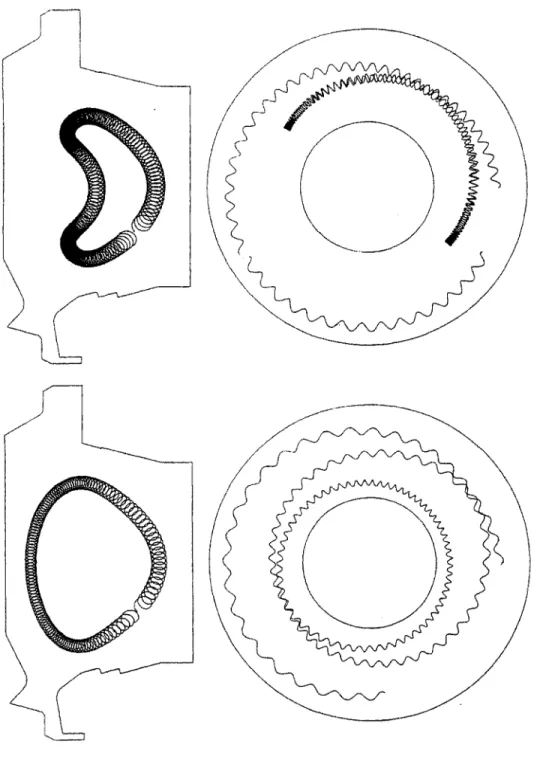
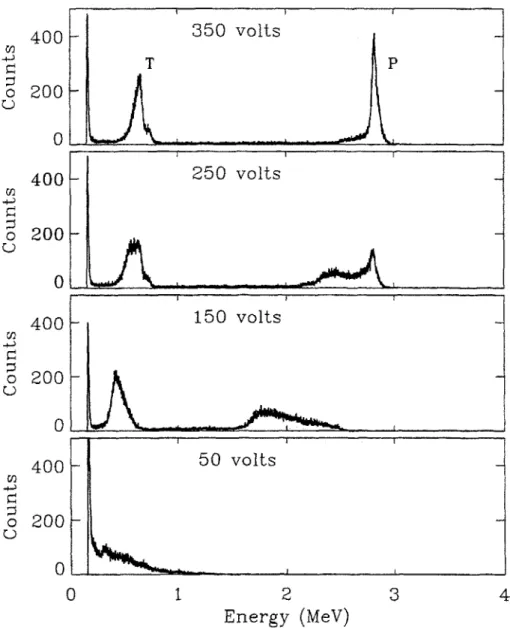
3.1 Unbiased and reverse biased p-n junctions . . . . 3.2 Series of spectra of SBD No. 16-662D . . . . . . . . 52
56
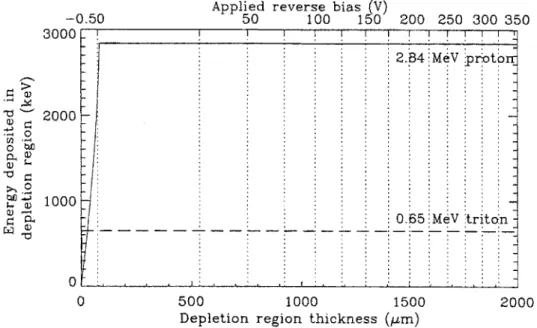
3.3 Comparison of the expected and the observed spectral energy shifts for SBD No. 16-662D . . . . 3.4 Series of spectra of SBD No. 30-020A . . . .
57 59 1.1 1.2 1.3 2.1 2.2 2.3 2.4 2.5 2.6 2.7 2.8 2.9 2.10 2.11
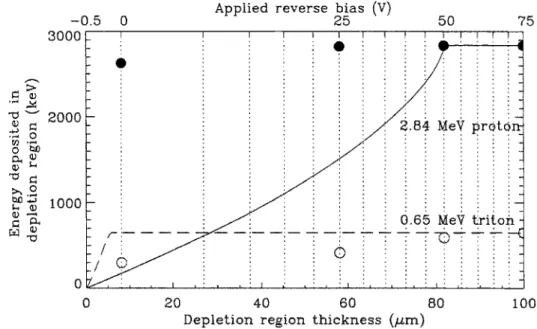
3.5 Expected energy deposition in SBD No. 30-020A as a function of the
bias voltage . . . . 60
4.1 Poloidal view of the CFP spectrometer on Alcator C-Mod . . . . 62
4.2 Sectional view of the spectrometer head assembly . . . . 63
4.3 Detailed look at the aperture cup . . . . 65
4.4 Sketch of slit/aperture of the CFP spectrometer . . . . 66
4.5 Schematic diagram of the electronics of the CFP spectrometer . . . . 67
4.6 Schematic of new design of the CFP spectrometer . . . . 70
4.7 In-vessel pictures of CFP spectrometer (modified version) at K port . 71 4.8 Calibration spectrum of the CFP spectrometer . . . . 73
4.9 Throughput reduction due to dead time . . . . 74
4.10 Dead time models . . . . 75
5.1 First wall of Alcator C-Mod in the model . . . . 80
5.2 Typical orbit of a trapped 3 MeV proton . . . . 81
5.3 Density profiles in Alcator C-Mod during ohmic discharges . . . . 83
5.4 Fusion source profiles . . . . 85
5.5 Picture of plasma phase space volume from plasma to aperture . . . . 86
5.6 Aperture subdivision to achieve a more precise result . . . . 88
5.7 Convergence of calculated efficiency . . . . 89
5.8 Study of efficiency vs. pitch angle . . . . 90
5.9 Trapped, critical, and passing orbits at 8 T . . . . 91
5.10 3 MeV proton orbit in circular plasma with B = 10 T & I, = 1 kA . 93 5.11 Effects of source profile on detection efficiency . . . . 97
5.12 Effects of current uncertainty on detection efficiency . . . . 98
5.13 Initial and final positions of promptly lost 3 MeV protons . . . . 101
5.15 Prompt-loss fraction as a function of the plasma current 6.1 6.2 6.3 6.4 6.5 6.6 6.7 6.8 6.9 6.10 6.11 6.12 7.1 7.2 7.3 7.4 7.5 7.6 7.7 8.1 8.2 8.3 8.4 8.5
CFP spectra during ohmic discharge . . . 106
Time history of plasma parameters for ohmic discharge . . . . 107
Spectral downshift due to ranging foil . . . .. 109
CFP spectrum during reverse field operation . . . 111
Time history of fusion rate: proton vs. neutron . . . 113
Spectra of D-D protons for shot 950131003 . . . 114
Energy spectrum of 3 MeV protons . . . 116
Fusion rate - protons vs. neutrons . . . 117
Proton loss vs. current during run 960130 . . . 119
Current dependence of proton trajectory during run 960130 . . . 120
Proton loss vs. current during run 90603 . . . 121
Current dependence of proton trajectory during run 940603 . . . 123
Exact spectrum vs. gaussian spectrum of D-D protons . . . 132
Successive energy spectra of D-D protons . . . 134
Energy spectrum of 3 MeV protons . . . 135
Detected CFPs originate from the plasma center . . . 139
Central ion temperature calculated from D-D proton spectra . . . 140
Neutron rate and central ion temperature for shot 951130009 . . . 142
Energy spectra of D-D protons for shot 951201025 .. . . . 143
Locations of the CFP spectrometer and the monitor system's detector 146 Energy dependence of the photon reaction cross section in silicon . . 147
Time history of scaler showing sensitivity to hard x rays . . . 148
Hard x ray spectrum collected by the monitor spectrometer . . . 150
Time history of scaler vs. neutron rate . . . 152
8.6 Neutron spectra from both CFP and monitor spectrometers
8.7 Neutron and -y-Ray Spectra of 252Cf . . . . 158
8.8 2 52Cf source count rate vs. distance . . . . 160
8.9 2 52Cf source count rate vs. source angle . . . . 162
8.10 y-ray spectra . . . . 164
8.11 MCNP-calculated neutron fluxes and reaction yields . . . . 165
8.12 MCNP-calculated 7-ray fluxes and reaction yields . . . .. 166
8.13 Preamplifier pulse shape . . . . 172
8.14 Monitor system spectra with background and pulser counts . . . . 175
A.1 Geometry of the Brookhaven experiment . . . . 184 155
List of Tables
Some important parameters of Alcator C-Mod . . . .
Comparison of measured neutron energies in spectra of 3H tional counter with prediction . . . .
Ranges of charged particles in silicon . . . . SB D List . . . . Low current efficiency comparison . . . .
Energy loss in aluminum . . . .
x, vo/v, and Ej/E for run 940603 . . . . Spectral peak FWHM for several fusion reactions . . . . .
Neutron-induced background counts . . . . List of y-ray sources . . . .
Summary of calculated neutron and -y-ray fluxes . . . . Summary of calculated number of reactions from -y ray . .
Energy spread of D-D protons vs. incident deuteron energy
Line integal coefficient vs. a . . . .
25 e propor-. propor-. propor-. propor-. propor-. propor-. 41 . . . . 50 . . . . 55 . . . . 96 . . . . 110 . . . . 122 . . . . 133 . . . . 156 . . . . 163 . . . . . . 168 . . . . 168 . . . . 185 . . . . 188 1.1 2.1 3.1 3.2 5.1 6.1 6.2 7.1 8.1 8.2 8.3 8.4 A.1 B.1
Chapter 1
Introduction
1.1
Fusion
The thermonuclear reaction or fusion of light nuclei creates fusion products and re-leases immense amounts of energy. Such thermonuclear reactions are responsible for the energy production and nucleosynthesis of the elements in stars. Almost all the energy sources on earth can be traced back to fusion reactions that took place in the sun.
The importance of fusion as a major energy source of the future with an essentially inexhaustible fuel supply was generally recognized decades ago [1]. Fusion reactors will be inherently safe from possible nuclear excursions and can present fewer radioac-tivity problems than fission reactors. Compared to the burning of fossil fuels, fusion is also less damaging to the environment. In addition, very efficient energy conversion should be possible in the future with fusion reactors exclusively. Therefore, fervent research activities in fusion have always evolved around the goal of harnessing ther-monuclear fusion on earth safely and economically to provide power commercially for years to come.
two particle branches of the D-D reaction:
D + D -+ p (3.02 MeV) + T (1.01 MeV) (1.1)
D + D -- n (2.45 MeV) + 3He (0.82 MeV) (1.2)
each of which occurs with roughly equal probability in the temperature regimes of modern-day fusion research. (The kinetic energy that each product of the reaction has in the center-of-mass frame of the system has been included.) The products T and 3He are themselves fusible with deuterium, resulting in the secondary reactions
D + 3He -+ p (14.7 MeV) + a (3.6 MeV) (1.3)
D+T - n (14.1 MeV) + a (3.5 MeV). (1.4)
In fact, the D-T reaction, having the highest cross section for deuteron energies of less than 400 keV, is really the most promising fuel cycle. However, since tritium is radioactive (beta emitter with a half-life of 12.3 years), special handling is required if used as a fuel for research. Thus, fusion research has primarily been done with the D-D primary fuel cycle.
1.2
Tokamak
To achieve fusion, the nuclei of the fuel particles have to be brought to close contact (of order a Fermi or 1015 m) for the reaction probability to become appreciable. Thus, the strong mutual repulsion of the positively charged nuclei has to be overcome. The most practical method is to heat the fuel particles as a whole to a sufficiently high temperature (of order 10 keV). This method is referred to as thermonuclear fusion.
At such temperature, the fuel particles are fully ionized. The resulting collection of ions and electrons is called a plasma.
How does one contain such a fuel mixture for fusion to take place in a controlled fashion? The most advanced design of a containment scheme is a torus known as the tokamak, which is a closed magnetic field device. Figure 1.1 is a schematic of a tokamak. The name is an acronym extracted from the Russian words TOroidalnaya
KAmera ee MAgnitaya Katushka which stand for "Toroidal Chamber with Magnetic Coil." Tokamaks are designed to operate with toroidal magnetic field coils and plasma currents which act to magnetically confine plasma ions (like deuterons) and electrons. The principal magnetic field is the toroidal field which is provided by external mag-netic field coils. The presence of a substantial toroidal plasma current, which is a fundamental feature of the tokamak design [2,3], gives rise to a poloidal magnetic field essential to the plasma equilibrium. There are also external poloidal field coils in the design - equilibrium coils necessary for the vertical stability of the plasma,
and ohmic transformer coils for the ohmic heating of the plasma. The objective is to confine the fuel ions magnetically in this device to a high enough density and heat it to a high enough temperature (often with other forms of auxiliary heating) for fusion to occur.
1.3
Charged Fusion Products as a Diagnostic
In the presence of a magnetic field B, a charged particle with charge q, mass m, and velocity v undergoes a helical motion about field lines, characterized by the gyroradius (also called the Larmor radius)
my1 _v 1
P = = = .(1.5)
qB w
where w, is the cyclotron frequency, and v1 is the component of the velocity that is
Toroidal Magnetic Field Coil
Equilibrium Field Coils
Ohmic Transformer Stack
Figure 1.1:
Vacuum Vessel
Schematic of a tokamak, indicating its major components. The toroidal coordinate system (R, Z, p) and cylindrical coordinate system (r, 0, P) are interchangeable. (Figure courtesy of Darren Garnier)
The poloidal field from the plasma current changes the field structure from a purely toroidal one to one that has a slight twist poloidally as well. A measure of this can be given, in the cylindrical approximation, by the quantity
q(r) = rBo (1.6)
which is called the safety factor. Thus, charged particles gyrate about toroidal field lines that themselves are rotating poloidally around the plasma center in the tokamak geometry.
Now, a charged particle actually does not remain gyrating about the same field line when drift motions are present. The two most dominant drifts present in the
tokamak are the VB drift and curvature drift (see, for instance, Ref. [4]). The VB drift comes about because the magnetic field, dominated by the toroidal field, is inversely proportional to the major radius R. This sets up a gradient VB which points radially inward in the tokamak. The curvature drift arises from the centrifugal force felt by the particle as it moves along the curved field lines. These two drifts in the tokamak are in the same direction, either up or down. Figure 1.2 shows the poloidal projections of different orbits followed by charged fusion products (CFPs) in a tokamak. The drift direction is down in this case. The particles can be classified as either being trapped or passing.
To understand these orbits, the parallel and perpendicular components (both rela-tive to the local magnetic field) of a particle's energy, Ell and EI, have to be examined. Even though the total energy of a particle is conserved (i.e., E = Ell
+
Er), Eli andEl are changing with the local magnetic field. A quantity called the magnetic mo-ment A is invariant under a spatially and temporally varying magnetic field (see, for instance, Ref. [4]). It has the expression
Ei my(
Figure 1.2: Charged fusion product orbits in tokamak, illustrating the trapped and passing orbits, poloidal and top views.
Now as a particle gyrates about field lines that bring it up the magnetic gradient (which is radially pointing inward in the tokamak), vj has to increase according to
Eq. (1.7) such that y remains constant. In turn, the parallel velocity component vi
of the particle decreases such that E is conserved.
A trapped orbit comes about when a particle's parallel velocity (parallel to the
local magnetic field) continually transforms to its perpendicular velocity as it moves up the magnetic field gradient. A particle is trapped when its motion brings it to a point spatially such that the decreasing v11 vanishes and then becomes negative.
The particle's translational motion will reverse its direction. However, the particle's guiding center will not retrace its steps because of the drift motion. These trapped orbits are also known as banana orbits in reference to their appearance. The point where v11 = 0 is known as the banana tip. For another particle which has more of
its energy in the parallel direction, the reversal in motion may not occur and the resulting orbit is a passing orbit.
Considering trapped orbits, the loss of charged particles should be significant when its typical banana width A becomes comparable to or larger than about half the minor radius [5], i.e.
A ~> (1.8)
where q is the safety factor, R is the plasma major radius, a is the plasma minor radius, and por is the toroidal gyroradius. If there is a population of sufficiently energetic ions, e.g. CFPs, a fraction of this population should be able to escape such a confinement scheme. This escaping fraction naturally can be used for diagnostic purposes.
The idea of using CFPs as a diagnostic of the plasma condition in fusion research is not new
[6].
Even early on in fusion research [6], CFPs have been used as a di-agnostic of the plasma condition. After the fusion program shifted emphasis from the open magnetic configurations to toroidal schemes which eliminated end losses,however, detection of fusion products became more centered on the 2.45 MeV neu-tron from the D-D reaction because it is escaping readily from the plasma, unaffected by the presence of a closed toroidal magnetic field. Charged particles, on the other hand, have to have attained energies of order 1 MeV before a considerable fraction escapes the confinement. Even then, charged particle detectors have to be placed relatively close to the plasma, almost always requiring vacuum operation. The prox-imity of the detector to the plasma means that the detector has to operate in a hostile environment.
However, CFPs do have some decided advantages that make them an attractive candidate for diagnosing the plasma. Both CFP and neutron techniques are non-perturbative to the plasma. However, unlike neutrons, CFPs deposit their full energies in solids in short distances. Therefore, detectors of charged particles with essentially 100% detection efficiency can be made of very compact solid materials. In addition, very good energy resolution is possible when detecting charged particles, compared to neutrons. Furthermore, for certain aneutronic reactions, like the D-3He reaction (see Eq. (1.3)
),
CFPs are the only way to measure the fusion yield. The physics issues that have been studied in the fusion community with escaping CFPs are very diverse. They include: a-emission profile [7], 3He minority heating [8-10], plasma density measurements [11], ion temperature measurements [12-14], MeV ion confinement through 3He burnup [15], and various loss mechanisms [5,16].In this thesis, the development of a CFP spectrometer for the Alcator C-Mod tokamak is described. The original goal of deploying this diagnostic was to evaluate the effectiveness of 'He minority RF heating through the broadened spectrum of un-confined 14.7 MeV protons from D-3He reactions. Due to count-rate related problems that will be discussed in Chapter 8, this goal was not attained. Despite the problems, the spectrometer was able to measure the fusion rate (see Chapter 6) and the central ion temperature (see Chapter 7). These issues will be discussed in detail.
Parameter Symbol Nominal (Max.) Value Unit
Major Radius Ro 0.67 m
Minor Radius a 0.21 m
Toroidal Field BT 5.3 (9) T
Plasma Current I, 1.2 (3) MA
Auxiliary Heating PICRF 3.5 (8) MW
Line average density < n, > ( 1.1 X 10²¹ M 3
Electron temperature Te < 6 keV
Elongation K 0.95-1.85
Triangularity 6 0.4
Flat-top duration ~ 1 (7) s
Plasma cross-section diverted
Table 1.1: Some of the important parameters of Alcator C-Mod. Nominal values are given with values in parentheses show-ing maximum values (some planned for future operation).
1.4
The Alcator C-Mod Tokamak
1.4.1
Machine Characteristics
Alcatorl C-Mod is a high-magnetic-field high-density compact tokamak, following the same approach taken by the previous tokamaks in the Alcator series at MIT [17]. Table 1.1 lists some of the important parameters of Alcator C-Mod.
A cross section of Alcator C-Mod is shown in Fig. 1.3 depicting the overall struc-ture of the machine. The important feastruc-tures of Alcator C-Mod include its capability to produce highly elongated single or double null diverted plasmas, its large auxiliary ICRF heating capability (ultimately up to 8 MW), and its molybdenum-tiled first wall, to name a few.
a CS a a a a a a a a a in -a a a a a a a a - a <C< a a <C~ a C -~ (Lie a <C <C ~i = - a a a - NJ Li CS ~ a <C -~ a a a - a a K a a Li a a a ~ Li aa a ~ LiLi in ~ LiCSCo a ~ a C" a -~ CS iii ~ Co a ~ a a a 0 < >a<Ca a <C CS C Li a -'a Li a a Li a a a Ct a a a C" a a Li a a a a a Li a a _ a <C Li a a <C a Li a a K aa ( a Li -~ a a a Co a a Li <C Ci Li a -0 NJ" 0 Li <C Co ci a a a'C a Win ~ ain Li -u a -C" a ~ LU C a Co ~ Li a Li ~< Li C a a LiLia a LI <C aa Li Ci a a Li Li a
Figure 1.3: Cross-section of the Alcator C-Mod tokamak.
~\\\'4~\
1.4.2
Description of Related Diagnostics and Systems
Neutron DiagnosticsMeasurement of the global neutron production is performed with an array of detectors [18]: twelve fission chambers (with enriched 235U) of varying sensitivity, four BF3
counters, and four 3He detectors. These are distributed in four moderator-detector stations around the experimental cell of Alcator C-Mod. The fission chambers were selected to cover the entire range of neutron rates from deuterium operation, between 10" and 1016 neutrons per second. There is sufficient overlap between the operating ranges to allow cross calibration between detectors.
HIREX
A five-chord high-resolution x-ray (HIREX) spectrometer [19] provides measurements of the ion temperature profile. The measurement is based on the Doppler broadening of x-ray impurity lines, in this case, lines of hydrogen-like and helium-like argon injected into the machine. The spectrometer array was designed according to the compact von Hamos geometry due to space limitations inherent in the small size of Alcator C-Mod. The spectra are typically collected every 50 ms during a discharge for good counting statistics.
Two-Color Interferometer
A Two-Color Interferometer (TCI) system is used in Alcator C-Mod to measure the electron density with high spatial (-2 cm) and temporal (< 1.0 ins) resolution [20].
The interferometer is in a two pass Michelson configuration. Ten CO2 and four
HeNe channels view the central 20 cm of the plasma through a vertical port. Each channel provides a line-integrated measurement of the electron density. The chordal measurements are inverted using standard matrix inversion techniques to yield the electron density profile. In addition to providing density profile information, the
TCI also supplies a signal to the hybrid control system of Alcator C-Mod for density feedback.
ICRF Heating
Alcator C-Mod utilizes two Radio Frequency (RF) generating units to deliver up to 4 MW of Ion Cyclotron Range of Frequency (ICRF) power through two antennae closely positioned to the plasma edge. In one mode of operation, the launched waves are resonant with the cyclotron motion of minority hydrogen ions (deuterium is the majority species) at the magnetic axis. For the transmitter frequency of 80 MHz, the resonance occurs at 5.3 T, the nominal magnetic field of Alcator C-Mod. In another mode, the minority ions are 3He. The magnetic field on axis will then be at 8 T for heating to take place across the plasma center.
Magnetic and Current Diagnostics
An extensive array of magnetic diagnostics are installed to measure the magnetic fields, magnetic fluxes, plasma current, and coil currents of the tokamak. The EFIT code [21] takes these measurements and reconstructs the equilibria during the dis-charge. The magnetic geometry from EFIT is used directly in the calculation of the detection efficiency of the CFP spectrometer. (See Chapter 5.)
Hard x Ray Monitor
As will be discussed in Chapter 8, the charged fusion product spectrometer located inside the C-Mod vessel is sensitive to hard x rays. A hard x ray monitoring system based on a bismuth germanate (Bi4Ge3Ol2) crystal scintillator is installed on C-Mod at K port. The high Z (=83) of bismuth gives a high photoelectric cross section (high counting efficiency) though the light output is low (low energy resolution) compared to conventional scintillation materials like NaI(Tl).
1.5
Thesis Organization
The thesis is structured as follows.Chapter 2. Preparatory work with CFP detection performed with a
Cockcroft-Walton linear accelerator is summarized. The accelerator acts as a fusion-product source through beam-target fusion.
Chapter 3. An experimental study of the charged particle sensitive depth of
silicon-based detectors is reviewed.
Chapter 4. The design and construction of the CFP spectrometer for Alcator
C-Mod is examined in detail.
Chapter 5. In this chapter, two orbit-following computer codes, EPSILON and
PROMPT, are introduced. EPSILON is a 3-D code for calculating the detec-tion efficiency of the CFP spectrometer. PROMPT is a Monte-Carlo simuladetec-tion code for studying prompt losses of CFPs in C-Mod.
Chapter 6. Measurements of the fusion rate with the CFP spectrometer are
pre-sented and these are compared to measurements made by the neutron diagnos-tic system. Prompt losses of fusion protons as a function of the plasma current is also presented.
Chapter 7. The linewidths of the CFP spectra form the basis of the central ion
temperature measurements made. The theory and the experimental data are discussed here and a comparison is made with the ion temperature measure-ments from other diagnostics.
Chapter 8. The development of the CFP spectrometer as a plasma diagnostic in
Alcator C-Mod has been hampered by count rate related problems. The nature of this problem is identified and explained in this chapter.
Chapter 9. In the concluding chapter, a summary and suggestion of future work can be found.
Chapter 2
Charged Fusion Products from the
Cockcroft-Walton Linear
Accelerator
2.1
Cockcroft-Walton Linear Accelerator
The rebuilding of a 150-kV Cockcroft-Walton linear accelerator, located in a radiation vault area with -3-foot thick concrete walls, has been instrumental in the develop-ment of the charged fusion product (CFP) spectrometer for Alcator C-Mod. The accelerator was manufactured (circa 1962) by Texas Nuclear Corp. [22], but origi-nally as a neutron source. It has been refurbished for use as a well-calibrated source of fusion products - charged particles [23], neutrons [23,24], gamma rays [25] - and Particle-Induced X-Ray Emissions [26].
The major components of the accelerator are shown schematically in Fig. 2.1. The ion source consists of a plasma bottle, radio-frequency (RF) oscillator rings, an extraction anode, a compression solenoid, and a focus electrode. An RF field (about 60 MHz) applied to the oscillator rings causes intense ionization of the source gas (e.g., D or 'He), resulting in a plasma discharge. The magnetic field from the solenoid
PO OMME 8"sr O-IOKv$bEO POWv CAP DNi. LENS TUBE BOTTLEVACUUM PUMP ACCELENRNW ELECn0EtS Ok hIFEhEICE LEVEL
Figure 2.1: Schematic of the Cockcroft-Walton accelerator. Positive ions (e.g., D or 3He) produced in a radio-frequency type ion source are extracted by applying a potential across the ion source bottle. After extraction, the ions are focused
by a gap lens focus electrode before they are accelerated
through a potential of up to 150 kV distributed between
10 electrodes. The ions ultimately hit a water-cooled
tar-get where "beam-tartar-get" fusion products are produced. Voltages shown are relative to ion source base.
compresses the plasma and optimizes molecular break-up and gas ionization [22]. Ions are forced from the bottle by application of a potential of up to +5 kV on the extraction anode. After extraction, some beam focusing is achieved by applying up to -10 kV on a gap lens focus electrode located just downstream from the ion source. The ions leave the gap lens focus electrode and enter the field of the accelerating column where they are accelerated through a potential of 150 kV. The method of pro-ducing this potential in the accelerator was invented by Schenkel and Greinacher and first used by Cockcroft and Walton [27] in 1932 in the construction of their accelerator. In these capacitor-rectifier circuits a transformer feeds alternating current of a smaller voltage into a rectifying and multiplying apparatus, called the cascade generator, and
through the arrangement of capacitors and diodes the voltage is multiplied.
VACUUM SBD
R.A M Z CV
A U M I
B
BREAK -COLLM*TORn VA$m
wATZR D4 ._._a..
WATBt OUT
Figure 2.2: Schematic diagram of the target chamber. The
water-cooled target and the collimator are positively biased to restrain secondary electrons from leaving. The beam cur-rent on target is measured directly. A surface barrier diode at angle 0 is shown operating in vacuum to detect charged fusion products.
tube. The beam size is limited by a 1-cm-diameter stainless-steel collimator that is electrically insulated from the drift tube and located about 15 cm upstream from the target. (The collimator is biased at +300 V above ground to attract secondary electrons potentially created at the collimator edge.) The beam then strikes a solid target which is centrally located inside a target chamber for diagnostic access (see
Fig. 2.2). The beam current on target is measured by a micro-ammeter connected between the target and ground. The water-cooled target is biased at +200 V to attract secondary electrons generated at the target surface and thus avoid misleading current measurement. The target chamber may be separated from the beam line by a gate valve to allow target changes without bringing the entire accelerator to air.
To minimize scattering of the ion beam, a vacuum is maintained in the entire system by a turbomolecular pump. The base pressure is ~0.5-1.0 x 10⁶ torr, and the operating pressure ranges from 5 x 10⁶ to about 5 x 10- torr depending on beam power, target conditions, and the particular diagnostics installed (e.g., vacuum is degraded when we use an ultra-thin-window gas-flow proportional counter to measure
Before
Ma, Ea
a
Figure 2.3: Before and after a binary nuclear reaction in the labora-tory system. The angle 0* < 0 < 1800 is measured with respect to the beam (species a) direction. The system's dynamics are confined to one plane.
low energy x rays).
To achieve fusion [D(D,p)T, D(D,n)3He, D(3He,p)a, T(D,n)a] with the accelera-tor, the target material has to hold the stationary fusing isotope, i.e., deuterium or tritium. This has been made possible by the use of loaded erbium (ErDI.9 2, ErTI.9 2)
targets from Sandia National Laboratory.' The maximum reaction rates, normalized to the beam current, have been RDD - 9 x 10 5/(s MA), RDIHe ~ 3 X 10⁴/(s pA), and
RDT ~ 4 x 10⁷/(s iA).
2.2
Beam Target Reaction Kinematics
To understand some of the results, beam target reaction kinematics have to discussed. Consider a nuclear reaction of the type X(a, b)Y (see Fig. 2.3) where a stationary target particle X is bombarded by particle a, resulting in two products, say, b and Y. 'Courtesy of C. L. Ruiz and R. J. Leeper, Sandia National Laboratory, Albuquerque, New Mexico 87185.
X
My, Ey
b
J
Mb, Eb
A
fte
r
4.0 Di beam~ eergy 150 keV ---- 100 keV ~e3.5 --- 50 keV 2 3.0 2.5 0 30 60 90 120 150 180 0 (deg)
Figure 2.4: Kinematics of the D-D proton reaction illustrating the energy variation for D beam energies of 50 keV, 100 keV,
and 150 keV.
(For bombarding energies below 100 MeV, it is usually the case that two products are generated [28].) In the laboratory system, conservation of energy gives
E. + Q = Eb + Ey (2.1) where Q is the nuclear disintegration energy (i.e. the change in the total rest mass in the system in the sense of mass-energy conservation). Since there are only two products in the reaction, 0 and p have to be coplanar and the dynamics of the system are confined to this two-dimensional plane. Conservation of linear momentum, thus, yields the two equations
/2 M E, = V/2 Mb Eb cos 0 + V/2 My Ey cos y, (2.2)
These three conservation equations can be solved simultaneously (as outlined in Ref. [29]) to give the so-called
Q
equation:Q
= E I + ')- E ' ) - VM. E.Mb E cos 0 (2.4)MY M Y MY
This can be viewed and solved as a quadratic in vT/i. Therefore
/E= V ± V/v2 + w, (2.5) where V= Mb+M cos 0, (2.6) Mb + MY W=My Q + E. (My - M.)(27 As + MY
So given the knowledge of the Q value of the reaction and masses of all the re-actants and products (in fact, only mass ratios are necessary), the fusion product energy observed in the laboratory depends on the beam energy and the angle of
ob-servation, 0, relative to the beam direction (see Fig. 2.2). The energetically possible reactions are those for which VF is real and positive. Considering the fusion reac-tions [Eqs. (1.1)-(1.4)] relevant to the Cockcroft-Walton accelerator, in which M",
Mb, Mx, and My are all of the same order of magnitude, and the limiting 150 kV
accelerator voltage
(Q
>
E, = 150keV), w is always positive. Thus, the minus signin Eq. (2.5) is unphysical and dropped. An illustration of this kinematic effect on the fusion product energy is shown in Fig. 2.4 for D-D protons. For a given accelerator voltage or beam energy, the D-D proton energy is seen to be maximized at 0 = 0' and minimized at 0 = 180'. In addition, this energy "spread" is an increasing function of the beam energy of the accelerator.
2.3
Experimental Results
2.3.1
D-D Reaction
Charged Fusion Product Detection
Our standard charged fusion product diagnostic uses silicon surface-barrier diodes (SBDs) inside vacuum, viewing the target at 0 ~120*. SBDs have intrinsic detection efficiency of 1.0 and energy resolution of
<50
keV for most charged particles, which is sufficient to uniquely differentiate the charged products of the aforementioned fusion reactions.' Thus, SBDs provide an absolute calibration of the fusion rate, given the geometry of the experimental setup.We typically use a partially-depleted SBD (typical thickness -300 pm) the front of which is covered with a 1.5-pm-mylar filter to protect it from the undesirable fluence of backscattered beam particles. The presence of the mylar filter, however, precludes the detection of 0.82-MeV D-D 3He particles, because they lose most of their energy to the mylar, bringing their spectral peak to the low-energy noise level and thus making them indistinguishable. Another limitation of these partially-depleted SBDs is that they cannot measure the full energy of the 14.6 MeV D-3He proton (its range is about 1300 pm in silicon [30]). In order to measure their full energy, a 2000-pm
thick fully-depleted SBD is used.
Charged fusion product emissions at different angles of observation 9 measured with respect to the beam direction have been studied. For instance, Fig. 2.5(a) shows spectra of D-D tritons and protons taken with an SBD in vacuum at 0 ~ 650 and 0 ~ 115*. (For an angle of 0 <; 90', a slanted target has to be used.) The energy of both the proton and triton shifted downward as 6 was increased.
2
Note that the different charged fusion product species cannot be identified positively as the SBD is only sensitive to the energy deposited, regardless of whether the energy is from a proton or a 3He
particle, say. To "identify" the particle species, more information is needed. For instance, one can allow the energetic particles to pass through a thin foil in front of the SBD and study the partial energy loss and the energy straggling as a result. Different particle species with identical energy can also be identified with magnetic and electrostatic separation techniques.
0.5 1.0 1.5
Energy
2.0 2.5 (MeV)
Figure 2.5: (a) D-D triton and proton spectra were collected with an SBD at 0 ~65' (solid spectrum) and 0 ~115' (dotted spectrum). The peaks in the vicinity of 1 MeV and 3 MeV indicate the presence of D-D tritons and protons, respectively. The difference between the two spectra is due to the kinematic effect. (b) D-D charged fusion prod-uct spectrum collected with the same SBD at 0 cz120*. In this single run, both the protons and tritons show dou-ble peaks, indicating the presence of two components in the deuteron beam (D+ with 150 keV and D+ with 75 keV/deuteron, respectively). 4nnl 1a goo 700 U' 0 600 500 400 300 200 100 0.0 3.0 3.5
hA
I L ILi,
--200 P 150 'He T e 100-50 -0 0 1 2 3 4 Energy (MeV)
Figure 2.6: This D-D charged fusion product spectrum shows clearly the presence of the 3He particle described in Eq. (1.2). The Cockcroft-Walton accelerator was run for almost 20 hours with a 26 keV deuteron beam at a beam current of around 12 pA. The SBD, with an aluminum front surface, was located at 0 ~120*.
An example of the kinematic effect of the deuteron energy is seen in Fig. 2.5(b). In this single run, the accelerator voltage was constant at 150 kV and the detection angle was fixed at 9 ~120'. Both the protons and tritons show double peaks, indicating the presence of two components in the deuteron beam (D+ with 150 keV and D+ with 75
keV/deuteron, respectively). By varying the detection angle 9 and/or the accelerator voltage, these kinematic effects, as explained in the previous section, can be taken advantage of in providing a "tunable" source of monoenergetic particles for various purposes, e.g., detector damage studies [31].
The D-D 3He particle has actually been detected with an SBD in the accelerator vacuum with the mylar filter removed. Whereas the absence of the mylar reduces the energy loss of the 3He particles before they hit the SBD, it also necessitates the lowering of the deuteron beam energy (i.e., accelerator voltage) which in turn lowers the energy of the backscattered deuterons such that they do not affect the detection
TP
RE 6= 400 -- FP8=1400
0.0 0.5 1.0 1.5 2.0 2.5 3.0 3.5 4 Energy (MOV)Figure 2.7: 3He proportional-counter fast-neutron spectra were mea-sured at 9 ~ 40' and 0 ~ 140'. An energy calibration was obtained by using the thermal capture peak (at 765 keV) and the lowest edge due to the wall effect (at 191 keV). The "fast peak" (FP) and the recoil edge (RE) are at higher energies for forward angles (see Table 2.1).
of the 3He particle. Fig. 2.6 shows the charged fusion product spectrum accumulated after running the Cockcroft-Walton accelerator with a 26 keV deuteron beam at a beam current of around 12 pA for almost 20 hours. The spectral energies of the peaks agree well with expected values when kinematic effect and the effect of ranging
through the aluminum front surface of the SBD are accounted for.
Fusion Neutron Detection
The relative neutron flux is monitored with a 3He or BF3 thermal-neutron detector
inside a moderating cylinder located a fixed distance from the target. Around the
tar-CL1 00 Ll 104 101 100 .0 r, AG
get chamber the time-integrated fast- and thermal-neutron doses are also monitored with neutron dosimeters. These detectors provide a quantitative comparison of the total number of neutrons produced during different experiments. This is important for radiation damage experiments, where the total dose on a sample is the important parameter.
0 Measured Predicted Measured Predicted
Full Energy Full Energy Recoil Edge Recoil Edge
400 3.57 3.60 1.92 2.13
900 3.23 3.25 1.69 1.87
1400 3.01 2.95 1.58 1.64
Table 2.1: D-D neutron energies in MeV, measured (with a 3He
pro-portional counter; all in MeV) vs. calculated (on the basis of beam/target kinematics and neutron scattering by 3He
nuclei). The measured energies agree to about 10% with the predicted values.
We have used both 3He and 'He proportional counters to measure fast neutron spectra. Fig. 2.7 shows 3He proportional-counter fast-neutron spectra taken at 0 ~40* and 0 z-140*. For incident neutrons with energy Es, each spectrum consists of three primary features [32]: (1) the thermal peak (TP at the capture reaction Q-value, 765 keV) and the corresponding wall-effect contributions; (2) the 3He recoil edge at 75% of E, (RE); and (3) the fast neutron capture peak (FP at
Q
+ E,). Table 2.1 compares the measured fast neutron energies with the values calculated based onkinematics for 0 = 400, 900, and 1400. The measured and calculated neutron energies
agreed to about 10%. Some of the difference can be attributed to neutron scattering in the the experimental facility in general, e.g., vacuum structure of the accelerator, the floor and ceiling of the laboratory, causing an overall lowering of the measured neutron energies.
1000
D-D D- 3He a + D-'He
trito D-D proton proton
C triton-0
500
0 0 5 10 15Energy (MeV)
Figure 2.8: Spectrum of D-3He fusion products. D-D fusion was also taking place because of the presence of small amounts of
deuterium in the 3He ion beam.
2.3.2 D-3He Reaction
By switching the Cockcroft-Walton accelerator gas supply to 3He, a 3He ion beam bombarding a deuterated erbium target gives rise to D-3He reactions. The resulting
charged fusion product spectrum is shown in Fig. 2.8 contrasted with that from D-D reactions. The spectra were taken with an SBD in vacuum at 0 _ 120*. A D-3He
proton peak is clearly seen at 14.2 MeV, as expected given allowance for the kinematic effect and energy loss through the SBD's thin mylar window. However, because of the presence of small amounts of deuterium in the ion source bottle and the relatively higher cross section of the D-D reaction compared with the D-3He reaction, D-D
D-2.5x 10⁴ 2.Ox104 1.5x10⁴ 0 1.0x10⁴ 5.0x13 0 . 1.5 2.0 2.5 3.0 3.5 4.0 4-5 Energy (MeV)
Figure 2.9: D-T a particle spectrum from an SBD placed at 0 = 120* from the deuteron beam direction. Two distinct peaks, one at 3.10 and the other at 3.22 MeV, indicate the pres-ence of two components in the deuteron beam (D+ with
150 keV and D+ with 75 keV/deuteron, respectively).
3
He a particles turned out to be too close to the spectral peak of the D-D protons to be resolved. (Taking into account the kinematic effect and the mylar window, E,,.oon ~ 2.81 MeV and E, 2.91 MeV.) The number of counts under the combined peaks of D-D protons and D-3He a particles is also consistent with this assertion.
2.3.3
D-T Reaction
Because of the radioactive nature of a tritiated erbium target, all D-T runs on the Cockcroft-Walton accelerator were performed using a dedicated target chamber. With a deuteron beam at 150 keV and beam current of 1.2 pA measured at the target, the reaction rate was measured to be 4.77±0.24 x 10' reactions per second [24]. This was deduced through the counting of a particles using an SBD placed at 0 = 1200 (see Fig. 2.9). The superposition of two distinct peaks, one at 3.05 MeV and the other at 3.21 MeV, in the a spectrum indicates again the presence of two components in the
1000 800 600 400 200 0 1 000 800 600 400 200 0
(a) 7 spectrum from Cu activation
(b) y background spectrum
00 450 500 550 600 650
Energy (keV)
Figure 2.10: -y ray spectrum around 0.511 MeV of copper (a) after,
and (b) before (i.e., background) activation by D-T neu-trons. The spectra were taken with a high purity germa-nium detector. The enhanced line at 0.511 MeV results from positron-electron annihilation as 0+ are emitted
when 2Cu decays to "2Ni.
deuteron beam (D+ with 150 keV and D+ with 75 keV/deuteron, respectively). This compares well with the expected 3.10 MeV and 3.23 MeV.
Different diagnostic techniques were used [24] for the detection of the 14.1 MeV neutrons: copper activation, SBDs, and a 3He proportional counter. Here, the results for one of these, copper activation, is included to illustrate the detection of the high energy neutrons. The technique is based on the reaction 'Cu(n,2n)"2Cu which has
a 10.9 MeV threshold, a cross section of 480 mb [33]. A natural copper foil was placed 4.8 cm from the ErTI.92 target where neutrons were generated from deuteron
bombardment. 12Cu decays to "2Ni (half-life of 9.73 min) by 0+ emission and about
U, 0 0 C/) 0 0
39% of the positrons are annihilated in the foil generating characteristic 0.511 MeV y rays. A high purity germanium detector, previously calibrated in efficiency with a 226Ra source, was used to collect the y spectrum in Fig. 2.10(a) from the copper foil. The background y spectrum in Fig. 2.10(b) is included for comparison. As the -y spectrum was collected 155 s after the 3000-s irradiation of the copper foil, the interference of 65Cu(n,2n)66Cu (half-life of 12.7 h) is estimated to be 2.6%. The
measured reaction rate of 4.71 ± 0.73 x 10⁷ per second compares well with that measured with the SBD from a counting.
2.3.4
Other Reactions
The accelerator generates -y rays via low-probability branches of fusion reactions, e.g.,
D + 3He -- y +5 Li, E, = 16.38 MeV; (2.8)
p + "B - y +12 C, E= 15.96 MeV; (2.9)
p + 7 Li - Y +8 Be, E, = 17.25 MeV. (2.10)
These reactions are used as well-calibrated high-energy -- ray sources for characteriz-ing -y-ray diagnostics [25], such as NaI(T) scintillators or a High-Purity Germanium high-resolution spectrometer. As an illustration, Fig. 2.11 shows the -y-ray spectrum taken with a NaI(Tl) scintillator from the 'Li(p,y)8Be reaction.
X rays can be generated in the Cockcroft-Walton accelerator via two mechanisms. Particle-induced x-ray emissions (PIXE) [26], typically with energy <20 keV, result when a solid target is bombarded by an ion beam. The x rays are characteristic line radiation from the target material. We measure PIXE x-ray spectra with a Si(Li) detector for x rays with energy
>1
keV, and thin-window gas-flow proportional0 2 4 6 8 10 12 14 16 18 20
Energy (MeV)
Figure 2.11: The y rays (at 17.3 and 14 MeV) from the 7Li(p,-y)"Be reaction were measured with a 3" x 3" NaI(T) scintilla-tor. A natural lithium target was used, but the 5.6-MeV
6Li (p,7y)Be -y rays were not observed in the NaI(Tl) data
because of the small y-ray branching ratio. (The back-ground lines of 40K and 208T1 are also present at 1.46 MeV and 2.61 MeV respectively.)
counters for x rays with energy <1.5 keV [26]. Secondly, a very much smaller but undesired x-ray flux is generated near the ion source when secondary electrons are accelerated back up to the high voltage section of the accelerator, generating high-energy bremsstrahlung in the process.
t05
104to
C
00
Chapter 3
Experimental Studies of
Charged-Particle Sensitive Depth
in Silicon Detectors
As part of an on-going effort to develop diagnostics for energetic charged particles from laboratory and space experiments, we examined the possibility that particle identification could be expedited by varying the applied bias voltage on silicon-based
charged particle detectors, specifically, silicon surface barrier detectors (SBDs). When the applied bias voltage changes, the thickness of the depletion layer, commonly ac-knowledged to be the active layer for charged particle detection, changes in a pre-dictable fashion. For a given change in the bias voltage, the resulting change in the energy spectrum should be idiosyncratic of the charged particle species, given the knowledge of the species' stopping power and range in silicon.
This chapter begins with a discussion of charged particle interaction with matter. This leads directly into the application of silicon-based diodes for charged particle detection. Using MeV protons and tritons, we performed spectroscopy experiments whereby we observed changes in the energy spectrum as a function of the bias volt-age
[34].
These particles were generated via the Cockcroft-Walton linear acceleratordiscussed in Chapter 2 as fusion products. The results indicate that, contrary to commonly held belief, the detector sensitive depth is not generally the depletion re-gion thickness. Indeed for partially depleted SBDs, the performance is not greatly degraded even for zero bias.
3.1
Charged Particle Interaction with Matter
A charged particle interacts with matter primarily through Coulomb forces between its charge and the negative charges of the orbital electrons of the absorber atoms. This is commonly referred to as electron stopping. However, in the latter part of the particle's trajectory, nuclear stopping, i.e., energy loss to the absorber's nuclei, dominates. Electrons along the track of the charged particle may receive sufficient energy from the charged particle's close encounter to be either excited (raised to a higher lying shell) or ionized. The latter case leaves behind a vacancy, or a hole, in
the lattice of the absorber medium.
The energy loss per unit length, or the stopping power, is described by the Bethe formula
-
E=
47rZ2e4 NZ [ln -v)ln(_ , (3.1)dx M V2 I Z
where e is the electronic charge, m, is the electron rest mass, ze and v are the incident particle's charge and velocity, N and Z are the absorber's number density and atomic number, I is the mean ionization potential of the absorber atoms, and