Application of Multiple Information Sources to Prediction of Engine Time On-wing by
Daniel Richard Roberson
B.S. Physics, University of Portland, 2006
Submitted to the MIT Sloan School of Management and the Department of Aeronautics & Astronautics in Partial Fulfillment of the Requirements for the Degrees of
Master of Business Administration and
Master of Science in Aeronautics & Astronautics
In conjunction with the Leaders for Global Operations Program at the Massachusetts Institute of Technology
June 2015
I
@ 2015 Daniel Richard Roberson. All rights reserved.
The author hereby grants MIT permission to reproduce and to distribute publicly copies of this thesis document in whole or in part in any medium now known o; hereaf1r created.
Signature of Author
Signature redacted
MIT Sloan School of Management Department of Aeronautics & Astronautics
A AMay 8, 2015
Certified by Y.)ly l~UI iv I I=
Dr. Youssef Marzouk, Thesis Supervisor, Associate Professor of Aeronautics and Astronautics Director of Aerospace Computational Design Laboratory
Certified by
Signature redacted
Dr. Karen Willcox, Thesis Supervisor, Professor of Aeronautics and Astronautics
Certified by_
Co-Director of Center for Computational Engineering
Signature redacted_
/
Dr. Roy E. Welsch,Accepted by
Accepted by
Thesis Supervisor, Professor of Statistics and Management Science
___ __Signature
redacted
_ _ _ _Dr. Paulo Lozano, Chair of t4e Graduate Program Committee Associate Pr feysor of Aeronaut s and Astronautics
_________Signature redacted_
r V C Maura Herson,
Director of MBA Program MIT Sloan School of Management
E
LU
(%.J
MWc
Application of Multiple Information Sources to Prediction of Engine Time On-wing
by
Daniel Richard Roberson
Submitted to the MIT Sloan School of Management and the Department of Aeronautics & Astronautics on May 8, 2015 in Partial Fulfillment of the Requirements for the Degrees of Master of
Business Administration and Master of Science in Aeronautics & Astronautics.
Abstract
The maintenance and operation of commercial turbofan engines relies upon an understanding of the factors which contribute to engine degradation from the operational mission, environment and
maintenance procedures. A multiple information source system is developed using the Pratt & Whitney engine to combine predictive engineering simulations with socio-technical effects and environmental factors for an improved predictive system for engine time on-wing. The system establishes an airport severity factor for all operating airports based upon mission parameters and environmental parameters. The final system involves three hierarchical layers: a 1-D engineering simulation; a parametric survival
study; and a logistic regression study. Each of these layers is combined so that the output of the prior becomes the input of the next model. The combined system demonstrates an improvement in current practices at a fleet level from an R2 of 0.526 to 0.7966 and provides an indication of the relationship suspended particulate matter and engine degradation. The potential effects on the airline industry from city based severity in maintenance contracts are explored. Application of multiple information sources requires both knowledge of the system, and access to the data. The organizational structure of a data analytics organization is described; an architecture for integration of this team within an existing corporate environment is proposed.
Thesis Supervisor: Dr. Youssef Marzouk
Associate Professor of Aeronautics and Astronautics Director of Aerospace Computational Design Laboratory Thesis Supervisor: Dr. Karen Willcox
Professor of Aeronautics and Astronautics
Co-Director of Center for Computational Engineering Thesis Supervisor: Dr. Roy E. Welsch
Table of Contents
A b stra ct...
3 List o f F ig u re s ... 6 Glossary of Term s...7 1.0 Introduction ... 9 1.1 Background ... 91.1.1 Applications of M odels Across Industries... 9
1.1.2 Engine Support Policies and Predictive M odels... 9
1.1.3 The Objective - City Level Severity ... 11
1 .2 M e th o d s ... 1 2 1.3 Sum m ary of Chapters...14
2.0 State of the Art...15
2.1 External Literature Review ... 15
2.1.1 System Dynam ics...15
2.1.2 Engine Physics ... 16
2.1.3 M ultiple Inform ation Source Learning M ethods... 18
2.1.4 Organizational Structures for Data Integration... 19
2.2 Internal Case Studies...20
2.2.1 Event Prediction M odels ... 21
2.2.2 TOW Study...23
2.3 Current Interval M ethods ... 25
2.3.1 Physics M odels...25
2.3.2 Table Application and Severity... 26
2.3.3 W eibull m ethods for existing fleets... 28
3.0 M odel Development ... 30
3.1 Overview of approach...30
3.2 System Dynamics M odel...31
3.3 Physics interactions and Data Augm entation Applied ... 33
3.3.1 Shop Visit Data ... 35
3.3.2 NASA Data ... 35
3.3.3 Exhaust Gas Tem perature ... 36
3.3.4 Air Tem perature...36
3.3.5 Data Aggregation...36
3.3.6 Airport Severity Factor...37
3.4 Prim ary Effects and Screening M ethods... 38
3.5 M ulti-m odel M ethod ... 50
3.6 Censoring and Truncation...52
3.7 Individual M odel Perform ance... 53
3.7.1 Second Layer - Parametric Survival ... 54
3.7.2 Third Layer - Logistic Linear Regression ... 55
3.7.3 Total model sensitivity to methods... 59
3.8 Application to Current Business Methods ... 59
4.0 Validation and Implementation ... 61
4 .1 B e n ch m a rks...6 1 4.1.1 External Benchmarks to Competitor Publications ... 61
4.1.2 Comparison to overall Environmental Behavior ... 62
4.2 Organizational Analysis ... 64
4.2.1 Overview of Organizational Effects ... 65
4.2.2 Data Acquisition & Data Maintenance ... 67
4.2.3 Model Development & Deployment ... 69
4.2.4 Recommendations for Governance and Structure ... 71
5 .0 C o n clu sio n s ... 7 5 5.1 Specific Recommendations ... 75
5.1.1 Implications to Contract and Customers... 75
5.1.2 Corollary Information from Current Model ... 75
5.1.3 The Value of Data on Future Engines... 76
5.1.4 Team Structural Alignment ... 77
5.2 General Implications to W orld ... 78
5.2.1 Application of Airport Severity to Airline Industry... 78
5.2.2 Implications of Aerosol Effects and Incentives ... 79
5.2.3 Applications of M ultiple Information Source to Other Industries ... 79
5 .3 Futu re W o rk ... 8 0 5.3.1 Extension of Data To Other Business Problems... 80
5.3.2 Defining New Data Acquisition Targets... 81
A p p e n dix ... 8 2 NASA Satellite Data Acquisition ... 82
Correlation Matrix of Primary Factors ... 84
R e fe re n ce s...8 4
List of Figures
Figure 1: Proposed Multiple Information Source Model for TOW prediction ... 13Figure 2: Gas Turbine W ork Cycle ... 17
Figure 3: OAIS Data Curation Model ... 19
Figure 4: Regional severity adjustment to standard engineering model with 95% Cl of Weibull mean .... 27
Figure 5: Effective B50 life factor of regions within comparable engine models ... 27
Figure 6: System Dynamics view of engine effects during takeoff ... 31
Figure 7: System Dynamic view with primary knowable factors highlighted ... 33
Figure 8: Life Factor distribution of all deterioration caused hot section refurbishments... 37
Figure 9: B50 Life with 95% confidence for each configuration as calculated by three distribution m e th o d s ... 4 0 Figure 10: Achieved interval duration compared to engine age at the start of the interval... 42
Figure 11: Engine Interval vs. engineering model prediction by starting conditions and configuration....43
Figure 12: Relationship between B50 Life Factor achieved and level of maintenance work...43
Figure 13: Loglogistic survival plot of engine life factor by configuration and starting condition before (left) and after (right) adjustment for starting factor based upon loglogistic B50 of each population...44
Figure 14: Test results of engineering first principles models by configuration type...46
Figure 15: Temperature vs Elevation on interval average level... 47
Figure 16: B50 life factor of all engine configurations vs average airport elevation ... 48
Figure 17: Regional effects on interval life factor B50 ... 55
Figure 18:Total model fit to fleet level Weibull derived mean intervals ... 57
Figure 19 : G lo bal Severity M ap ... 59
Figure 20: Comparison of city environmental categorization by General Electric to the current model... 61
Figure 21: Global Temperature Distribution with Airport Temperature/Elevation Severity Overlay[57]..62
Figure 22: Comparison of Global water column and PM2.5 concentrations to combined severity effects ... 6 3 Figure 23: MISR average readings for 2012/2013 A14 and A21 within 30km of selected airports...64
Figure 24: Proposed Model Development Framework with Overlay of the Deming cycle ... 70
Figure 25: Proposed Organizational Structure for Data Analytics ... 72
Figure 26: Data Analytics Supporting Role to Distributed Analytics Teams ... 73
Figure 27: Engine Maintenance Cost Per Enplanement of Studied Cities in the Current Model ... 79
Glossary of Terms
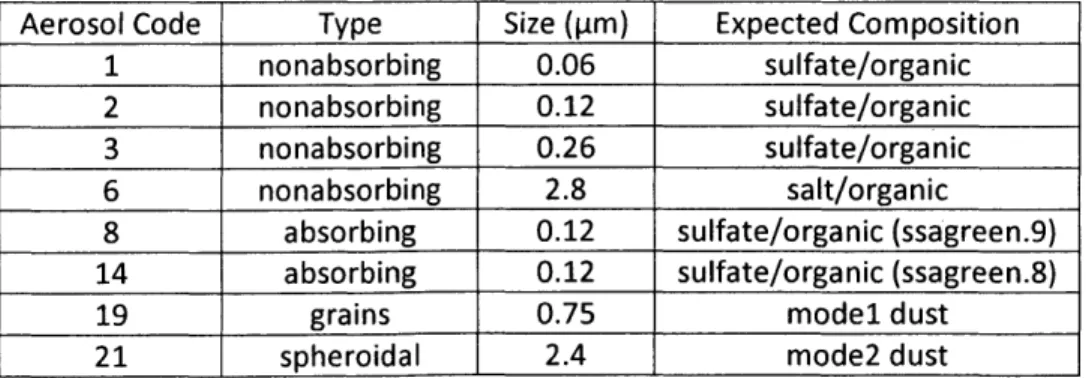
Al, A2, A3, A6, A8, A14, A19, A21 - Aerosol volume column loading parameters defined in Table 2 ACARS - Aircraft Communication Addressing and Reporting System
AIC - Akaike information criterion ASF - Airport Severity Factor
BIC - Bayesian information criterion
Business unit - team within a company division responsible for specific goals CALF - Configuration adjusted life factor
Derate -The setting below maximum available thrust, measured as a percentage where 0 equals max thrust and 100 equals zero thrust
DTamb - Difference between the ambient temperature and the elevation adjusted temperature at International Standard Atmosphere
EGT - Exhaust Gas Temperature EPR - Engine Pressure Ratio
ES - Engine Services, a business unit within P&W aftermarket division FHA - Flight Hour Agreement
GE - General Electric Corporation GW - Gross Weight at takeoff
HPT Grids - Data set provided by Hot Section Engineering (HSE) that describes the relationship between expected Time on Wing (TOW) of the High Pressure Turbine (HPT) and operational parameters of the mission point
HSE - Hot Section Engineering, a business unit within the P&W Engineering division IAT - Interval Analysis Tool
IAE - International Aero Engines
Interval - Time between hot section refurbishments (HSR) measured in either flight hours or flight cycles ISA - International Standard Atmosphere
IT - Information Technology, in reference to an organization within a company JMP - A statistical software from SAS Corporation
LF - Life Factor
LLP - Life limited part, parts that require replacement after fixed cycles or hours regardless of condition MISR - Multi-angle Imaging SpectroRadiometer
Mission point - a characteristic mission of an engine described by all pertinent characteristics of a flight route between two typical airports
MODIS - Moderate-Resolution Imaging Spectroradiometer MRO - Maintenance and Repair Organization
MSE - Mean square error OAG - Official Airline Guide
OEM - Original Equipment Manufacturer
P&L - A segment of a company measured against for profit and loss metrics for all activities PM - Particle Mass, measured in column loading at or above a specified particle size P&W - Pratt & Whitney, a UTC company
RH - Relative humidity
Severity - A factor describing the difference between expected life and actual life as a function of unknown parameters. Larger numbers correspond to longer life.
SPSS - Statistical Package for the Social Science, a software system from IBM Corporation SQL - Structured query language
TOW - Time on wing, typically measured in flight hours TR - Thrust Reverser
1.0 Introduction
As the growth of data systems has made Big Data a buzz word in industry, organizations struggle to develop methods capable of managing large data systems and harvesting financial value from them. Two problems are specifically addressed in this work: the problem of properly maintaining and propagating big data through a company, and the problem of developing successful models for multi-factored socio-technical scenarios. The description of state of the art model applications within the aerospace and insurance industry provides context for the current work. The specific area of research is the advancement of engine time on wing (TOW) prediction, subject to variability from basic engine physics, maintenance and inspection policy, and airport specific environmental effects. This chapter introduces the current state and objectives of engine TOW prediction at Pratt & Whitney, and outlines the methods by which a new model is proposed.
1.1 Background
1.1.1 Applications of Models Across Industries
Analytical models throughout multiple industries demonstrate similarities in the way they merge diverse data sources to generate complex structure simulations. Both the aerospace maintenance and health insurance industries insure the risk of expensive rare events and take advantage of similar cost modeling methods. Health insurance decision models have been developed using Monte Carlo simulation[1], Markov Chain analysis[2], data clustering[3], spatial geographic[4], mixed financial steady state models' and neural networks[5]. The varied application of data modeling tools indicates that these industries hold sufficient data to answer questions in several ways.
Often the model selection and the type of question being asked of the data are decided together. Many of these models in healthcare take advantage of mixed data sources and mixed model methods when questions require it. For example, a first order model found in health care is the Proportional Disease Magnitude (PDM), which is an intermediate factor that represents the financial cost of a disease in the place of actual costs. This PDM is first developed for an area of interest, and then used as a factor in simulations[6],[7]. The abstraction of this information provides greater information for portfolio level risk analysis than the unadjusted cost data would have done since the underlying factors of cost can be separated from the noise incurred by billing errors.
1.1.2 Engine Support Policies and Predictive Models
Airplane engine maintenance represents 41% of the cost of ongoing maintenance for worldwide passenger airline operators [8]. For both airlines and engine manufacturers, the decisions regarding
maintenance costs management are a critical aspect of the original purchase decision. Engine maintenance contracts are awarded competitively by the airplane owner to one of three options: Independent Maintenance Repair & Overhaul (MRO) companies, Airline Operated MRO's, and the engine's primary original equipment manufacturer (OEM). From the airline operators' perspective, these contracts serve to mitigate risk by either setting repair rates or directly covering certain repairs. Since 1962, with Rolls Royce's Power By-the-HourTM plans, many operators pay fixed amounts per flight hour to the OEM for the privilege of zero cost, or decreased cost shop visits[9]. Referred to as Flight Hour Agreements (FHA), these fixed rate contracts are billed either monthly or at shop visit. The coverage of such plans is typically limited to a fleet cumulative term, per engine term, or a fixed number of shop visits. Implications of each of these combinations of billing and coverage methods complicate the pricing decisions for both the operator and the OEM. The actual cost of operating the fleet is subject to a high degree of uncertainty with high costs incurred infrequently. The worldwide average maintenance expense in 2011 was just over $200 per flight hour, and engines perform on the order of 10,000 flight hours across a time horizon of several years before overhaul costs are first incurred[8]. The industry standard method of modeling this time on-wing risk is to use Weibull distribution analysis based upon existing data, or engineering prediction[10]. Simulation and risk based customer pricing are developed by considering a number of factors including operating thrust, environmental conditions, flight length, and engine configuration[11]. Accurate understanding of the expected time on-wing (TOW) under a set of operating conditions is central to developing a cost structure for FHAs. Understanding the expected distribution profile for TOW enables accurate simulation of the differences between term limited plans and shop visit based plans and optimization of fleet management strategies.
The day to day operating conditions of an engine are collectively referred to as the mission. Mission parameters include such values as the thrust, hours per cycle, and local operating conditions. In addition to mission parameters, other engine lifelong or fleet level factors affect TOW including maintenance policy, thrust reverser usage, fuel quality, and others. While FHA pricing takes into consideration all of these factors, it is difficult to accurately predict the expected life of a new engine program across all possible missions. First principles simulation of the engine gas path is performed by the engineering team for a variety of inputs and design modifications are tested against prior versions to mitigate against key failure modes identified in TOW predictions. Taking into consideration all possible combinations of local operating conditions increases simulation cost and any complete model of all
interactions would require re-certification on each engine program. As a result, the industry commonly takes advantage of TOW adjustment tables that are treated as independent or sometimes covariate
effects. To generate a predicted TOW, the baseline prediction from engineering design is obtained and multiplied by a set of severity factors from these tables. A severity factor of 1.0 is used as the base point for calibration of the first principles models and the real world experiences on prior engines. By
convention high severity indicates proportionally poor performance. For example, thrust derate is measured as the percent below maximum rated thrust. It is selected by the pilot at takeoff. Raising thrust from a derate of 10% to a derate of 0% may change the severity factor from 1.0 to 1.1 yielding a 10% shorter expected TOW[11]. These tables are developed by the manufacturer and provided to prospective airlines when planning their mission profiles and maintenance costs. Many mission parameters are directly related to one another as will be described. In these cases, a table or set of tables showing the interacting terms is constructed, while for independent effects a collection of tables can be applied sequentially. The use of severity factors as a process for predicting engine TOW enables the manufacturer to solve some problems independently and enables the transfer of information forward to future models.
1.1.3 The Objective -City Level Severity
Geographic dispersion of the airline industry is itself a recent trend. In 1995 the regions of North America, Europe, Pacific Islands or Seaboard garnered 84% of all passenger traffic. Dusty regions, such as North Africa, the Middle East, South Central Asia and inland China did not reach 10% of global traffic until the year 2001. Between 2005 and 2010 the air demand in these latter regions doubled to a half billion passengers per year [12]. Several years later, the first engines began returning for repairs in high enough numbers for statistical analysis. The impacts of dusty environments on fleet level TOW had therefore not been widely studied until 2010. Recent work by multiple manufacturers focuses on the development of new severity factors to account for regional effects. The relationships between particle type and size and the associated engine degradation modes are being explored. As a result of these studies, one manufacturer has stated that the "TOW ... is a function of percent of routes in harsh environments" [13].
The severity factor of an airport environment could be estimated by first principles simulation through a full characterization of the types of particles in the operating space. This analysis could culminate in proper understanding of the material science and generate useful results for the development of new engines and simulation of existing fleet performance. The results would not be readily absorbed by the industry or fleet operator and would be expensive to generate and to run. By contrast, the development
of a severity factor that accounts for the operational environment by regression to globally available values could be easily adopted by the manufacturer and the operator for fleet planning.
It is the objective of this study to generate an airport severity factor (ASF) for use in calculating a fleet level severity factor. By combining ASF with other effects of the mission including flight length, it will then be possible to produce city pair level estimates. City pair estimates are the target of the industry according to Jim Pennito, "We're trying to understand whether a certain city pair is more abusive to the engines than another city pair[14]." To be applicable in sequence with the existing set of severity factors, the properties of the ASF must exhibit substantial independence from existing severity factors
and engine lifetime predictors. The correlation between the driving factors of the ASF and existing severity factor variables will be explored.
1.2 Methods
The application of multiple information sources method is capable of providing near term benefit that cannot be achieved by complete single method models in the context of an actively used organizational process. Multiple information source methods take advantage of a variety of analytical modeling and decision making processes in a hierarchical order[15],[16],[17]. The objective of these methods is to abstract key information about the behavior of a complex system which will tend not to behave in closed form manner. Multiple information source systems mimic the way people and organizations make decisions. Certain stages of the decision process involve parameters that are excluded from other stages. Such decision making systems can be applied to any existing model structure to improve
information captured by the organization in an incremental way by building upon current processes and data.
The development of a multiple information source system requires a full understanding of the data pertinent to the decision or set of decisions which is to be made. The context of the decision and
maintenance of the system are critical aspects of organizational intelligence that contribute to the value, flexibility, and relatability of the final product. The target variable of interest to this study is engine time on-wing (TOW). The decision being made is a service contract pricing decision. This study starts with a system dynamics approach to capture the behavior of both the pricing decision and the engine TOW. Physics effects that require special treatment are identified. These effects inform the selection of cross terms applied at individual layers of the model and the development of derived variables for model augmentation. Collinear terms are considered prior to model development to prevent improper training of the model. The data sources are identified using the system dynamics model along with the level of
data validation and re-formatting. Reformatting improves the value for particular applications and may lead to information loss in others. Finally, data aggregation is performed to improve response specificity and correct for sampling biases incurred by missing data. The treatment of the data depends upon the question being asked. Figure 1 shows the proposed system of a three layer model which isolates predictable physics effects from engine removal conditions and airport severity.
Figure 1: Proposed Multiple Information Source Model for TOW prediction
This study applies system dynamics modeling as a first step toward defining interaction terms for use. This system dynamics model also informs the process in model development of obtaining data in cases where not all factors can be obtained easily. Next the known interactions of operating parameters within the engine are obtained. Physics is used in three ways to analyze the problem structure before
performing data gathering and effect screening: 1) units and distribution effects, 2) isolation of factors, 3) data augmentation by new variables.
The two primary data sources of the model are Aircraft Communication Addressing and Reporting System (ACARS) and NASA MISR. A data rationalization policy is established for each variable that
converts the variable into proper unit basis as determined by the physics analysis, and null records are either filled with reasonable estimates or left blank.
Aggregation of data prior to or concurrent with modeling is performed at several layers. Aggregation of rows in datasets improves the model specificity and can be used to improve signal-to-noise, both of which improve model training accuracy. In each aggregation layer two important factors are considered: Sampling effects of aggregation basis; Information loss on non-linear effects.
Four software suites are used to develop and deploy the final solution: SAS JMP 11.0, Matlab 2014a, Teradata 14; SPSS Modeler 16; and Microsoft Excel 2010. These software systems are used for data pre-processing, enterprise data integration, model development and model execution respectively. The software decision was made based upon tool capability, organizational availability and existing organizational familiarity.
1.3 Sunmnary of Chapters
The objective of this study is to develop and deploy an improved method of handling airport level differences in engine performance in such a way that the effect on TOW can be more accurately
predicted. The proceeding chapters lay out the work performed in this study to develop the particular solution above. The second chapter reviews the state of the art in multi-model integration. The
literature review gives attention to both the technical aspects of model development across the variety of fields involved in this particular problem and the management aspects of data maintenance - a key aspect of model value proposition. A series of case studies provided explore the causes of success or failure for recent models deployed at Pratt & Whitney giving special attention to the three criteria for a successful model: value, flexibility, and relatability.
Chapter three details the work performed in establishing the entire solution. A study of the system dynamics involved informs the selection of initial factors for the decision structure. Next we calculate the physics interactions of higher order effects predicted by the system dynamics model. An explanation of the proficiency and predictive nature of a variety of modeling methods validates the selection of the models used in the final system. Finally the results of each layer of the final system are displayed and the sensitivity of these models to underlying data assumptions and methods is examined.
Chapter four performs validation of the final airport severity factors against internal benchmarks to Pratt & Whitney through comparison with existing data models for regional severity and by examining the sensitivity of the factors to variance in source parameters. The organization supporting and
implementing this system requires analysis to ensure proper deployment is sustainable and that value, flexibility, and relatability are communicated to the company.
Chapter five reviews the impact that the airport severity factors will have upon the existing organization, both internally to Pratt & Whitney and to its customers. The relatability of the ASFs makes possible the expansion of them into future market contracts across the industry and the potential effects of this shift are discussed. Chapter five also covers the logical extensions of this work both in the near term range for other applications of multiple information source methods and for evaluation of new IT and data management policies.
2.0 State of the Art
Extensive literature on the topic of engine physics and large data systems provides a background for the current research. The combination of four areas of literature is integral to establishing a functional model that is sufficiently complex to handle the effects present in the lifetime of an engine. Not only does this system of models require an understanding of engine physics and data modeling approaches, but the organizational methods of a company require careful examination to ensure support exists for the data system. This chapter reviews the research in system dynamics, engine physics, multiple information source systems, and organizational structures for the support of such systems. Two case studies from Pratt & Whitney are discussed which highlight shortcomings of two data models and suggest how these models could have been improved by management changes during their development and deployment. Finally, the current state of TOW modeling is described within the context of the P&W data systems.
2.1 External Literature Review 2.1.1 System Dynamics
System dynamics in its core describes a method of capturing interactions present in a complex system with or without given mathematical relationships. System dynamic modeling in reliability engineering tends to be done in two high level categories: Markovian decomposition, and multi-parameter feedback analysis. Markovian decomposition of the system enables a variety of modeling methods for both error classification techniques [18], [19] and system level reliability [20], [21]. In each of these cited examples, the system dynamics diagram informs the hierarchy of the ensuring model by capturing the expected behavior and interactions prior to mathematical screening. Chung et al develop a comprehensive
dynamics model of module-to-module interactions within turbofan gas paths which enables the construction of a complex system level model using simple linear interactions between each pair of nodes[22]. System dynamics is applied to analytical methods outside aerospace to effectively model socio-technical characteristics alongside empirical mathematical methods, most recently in the
healthcare and insurance industry [23], [5]. One example of hybrid modeling including regulatory policy evaluation and stochastic mathematic modeling of flood risk developed for European drainage
simulations relies upon system dynamics to organize influential factors [24].
2.12 Engine Physics
Estimation of internal engine temperatures and pressures is a central aspect of the design phase for both production and market placement. The basic methods and trade-offs are published by both
manufacturers and independent parties [25], [26], [27], [28], [29]. While OEMs use proprietary modeling methods for design and evaluation, academic versions of models such as Hermes and Turbomatch developed at Cranfield University for airframe and engine performance modeling respectively provide sensitivity analysis of engine durability to standard factors. Modeling of the internal temperatures and pressures requires assumed values for external atmospheric values throughout the flight, and a full thermodynamic model of the engine in question. The majority of modern methods approved within industry for performing the gas path simulation involve recursive linear quadratic estimation known as a Kalman filter[30],[31], [32]. This method, based on an underlying Bayesian inference structure with Gaussian assumptions, is capable of developing a stable solution to internal temperatures and pressures given limited known constraints and physics with significant noise. Innovative methods have been presented to more closely simulate engine health performance using non-linear and non-Gaussian methods with Monte Carlo sampling methods to constrain solutions on an extended non-linear Kalman filter with non-Gaussian inputs[33]. This work has shown a high degree of sensitivity to methods of sampling. While these methods may eventually be adopted for future systems, the commonly deployed models in industry remain linear and Gaussian in nature.
Sensitivity analysis between these mission parameters and engine life expectancy is based upon simulation of low cycle metal fatigue, material oxidization, and high cycle creep through time at temperature estimations. Hanumanthan provides a thorough review of the methods for combining damage estimators to predict engine failure [34]. The results of these models enable declarable trade-offs specific to the engine model such as "A takeoff derate that averages 5% will add 400-500 [engine flight cycles] to on-wing life, a 10% derate will add 800-900, and a 15% derate will add about 1100[35]."
The basic physics of engine propulsion begins with the equation of net thrust:
Equation 1 F = 9 Vi - Va) + A1(P; - Pam)
where Wa is the air mass flowrate, g acceleration of gravity, V the exhaust average velocity after mixing in the exhaust cone, Va the incoming air velocity on the axis of motion, A1 the aera of the nozzle, P the static pressure at the discharge and Pam the static pressure of ambient air[28]. In the above formulation, momentum of spent fuel (Wf) is disregarded. From this formula and basic atmospheric relationships, the impact of temperature, pressure, and wind speed on the gross thrust are readily established. Turbines follow a Brayton cycle, shown in Figure 2, capturing energy on the expansion path to power the compressor, the aircraft electronics and the thrust.
Figure 2: Gas Turbine Work Cycle
Gas Turbine Work Cycle
Combustor 2 3 Turbine a) 4 Compressor NozzleInlet Ambient Air
Volume
Since fixed nozzle designs are commonly used for high by-pass systems used on standard commercial aircraft applications, the expansion curve does not change to adjust for flight conditions. Until the introduction of the Pratt & Whitney Geared Turbo Fan, the relationship between compressor and expansion curves was fixed by the common spindle[36]. With fixed engine geometry, any change in thrust caused by atmospheric properties may only be countered by increasing combustor fuel flow and consequently internal gas path temperatures. With atmospheric values as constants, the engine thrust can be rewritten as F = Catm + Aj * EPR where Catm collects terms fixed by geometry, airspeed and
ambient pressure and EPR is the engine pressure ratio defined as the pressure at the nozzle divided by the pressure at the compressor: point 4 over point 2 in Figure 2. This formulation of Equation 1 informs a number of severity assessments in that the EPR, thrust and fuel flow are shown to be linearly related at any given operational point.
Atmospheric and mission parameters are highly covariate both through standard atmospheric equations and through operational constraints. For example, Mishra and Beura demonstrated that the relationship between runway length for maximum load aircraft and thrust requires linearly higher thrust for shorter runways and explored the effect of this and other factors on the engine life consumption[37].
2.1.3 Multiple Information Source Learning Methods
Multiple layer models have been developed to perform remaining life estimates on engines where single performance parameters such as Exhaust Gas Temperature may be used as suitable evaluations of health[18]. The method developed by Ramasso and Gouriveau first performs a prediction of the failure mode which will occur using an evolving neuro-fuzzy system, next the engine is classified into a time-risk based mode using a parametric Markovian classifier. The model performs automatic clustering enabling the second layer to build time series categories without prior knowledge except a basic belief
assignment which establishes the underlying expected variance leading to a failure. While the later aspect of this approach is studied independently [19], the combined model improves both the accuracy and flexibility of the system.
The Climate Risk Insurance Model (CRIM) represents an advanced use of multiple information source modeling[4]. The CRIM could not be developed using a single equation or modeling method and
requires the use of nested model layers. In each layer, the modeling method is selected based upon the information type. Climate Change scenarios provide inputs to a region specific flood probability in
Netherlands dikes. These models are combined with land use scenarios based upon socio-economic development models to generate a damage function per geography, flood depth, and time. While economic development scenarios may be modeled with regression techniques, the risk models of the combined data are suited to Monte Carlo simulation. The model performs simulation on the combined cost model for 100 years of future climate and development inputs. The output probabilities are converted to a risk premium against a number of insurance policy structures to evaluate both the insurance pricing and insurance liabilities. Finally, these results generate price sensitivities for the
2.1.4 Organizational Structures for Data Integration
Data storage and curation decisions impact the owning company's ability to make productive use of the
data for decades after the decisions are made. Decisions about data management fall into three main categories: Storage medium, Database architecture, Data curation[38]. Storage medium describes the physical storage location and includes decisions about physical security, backup reliability, geographic emergency preparedness, and power systems. Database architecture refers to the software deployed on the storage medium. These decisions involve trade-offs between storage volume, speed and
accessibility. The database architecture decision cannot be made without an understanding of the nature of the data to be stored. After establishing these two underpinnings of infrastructure, data curation refers to all activities of data management from acquisition to delivery including verification of usability, applicability and advertising of the data[39].
While many models exist for data management, there is only one Internationally approved standard which provides a strong baseline for discussion: the Open Archival Information System (OAIS)[40] [41]. The OAIS, shown in Figure 3, describes data curation in six areas. Main data flows are connected by solid arrows with the data format of the transfer being called out in the nearby ovals. Functional oversight is connected by dashed lines. Descriptive Info refers to the metadata and schema definitions required to define the data contents and storage types. SIP, AIP and DIP refer to Submission, Archival, and
Dissemination Information Packages respectively and have defined standards for metadata included in each package. Ingest describes those processes controlling the collection of new data into the data system. Following Ingest, data rationalization and storage to the servers is governed by the Archival Storage function. In parallel Data Management functions perform documentation and integration of the data to the overall system architecture. The final inflow function of Access works with consumers to identify the existence, description, location, and availability of data. Over the daily processing of data the Preservation Planning function maintains hardware and software general operations, working with consumers and producers to develop and maintain availability requirements and update plans. Finally, the Administrative function provides integration of all areas of the archive system and is responsible for those decisions affecting multiple functions.
Data Integration within a corporate environment is challenged to provide both large data storage and simultaneously well exposed data. Challenges are posed by mixed data formats between both digital data and traditional document based analogue data such as receipts or maintenance notes. Activity based pricing has shown that Preservation Planning, Administration, and Archive Storage are the most expensive activities of a data system[42, p. -]. This cost centering generates risk of a myopic view of data curation. Studies performed on the World Data System proposed the value of a formally defined
pre-ingest function and the development of mirrored processes for dealing with analogue and digital data in a holistic manner through the Data Management function[43]. A survey performed on 26 members of the WDS established a scoring method to determine the effectiveness of each function. This survey revealed that Ingest and Data Management are generally the strongest parts of a data system with results by group shown in Table 1. Access is the weakest on average with a number of very low scoring systems.
Table 1: Survey Scores for WDS functions, adapted from [44]
Ingest Archive Data Admin Preserve Access
Average Score 76% 66% 79% 65% 63% 54%
1 Sigma Range 53%-98% 49%-85% 61%-95% 48%-81% 40%-86% 27%-81%
2.2 Internal Case Studies
We propose that effective models in a business context require three principal components: value, flexibility, and relatability. Value refers collectively to the strength of the model, the validity of the business need it fills and the cost of running it. Flexibility encompasses the range of unpredictable inputs
Preservation Planning
C
R Informadon Data ieritnaesn N
0 I, Managernen que"es
D i u ?ry responses
D Ingest I Access orders U
USIP M
C Archival
E Storage I AIP DIP E
Administration
the model must allow for while assisting in the business process. Relatability requires that the customers and operators of the model have a proper understanding of how the system works, which enables them to make full use of the information provided. This section presents two unique cases observed in which a model or system of models fell short of attaining one of these three elements. The following cases do not represent failed projects. They provided value and contributed to company success. Rather they represent projects which fell short of their potential. Each case study concludes with recommendations for ongoing improvement.
2.2.1 Event Prediction Models
2.2.1.1 Objective Description
Teams of engineers review performance data of engines daily through a proprietary on-wing and off-wing data management system, monitoring fleets for any indication of reliability concerns and
responding quickly to operational events. Engine deterioration drives scheduling of inspections and engine overhauls with the majority of engines never having any events in their on-wing lifetimes. In this setting, the company pursued the development of a predictive model that could identify even minor events before they occur.
2.2.1.2 Model Development
The development team reviewed the current process for event detection and developed a list of potentially interesting sources of data. Over several weeks a variety of data was acquired from multiple information sources and rationalized together. It was observed that process monitoring relied upon trends in the engine performance metrics. Data augmentation was performed on all continuous variables to provide trend information to the statistical models. These trend values included measures such as average, slope, deviation, and any shift in these over time. The time period of consideration
ranged from prior flight to three years of flights with a number of binning selections in-between.
A variety of model prediction methods and compounded methods were attempted. Data boosting applied for all records related to an event increased the model sensitivity. Data boosting refers to the
replication of rare data points to improve the sensitivity of a classification algorithm. Boosting is subject to extreme limitation when data accuracy is in question, and therefore its use was limited to well-known events[45]. The limited number of events on which to train the model required the team to consider
were attempted to predict probability of failure within a future time period. Alternate approaches used linear, logistic and generalized linear regression to predict days until an event would occur.
Due to the structure of the source data, with very few events available to predict, model specificity or true negative rate was above 0.95 in all testing datasets. As a business objective the model was trained to have a high recall rate, which is the fraction of actual events that are correctly identified as events in a classification model. This value could be controlled to a range of 0.5 to 0.8 in all testing datasets.
2.2.1.3 Model Outcome
The model implementation is ongoing at the time of this thesis. The engines identified as high risk for an event are output by the model with a list of decisions from the tree based model that drove the high propensity rating. This list is reviewed by the engineering and fleet management teams internally before decisions to intervene. This review procedure presents a major transition from reactionary root cause investigation into pro-active maintenance planning. A process for continuous updates is in place that provides new data sources to the model from ongoing event detection in the field.
The false discovery rate on testing data ranging from 0.4 to 0.8 indicates that for every event
successfully averted between 1 and 4 investigations were of no direct value. When translated to specific engines, the actual risk can be evaluated by human investigators after relatively minor expended effort. Current estimates for this labor are one full time equivalent (FTE) employee per year for false
discoveries, and one FTE for discoveries which result in contacting the operator. Two of the three event prediction models that were funded were discontinued after completion due to poor recall rates on testing data.
2.2.1.4 Failure Analysis
Although the models provided value, they failed to hold up to their promised value. It was possible to foresee, and in some aspects prevent, this problem through better definition of the business value throughout the model development.
Improved data in the form of derived engine health indicators is actively maintained by the company. These data were available at any time throughout the development of the model and were among the sources used for its development, though some data was overlooked due to the difficulty of engaging all parts of teams of the company simultaneously.
During a critical check point on the process funding and model planning, decisions were informed by the use of the model accuracy. As defined, the accuracy of a classification algorithm is equal to true positives plus true negatives divided by total observations. Unfortunately, in rare event detection systems
accuracy is not representative of total model performance. For example if only one in one hundred cases is an event, then a pure guessing algorithm that predicts one event incorrectly would have 0 correct events, 98 correct non-events, and 2 incorrect predictions with a total accuracy of 98%. Accuracy was used as a decision making value by default since the business value associated with the false
positives and false negatives had not yet been determined. Without that understanding, the balance between precision and sensitivity could not be outlined as a requirement. Better measures of performance before establishing this business value are Informedness and Markedness[46]. Informedness is the true positives divided by total positives, plus true negatives divided by total negatives, minus one. Markedness is the true positives or all positive predictions, plus true negatives over all negative predictions, minus one. While recall in these models had been tuned to 80%, Informedness and Markedness of the original models ranged from 10% to 15%. When this was observed, two of the three models were suspended.
2.2.1.5 Recommendations
Value definition throughout the model development would have reduced costs and improved the outcome of this project. The development of a Data Analytics organization with central responsibility for advertising of data and collection of methods within the company will improve future model
performance. An improved integration between engineering staff and data analysis teams would have enabled this type of work to succeed. "You can't do just data mining, it won't make [you] smarter about future situations[47]."
2.2.2 TOW Study
2.2.2.1 Objective Description
The company pursued a Bayes Net regression model for identifying the primary drivers for engine time on-wing (TOW). Bayes Net models enable hierarchical regression where certain factors are given primacy as priors due to system knowledge. The study focused on a fleet of several hundred engines with a mature lifecycle. The objective of the study was to inform future work on TOW studies and expand the knowledge acquired from one mature fleet into a future engine program.
2.2.2.2 Model Development
The development team met on a recurring basis with both engineering and fleet support staff to ensure that all possible data sources were considered and every element of business value from the models
was well understood. A large investment was made early in the project in data source identification and rationalization. The team then developed an algorithm capable of forecasting forward the degradation rate of an engine using a Bayes Net. The model derived a prediction variable of the rate of degradation for a key engine health metric. The point at which this metric crossed zero was identified as the expected end of TOW. The model demonstrated an improvement over existing linear models for that engine in two demonstrated test sub-fleets. Existing linear models over-predicted the TOW by as much as 40% and it was for this reason that fleet level linear methods were not in use by the company. The new method of slope prediction corrected for this error and the coefficient of variation from the existing model reduced from 36.8% to 34.5% in one case and 29.5% to 26.2% in the second.
2.2.2.3 Model Outcome
The model was not adopted because the organization could not identify a way to use the model given existing data and processes. Factors known and proven by engineering teams to affect engine health had not appeared as primary variables in the final model. The isolation of variables to those readily measured by the business has not been performed. The airport level severity factors were not applicable to any engines except those on which the model had been trained. As a result, the model relied heavily on the prior knowledge about a fleet performance and lessons from an existing fleet could in no way be translated to a new engine design. The TOW study failed to deliver the necessary flexibility needed to bring value to the business.
2.2.2.4 Failure Analysis
Model flexibility in this instance required that the model isolate the new effects from the existing effects proven by first principles physics. Only in doing this could the model be validated, applied to current predictions, and abstracted to future fleets.
First principles models from Pratt & Whitney hot section durability engineering accurately predict degradation of key engine components as caused by factors such as thrust, flight length and air temperatures. While the basis of the TOW study was to identify new factors, the inclusion of proven first principles should not have been overlooked. If any mission parameter is found to be insignificant in a model it should not be due to omission, but rather due to the identification of a new effect of opposite weight to the physics proven effect. This form of model architecture makes room for the inclusion of
new physics to play the role of assumed priors, and builds upon the existing data structure natural to the organization. It is possible that a correlated effect related to airport geometry completely counters the effects of physics on engine damage in some regard. For this new knowledge to provide value to the organization it must be documented with respect to the current baseline so that contracts and pricing changes may be made using a new environmental adjustment. Without this information, the models do not allow for incremental learning and therefore cannot be implemented into an existing business process.
2.2.2.5 Recommendations
Future studies performed must account for known physics factors as forced effects. In this way learning will be made complementary to the existing body of knowledge and not confused with it. Any
parameter that is currently a part of the established business process should be regarded as included in the null hypothesis. By construction of a model in this way, the future use of the model leaves room for improved physical understanding of the source data, while providing a clear method for incremental improvement in data acquisition.
2.3 Current Interval Methods
In the current process, TOW estimations are supplemented by active engine health monitoring that continuously reviews the fleet status and identifies risks for early maintenance. This section focuses on the initial prediction made at the point of sale, and fleet level periodic assessments made on existing fleets prior to the renewal of maintenance contracts. The initial estimate uses a combination of
engineering and regression models to predict TOW for new engine business (NEB). These models demonstrate reasonable accuracy at a fleet level. To adjust for fleet unique operating conditions that are not fully captured by predictive models, mature fleets with sufficient data are individually fit to a Weibull distribution to supersede the initial prediction. This section explains the current processes in greater detail from the source of the engineering model through to application in both NEB and mature
fleets.
2.3.1 Physics Models
For each new engine program, hot section engineering (HSE) performs life prediction analysis using first principles of physics. HSE builds finite element analysis models similar to those described in section 2.1.2. The model uses a set of key variables that define engine operating conditions as inputs: ambient air temperature, flight length, cruise altitude, thrust, airframe, takeoff derate, and climb schedule. Each combination of these variables is referred to as a 'mission point'. The model output for each mission
point is a predicted q, and
1
of a Weibull distribution corresponding to mean failure for the module being analyzed. From a combination of these models for different sections and mission points a lookup table is generated for predicting TOW for an engine model. Throughout the lifecycle of an engine, HSE will continue to monitor and update these lookup tables by adding further physics based failure modes to the source models.HSE classifies the effect of ambient air temperature independently from the rest of the mission point factors. Air temperature has a slight effect on the inside air temperature of the engine. Commercial jet engines are flat rated to perform equally under a wide range of air temperatures, up to a cut-off point. This means that the engine is capable of higher thrust than is provided in order to compensate
automatically for high temperatures, which decrease effective thrust. Above the flat rated point, the engine effective max thrust decreases, thereby reducing the climb speed and extending the time the engine spends performing max thrust climb. The effect that ambient temperature has on elevating
internal metal temperatures is relatively low. However, the effect on climb time extension is specific and predictable. Longer climb at max thrust is equivalent to running the same mission point simply for a longer period each flight. For these reasons, temperature effects are handled independently of the rest of the models and a temperature based life factor is generated independent of the other factors in the mission point.
2.3.2 Table Application and Severity
Engine Services (ES) receives the new tables from engineering for each engine model and performs model verification and severity calculation prior to applying the new tables. ES gathers fleet operating data for the existing engines when possible. This information is grouped by sub-fleets binned by both operator and airframe and reviewed for shifts in trends over several years. If sufficient data is available for a sub-fleet, ES computes an average thrust, flight length, temperature and cruise altitude for the fleet based on historical data. These average values are checked against the HSE tables to identify the expected TOW for the fleet and this expected value is compared with historical observations. Historical observations for time on-wing are categorized by removal reason to identify data censoring and
truncation. Next a Weibull distribution fit provides the method of calculating fleet level average interval. It is generally observed that the engines are either removed near engineering prediction or significantly early due to unexpected causes; the result is an average overestimation of life expectancy and the ratio of actual life over expected life is referred to as the 'severity'. A senior technical fellow in the
engineering department states that "Every field problem, every removal is due to variability[47]." ES documents the residual error between the tables and historical observations.
For the purpose of this thesis, the data are categorized into regions defined as continental or sub-continental areas and airlines are grouped by nation of origin. This enables the maintenance policies and general climate effects of an area to be loosely accounted for. A regional correction table generated from these data points forms the basis of new models used for all engine TOW assessments. For each region one adjustment factor is determined which minimizes the average error within the region. The development of the regional severity factors corrects for a number of missing variables in the physics based analysis in a way that is operator independent, while adjusting broadly for political and
environmental drivers of performance. Typical results for a selected group of fleets shown in Figure 4 demonstrate an improvement in total forecast accuracy achieved by implementing the regional adjustment. The regional correction effects are shown in Figure 5.
Figure 4: Regional severity adjustment to standard engineering model with 95% CI of Weibull mean
Standard Engineering Model Performance
R2 0 1307,
Predicted Fleet Mean (Hrs)
Regional Regression on Weibull -Fleet Level Trained
R2= 0.5263 z Cf 21 a) a)
Predicted Fleet Mean (Hrs)
Figure 5: Effective B50 life factor of regions within comparable engine models
I C a) -D a) -J a) a)
(N' M V-4 r- N. r 4 0~L (!D (.D (U (U U LO C J <n <O < 0 0. ( CU M E w Lu E
The use of average fleet level values in deriving the severity factor constitutes a loss of information, and a misuse of the HSE tables. The HSE tables exhibit clear non-linearity in their outcomes as a function of each mission point variable. For example, flight lengths of 1 hour, 2 hours and 3 hours may result in a predicted TOW of 5,000, 10,000 and 12,000 hours respectively. Flying a mission in which 50% of the flights occur at 1 hr length, and 50% at 3 hour length would yield a final interval of 8,500 hrs if treated independently, or 10,000 hrs if the flight lengths were first averaged and then applied to the HSE tables.
Despite this, the combined model exhibits better overall data fitting due to its ability to over-fit the regional severity in a way that corrects for its statistical impurity.
2.3.3 Weibull methods for existing fleets
The application of the engineering tables and severity adjustments forms the basis of understanding engine life prediction prior to the first shop visit for any new fleet. A periodic review of fleet
performance against this expectation ensures that company is able to properly schedule maintenance work, update regional severity correction factors, and deploy corrective action for damage that arises faster than expected. When full intervals have been observed for at least three engines of similar model and thrust, a Weibull analysis is performed on the set of all engines in the sub-fleet of engines with the same operator, configuration and thrust rating. A review of the shop visit notes ensures that the
removals are driven by engine deterioration identified during inspection rather than "events" such as foreign objects, bird strike or service bulletin incorporation, collectively classified as censored
observations in Weibull analysis. Removals due to life limited part replacement schedules represent truncation in observable time length and are also classified as censored records. The Weibull mean and
95% confidence interval (CI) are compared to the engineering prediction. When the Weibull mean Cl is outside the value predicted by regional severity and engineering tables the fleet forecast is updated to reflect the new Weibull mean rather than the predicted value. This analysis for a single fleet can be done in under an hour after the data are collected.
When insufficient observations of non-censored engine refurbishments have occurred, Weibayes methods provide validation or challenge to the baseline fleet prediction. Weibayes is a statistical method involving data where only censored values are available. Either the shape or scale parameter of the Weibull distribution is assumed. Next Bayesian inference is used to identify the lowest possible value of the unconstrained parameter that permits a 95% probability of all known events simultaneously not occurring. ES performs Weibayes using the same off the shelf software that performs the Weibull analysis. To provide a conservative estimate of life a Weibull beta typical of tightly grouped failures is assumed for the Weibayes model and the 95% confident lower bound of the mean is compared to the original expected fleet performance. The Weibayes derived fleet level lower bound mean is generally trusted when it exceeds the originally predicted value. When the total fleet has a very low number of flight hours, typically less than half of the predicted flight hours, the Weibayes analysis generally
provides a mean confidence interval too broad and a lower end too low for general acceptance. Personal judgment by the ES analysis group in collaboration with the Pratt & Whitney customer fleet manager results in a decision to either use the Weibayes value or continue to base forecasts on the engineering tables and regional severity.
The combination of engineering tables and severity factors provides value to the company in estimating cost structure for both new contracts while the adjustments using Weibull and Weibayes analysis
prevent or minimize the financial effect of initial forecast error. At the same time the analysis incurs minimal cost for either data collection or analysis as the data is already recorded and analysis can be performed within only a few hours per contract. The model is fully flexible to the needs of the company because it does not rely upon special knowledge. The engineering tables and severity grids are applied multiplicatively as independent effects. The Weibull analysis within off the shelf software can be done in a repeatable and easily validated way after minimal training or statistical knowledge and is used as the basis of estimate for all fleets in place of the grid prediction once sufficient data has been observed. The application of the Weibull analysis and tables are flexible to unique aspects of the fleet management strategy or rapid changes in business knowledge. Overall the model system provides strong value and


![Table 1: Survey Scores for WDS functions, adapted from [44]](https://thumb-eu.123doks.com/thumbv2/123doknet/14038621.458803/20.918.217.661.112.404/table-survey-scores-wds-functions-adapted.webp)