HAL Id: hal-00023308
https://hal.archives-ouvertes.fr/hal-00023308
Submitted on 24 Apr 2006
HAL is a multi-disciplinary open access
archive for the deposit and dissemination of
sci-entific research documents, whether they are
pub-lished or not. The documents may come from
teaching and research institutions in France or
abroad, or from public or private research centers.
L’archive ouverte pluridisciplinaire HAL, est
destinée au dépôt et à la diffusion de documents
scientifiques de niveau recherche, publiés ou non,
émanant des établissements d’enseignement et de
recherche français ou étrangers, des laboratoires
publics ou privés.
Water in the envelopes and disks around young
high-mass stars
F. F. S. van der Tak, C. M. Walmsley, Fabrice Herpin, C. Ceccarelli
To cite this version:
F. F. S. van der Tak, C. M. Walmsley, Fabrice Herpin, C. Ceccarelli. Water in the envelopes and
disks around young high-mass stars. Astronomy and Astrophysics - A&A, EDP Sciences, 2006, 447-3,
pp.1011-1025. �hal-00023308�
arXiv:astro-ph/0510640 v1 21 Oct 2005
(DOI: will be inserted by hand later)
Water in the envelopes and disks around young high-mass stars
F. F. S. van der Tak
1, C. M. Walmsley
2, F. Herpin
3, and C. Ceccarelli
41 Max-Planck-Institut f¨ur Radioastronomie, Auf dem H¨ugel 69, 53121 Bonn, Germany; e-mail: vdtak@mpifr-bonn.mpg.de
2 Osservatorio Astrofisico di Arcetri, Largo E. Fermi 5, 50125 Firenze, Italy 3 Observatoire de Bordeaux, L3AB, UMR 5804, B.P. 89, 33270 Floirac, France
4 Laboratoire Astrophysique de l’Observatoire de Grenoble, BP 53, 38041 Grenoble, France Received 28 July 2005 / Accepted 21 October 2005
Abstract.Single-dish spectra and interferometric maps of (sub-)millimeter lines of H18
2 O and HDO are used to study the chemistry of water in eight regions of high-mass star formation. The spectra indicate HDO excitation temperatures of ∼110 K and column densities in an 11′′beam of ∼2×1014 cm−2 for HDO and ∼2×1017 cm−2 for H2O, with the N (HDO)/N (H2O) ratio increasing with decreasing temperature. Simultaneous observations of CH3OH and SO2 indicate that 20 – 50% of the single-dish line flux arises in the molecular outflows of these objects. The outflow contribution to the H18
2 O and HDO emission is estimated to be 10 – 20%. Radiative transfer models indicate that the water abundance is low (∼10−6) outside a critical radius corresponding to a temperature in the protostellar envelope of ≈100 K, and ‘jumps’ to H2O/H2∼10−4 inside this radius. This value corresponds to the observed abundance of solid water and together with the derived HDO/H2O abundance ratios of ∼10−3 suggests that the origin of the observed water is evaporation of grain mantles. This idea is confirmed in the case of AFGL 2591 by interferometer observations of the HDO 110–111, H18
2 O 313–220 and SO2 120,12–111,11 lines, which reveal compact (Ø∼800 AU) emission with a systematic velocity gradient. This size is similar to that of the 1.3 mm continuum towards AFGL 2591, from which we estimate a mass of ≈0.8 M⊙, or ∼5% of the mass of the central star. We speculate that we may be observing a circumstellar disk in an almost face-on orientation. Key words.ISM: molecules – Molecular processes – Stars: formation – Astrochemistry
1. Introduction
Water is a cornerstone molecule in the oxygen chem-istry of dense interstellar clouds and a major coolant of warm molecular gas1. In the surroundings of
embed-ded protostars, water can be formed by three very differ-ent mechanisms. In cold (∼10 K) protostellar envelopes, water may be formed in the gas phase by ion-molecule chemistry, through dissociative recombination of H3O+.
Simultaneously, on the surfaces of cold dust grains, O and H atoms may combine to form water-rich ice mantles. These mantles will evaporate when the grains are heated to ∼100 K, either by protostellar radiation or by grain sputtering in outflow shocks. Third, in gas with temper-atures >
∼250 K, reactions of O and OH with H2 drive all
gas-phase oxygen into water. Such high temperatures may occur very close to the star due to radiation, or further out in outflow shocks. The water molecule thus offers the
op-1 This paper uses the word ‘water’ to denote the chemical species, and the notations H2O, H18
2 O and HDO to denote specific isotopologues.
portunity to study the relative importance of each of these types of chemistry in the protostellar environment.
There has been considerable controversy about the water abundance around high-mass protostars. Observations of the H2O 6 µm bending mode with
ISO-SWS have revealed abundant water (H2O/H2 ∼10−5–
10−4) in absorption toward several high-mass protostars
(Boonman & van Dishoeck 2003). The absorption data do not tell us the location of the H2O along the line
of sight, except that the high excitation temperatures (∼300–500 K) imply an origin in warm gas. In contrast, observations of the o-H2O ground state line at 557 GHz
with SWAS of the same sources indicate much lower abun-dances (H2O/H2∼10−7–10−6; Snell et al. 2000). The
nar-row line width indicates an origin in the envelopes rather than the outflows of the sources, but the data have too low angular resolution (several arcminutes) for more detailed statements. Boonman et al. (2003) performed a simulta-neous analysis of ISO-SWS, ISO-LWS and SWAS data and inferred a water abundance jump in the inner envelope by four orders of magnitude for several high-mass YSOs.
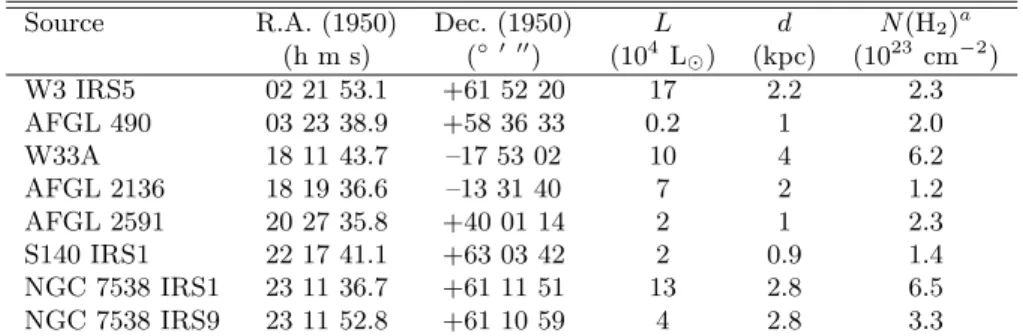
Table 1.Source sample.
Source R.A. (1950) Dec. (1950) L d N(H2)a (h m s) (◦ ′ ′′) (104 L⊙) (kpc) (1023 cm−2) W3 IRS5 02 21 53.1 +61 52 20 17 2.2 2.3 AFGL 490 03 23 38.9 +58 36 33 0.2 1 2.0 W33A 18 11 43.7 –17 53 02 10 4 6.2 AFGL 2136 18 19 36.6 –13 31 40 7 2 1.2 AFGL 2591 20 27 35.8 +40 01 14 2 1 2.3 S140 IRS1 22 17 41.1 +63 03 42 2 0.9 1.4 NGC 7538 IRS1 23 11 36.7 +61 11 51 13 2.8 6.5 NGC 7538 IRS9 23 11 52.8 +61 10 59 4 2.8 3.3 a: Column density in a 15′′ beam.
Locating the water around protostars requires obser-vations at high spatial and spectral resolution, which presently can only be done from the ground. Most ground-based observations of H2O have targeted the maser lines
at 22 and 183 GHz (e.g., Cernicharo et al. 1990). However, the anomalous excitation of these lines makes it hard to derive column densities from such data, which may in any case not be representative of the surrounding re-gion. The only thermal water lines that can be studied from the ground are the 313–220line of H182 O at 203 GHz
(Phillips et al. 1978; Jacq et al. 1988), and several HDO lines. These lines were used by Gensheimer et al. (1996) and Helmich et al. (1996) to estimate envelope-averaged abundances of H2O and HDO around several young
high-mass stars. Advances in sensitivity and resolution al-low us to consider al-lower-luminosity objects closer than the Sun than before, and also enable us to study abun-dance variations with position in the envelope. This pa-per presents new observations of these lines toward sources that have been studied previously with ISO and SWAS, including the first published interferometric observations of the H18
2 O line (and in fact of any non-masing
wa-ter line). The sources are eight deeply embedded high-mass stars, with luminosities of 2×10³ – 2×10⁵ L
⊙,
dis-tances of 1 – 4 kpc, and H2 column densities of 1 –
7×1023 cm−2, as listed in Table 1. Single-dish mapping
of dust continuum and molecular line emission at (sub-)millimeter wavelengths indicates envelope masses of 30 – 1100 M⊙within radii of 0.09 – 0.36 pc (Van der Tak et al.
2000b). The sources drive powerful outflows as revealed by mid-infrared and millimeter-wave observations of CO and HCO+(Mitchell et al. 1991; Hasegawa & Mitchell 1995a).
The unique aspect of this source sample is its high mid-infrared brightness, which allows us to compare its (sub-)millimeter emission with solid state data for the chem-istry, and with rovibrational absorption lines for the ge-ometry.
This paper is organized as follows. Section 2 de-scribes the observations, and Section 3 their direct results. Section 4 describes modeling of the data with a radiative transfer program. Section 5 discusses the results of the ob-servations and the models in the context of a disk/outflow geometry for these sources. Section 6 concludes the paper with an outlook toward future opportunities in this field.
2. Observations
Table 2 summarizes spectroscopic parameters of the ob-served lines, and gives the relevant telescope and its FWHM beam size at that frequency. With Eup ≈200 K,
the 313– 220line is the lowest-lying transition of H182 O that
can be observed from the ground. We use this line to mea-sure the abundance of H2O in the warm inner envelopes of
the sources. The HDO lines cover the range of excitation energies from 20 to 200 K, and are used to constrain the excitation and chemical state of the gas, in particular its deuterium fractionation. The SO2and CH3OH lines have
comparable excitation requirements, and are used to mea-sure the effects of shock chemistry (SO2) and ice
evapora-tion (CH3OH). The difference in Einstein A−coefficients
of the lines is mostly due to the ν3 dependence: all the
lines have transition dipole moments of a few Debye.
2.1. Single-dish observations
Observations of lines of H18
2 O, HDO, SO2 and CH3OH in
the 80 – 225 GHz range were made with the 30-m tele-scope of the Institut de Radio Astronomie Millim´etrique (IRAM)2 on Pico Veleta, Spain, in May 2003. The
front ends were the facility receivers A100, B100, A230 and B230, and the backend was the Versatile Spectral Assembly (VESPA) autocorrelator. The five lines were ob-served simultaneously with a spectral resolution of 0.1 – 0.3 km s−1. Integration times are 60 – 180 minutes
(on+off) using double beam switching with a throw of 180′′. System temperatures were 100 – 150 K at 3 mm
and 300 – 600 K at 1.3 mm wavelength. Data were cali-brated onto TMBscale by multiplying by ηf/ηb, where the
forward efficiency ηf is 0.95 at 3 mm and 0.91 at 1.3 mm,
and the main beam efficiency ηb is 0.78 at 3 mm and 0.57
at 1.3 mm wavelength. The spectra have noise levels per 0.25 km s−1channel of T
MB=10 – 15 mK at 80 GHz and
20 – 30 mK at 215 GHz.
Additional observations of HDO lines at 225, 241 and 464 GHz toward selected sources were carried out with the
2 IRAM is an international institute for research in mil-limeter astronomy, co-funded by the Centre National de la Recherche Scientifique (France), the Max Planck Gesellschaft (Germany) and the Instituto Geografico Nacional (Spain).
Table 2.Observed transitions.
Species Transition Frequency Eup Aul Telescope Beam JKpKo MHz K s −1 ′′ HDO 110–111 80578.3 47 1.3×10⁻⁶ IRAM 30m 30 HDO 312–221 225896.7 168 1.3×10⁻⁵ IRAM 30m 11 HDO 211–212 241561.6 95 1.2×10⁻⁵ JCMT 15m 21 HDO 101–000 464924.5 22 1.7×10⁻⁴ JCMT 15m 12 H18 2 O 313–220 203407.5 204 4.9×10⁻⁶ IRAM 30m 12 SO2 120,12–111,11 203391.6 70 8.1×10⁻⁵ IRAM 30m 12 CH3OH 5−1–40 E 84521.2 40 2.0×10⁻⁶ IRAM 30m 30
James Clerk Maxwell Telescope (JCMT)3on Mauna Kea,
Hawaii, in 1995 – 1997. These data were taken as part of a spectral line survey program, and have a lower spec-tral resolution and signal to noise ratio than the IRAM spectra. The facility receivers A2 and C2 were used as front ends and the Dutch Autocorrelation Spectrometer (DAS) as back end. The JCMT has a main beam effi-ciency of 0.65 at 1.3 mm and 0.53 at 0.6 mm wavelength. Integration times are 30 minutes at 241 GHz and 40 min-utes at 464 GHz, resulting in rms noise levels in TMB per
625 kHz channel of ≈40 mK at 241 GHz and ≈200 mK at 464 GHz.
All single-dish spectra have been reduced with the CLASS package, developed at IRAM4. Linear baselines
were subtracted and the spectra were smoothed once and calibrated onto TMB scale. We estimate a calibration
un-certainty of 30% for the 80 GHz IRAM and 240 GHz JCMT data, and of 50% for the 230 GHz IRAM and 460 GHz JCMT data, due to higher atmospheric opac-ity. The estimated pointing uncertainty for all single-dish data is 3′′rms.
2.2. Interferometric observations
The IRAM interferometer on Plateau de Bure (France) consists of six 15-m antennas on North-South and East-West baselines. We used this instrument to map the HDO 110–111, H182 O 313–220 and SO2 120,12–111,11 lines and
continuum at 80.6 and 204.9 GHz toward AFGL 2591. Due to tuning problems, only five antennas took 1.3 mm data in C–configuration on December 6, 2003; these prob-lems were solved before the D–array observations on May 15 – 16, 2004. The correlator was configured to produce ‘narrow’ 80 MHz and ‘broad’ 160 MHz windows, with one of each centered on the HDO and H18
2 O lines. The
num-ber of channels is 128 per window. The SO2 line falls in
the 160 MHz window of the H18
2 O line. The continuum
bandwidth is 640 MHz at 81 GHz and twice as much at 205 GHz, where tuning is double side band. Antenna gains and phases were monitored by observing 2013+370
3 The JCMT is operated by the Joint Astronomy Centre, on behalf of the Particle Physics and Astronomy Research Council of the United Kingdom, the Netherlands Organization for Scientific Research and the National Research Council of Canada.
4
http://www.iram.fr/IRAMFR/GILDAS/
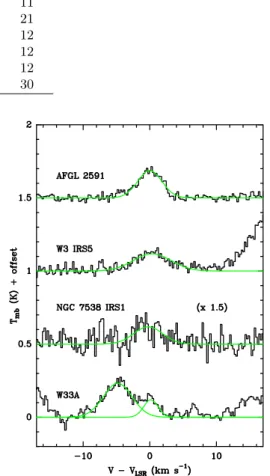
Fig. 1. Spectra of the H18
2 O 313–220 transition, obtained
with the IRAM 30m telescope. The line at V =+16 km s−1
is the SO2120,12–111,11 transition; the lines in the W33A
spectrum at V =−5 and −17 km s−1are due to CH
3OCH3.
and 2005+403 for 2 minutes every 20 minutes. The total observing time was 13.2 hr of good weather in C–array and 10 hr of excellent weather in D–array. The combined dataset has baselines ranging from the antenna shadow-ing limit out to 309 m, correspondshadow-ing to an angular scale of 2.2′′at 81 GHz and 0.85′′at 205 GHz. Data reduction
was performed at the IRAM headquarters in Grenoble, using the GILDAS software. Bandpass was checked on 3C273 and 2145+067. Flux calibration was performed on MWC 349, assuming Sν=1.0 Jy at 81 GHz and 2.0 Jy at
205 GHz.
3. Results
3.1. Single-dish spectra
With the IRAM 30m, we have detected H18
2 O in four
ob-jects (Fig. 1). The HDO 80 GHz line is detected in the same four objects, and the 225 GHz line in three of them. The CH3OH line is seen in all eight sources, and the SO2
Table 3. Line fluxes (K km s−1) or 1σ upper limits (mK) observed with the IRAM 30m. Numbers in brackets are
uncertainties in units of the last decimal place. The errors do not take calibration into account but only spectral noise.
Source HDO CH3OH H18 2 O SO2 HDO 110–111 5−1–40 E 313–220 120,12–111,11 312–221 W3 IRS5 0.14(2) 0.17(2) 0.84(7) 19.44(8) <36 AFGL 490 <13 0.39(2) <24 <24 <31 W33A 0.66(3) 7.69(3) 0.46(2) 4.73(2) 4.06(6) AFGL 2136 <9 0.50(1) <21 0.85(3) <27 AFGL 2591 0.15(1) 1.51(1) 0.86(3) 4.01(3) 0.59(3) S140 IRS1 <10 1.41(1) <22 2.26(3) <23 NGC 7538 IRS1 0.26(3) 2.64(2) 0.43(9) 2.09(8) 1.57(8) NGC 7538 IRS9 <12 2.07(2) <22 0.62(4) <29
Table 4.Widths (FWHM in km s−1) of the lines observed with the IRAM 30m. Numbers in brackets are uncertainties
in units of the last decimal place.
Source HDO CH3OH H18 2 O SO2 HDO 110–111 5−1–40 E 313–220 120,12–111,11 312–221 W3 IRS5 3.2(5) 2.7(4) 6.8(10) 6.67(4)a ... AFGL 490 ... 2.5(2)a ... ... ... W33A 4.6(2) 4.67(2)a 3.8(1) 6.1(1)a 5.06(9)a AFGL 2136 ... 2.79(7)a ... 4.2(2) ... AFGL 2591 3.3(4) 2.87(3)a 4.3(2) 5.33(5) 3.2(2) S140 IRS1 ... 2.68(3)a ... 2.67(4)a ... NGC 7538 IRS1 3.6(5) 3.21(3)a 5.2(16) 6.1(3) 3.8(2) NGC 7538 IRS9 ... 2.94(3)a ... 5.3(4) ...
a: Line core only; also wings visible
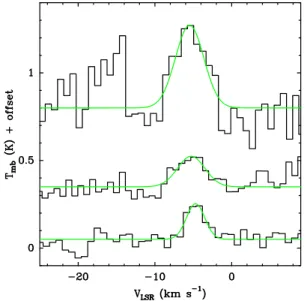
Fig. 2. Observations of HDO lines toward AFGL 2591 with the JCMT. Top to bottom: 465 GHz, 241 GHz, 225 GHz lines. The bottom two spectra have been multiplied by 2 and all spectra are vertically offset for clarity. The feature at VLSR=–15 km s−1in the upper spectrum is due
to the CH3OH 188,10–189,10E line.
line in all but one. Tables 3 and 4 list the integrated inten-sities and widths of the lines, obtained through Gaussian fits to the profiles. Note that for strong lines, calibration
Table 5.JCMT observations of HDO.
Line RTMBdV VLSR ∆V TMB K km s−1 km s−1 km s−1 K AFGL 2591 312–221 0.308(48) –4.70(22) 2.83(52) 0.10 211–212 0.394(80) –5.27(45) 4.24(88) 0.09 101–000 2.19(41) –5.48(43) 4.35(81) 0.47 NGC 7538 IRS1 312–221 0.74(12) –58.43(28) 3.57(62) 0.20
dominates the uncertainty on the line flux, while spectral noise dominates for weak lines. The spectra also show a few unexpected lines. In W33A, the 404–303 line of
for-mamide (NH2CHO) at 84542.4 MHz was detected with
TMB = 42 mK and ∆V = 5.6 km s−1. Next to the H182 O
line, the 330–221, 331–221 and 330–220 lines of dimethyl
ether (CH3OCH3) at 203420, 203410 and 203384 MHz are
detected with TMB= 0.21, 0.23 and 0.25 K and ∆V = 4.6,
4.4 and 4.9 km s−1. The 3
30–220line of CH3OCH3 is also
detected toward NGC 7538 IRS1, with TMB= 0.12 K and
∆V = 3.7 km s−1.
With the JCMT, we have detected three HDO lines in AFGL 2591, and one in NGC 7538 IRS1 (Fig. 2; Table 5). Upper limits (1σ) of TMB= 0.24, 0.35 and 0.17 K on
0.625 MHz channels were obtained for the 464 GHz line to-ward W33A, AFGL 2136 and S140 IRS1. For the 225 GHz line, upper limits of TMB = 38 mK were found for S140
a tentative detection of the 464 GHz line toward W3 IRS5 and upper limits on the 225 and 241 GHz lines; Schreyer et al. (2002) set an upper limit to the 464 GHz emission from AFGL 490. The JCMT spectra of HDO have a lower signal to noise ratio and spectral resolution than the IRAM 30m spectra, and the line positions and widths in Table 5 are too uncertain to extract kinematic information.
The central velocities and the widths of the HDO lines in the 30m spectra (Table 4) are consistent with the val-ues for the molecular envelopes of these objects, derived from C17O and C34S spectra (Van der Tak et al. 2000b).
In contrast, the H18
2 O lines are 30 – 90% broader than the
HDO lines in the same sources (Table 4), which may be an indication that part of the H18
2 O emission arises in the
molecular outflows of these sources. Only in W33A, the fitted width of the H18
2 O line is smaller than that of the
HDO lines, but for this source, the H18
2 O line is blended
with other lines (see Fig. 1), making its width hard to measure.
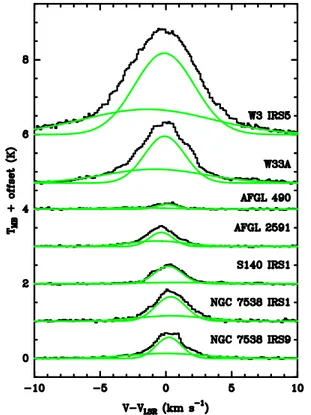
Evidence for a contribution to the observed emission by outflows is even more pronounced in the SO2 and
CH3OH spectra, which have higher signal-to-noise than
those of HDO and H18
2 O. The profiles of SO2 in three
sources and of CH3OH in seven show low-level emission at
high velocities (Table 4). We have fitted these profiles with the sum of two independent Gaussians: a narrow one cor-responding to the ‘envelope’ component seen in C17O and
C34S, and a broader one (Fig. 3) which we attribute to the
outflow. We find widths for the broad components between 4.7 km s−1 in AFGL 2591 and 12.8 km s−1 in W3 IRS5;
the source-averaged width is 7.1 km s−1. The broad
com-ponent is blueshifted from the narrow one in all sources except S140 IRS1, which ties in with the tendency for blueshifted mid-infrared absorption of CO (Mitchell et al. 1991), which also arises in outflows. The fraction of the line flux carried by the broad CH3OH component ranges
from 16% in S140 IRS1 to 58% in AFGL 2591, and is 39% on average. These fractions are comparable with the values of 10 – 50% found for CS, SO and SO2 in these
sources (Van der Tak et al. 2003) which may depend on excitation energy or beam size .Previous CH3OH
spec-tra of these sources which had lower signal to noise ratios and lower spectral resolution did not show line wings, al-though they did show wings for two other, similar objects (Van der Tak et al. 2000a).
The line profiles of H18
2 O and HDO do not have high
enough signal to noise ratios to perform two-component fits. Therefore we assume that the outflow contribution es-timated for CS, SO, SO2 and CH3OH also holds for H182 O
and HDO, which have similar excitation requirements and optical depths. However, instead of a double Gaussian fit, the outflow contribution may be estimated as the line flux at high velocities only. The result is somewhat less than half of that from a double Gaussian fit, or ∼10 – 20%. This value is probably consistent with the fraction of ≈50% es-timated for the o-H16
2 O ground state line observed with
Fig. 3.Line profiles of CH3OH, observed with the IRAM
30m, with two-component fits overplotted. For W3 IRS5, the SO2 line is plotted instead of the CH3OH line.
SWAS (Snell et al. 2000; Boonman et al. 2003), given the different excitation requirements.
The presence of significant amounts of CH3OH in the
outflow raises the question of its desorption from grain mantles. Toward young low-mass protostars, the methanol emission of transitions with low energy levels is domi-nated by outflow gas (Bachiller et al. 2001), indicating that grain mantle desorption by shocks is at work. Higher excitation methanol lines are broad toward some low-mass protostars and narrow towards others, indicating that shocks or thermal desorption may dominate in the warmer regions of the envelope (Maret et al. 2005; Jørgensen et al. 2005). The present data show that for high-mass proto-stars, radiation and shocks both have a relevant role in releasing ice mantles from dust grains too.
3.2. Excitation of HDO
For the sources where several HDO lines are detected, we have estimated the excitation temperature using rotation diagrams. This method, described in detail by Blake et al. (1987) and Helmich et al. (1994), assumes that the lines are optically thin and describes the molecular excita-tion by a single temperature, the ‘rotaexcita-tion temperature’. However, this temperature is only meaningful if all the data refer to the same physical volume. The beam sizes of our observations range from 12 to 30′′, and it is
impor-tant to consider the effect of beam dilution. Indeed, if the HDO emission from W33A, AFGL 2591 and NGC 7538
Table 6. Sizes and excitation temperatures of the HDO emission, derived from the single-dish observations.
Source Size Tex ′′ K W3 IRS5 ... 85 – 115 W33A 12 110±58 AFGL 2591 12 117±57 NGC 7538 IRS1 12 108±56
IRS1 were extended on scales as large as 30′′, the
upper-state column densities of the higher-excitation lines would be larger than those of the low-excitation lines, implying an infinite or negative excitation temperature. Since such non-thermal excitation is unlikely, the data must be cor-rected for the effect of a finite source size.
The size of the HDO emission can be estimated for AFGL 2591 and NGC 7538 IRS1, where the 225 GHz line has been measured both with the IRAM 30m and the JCMT. The emission is about twice as bright in the IRAM 30m beam, suggesting a compact source size. Therefore we assume a source size of 12′′ for the HDO in W33A,
AFGL 2591 and NGC 7538 IRS1, and correct the 80 GHz line fluxes upward by (30/12)2. This factor is much larger
than any plausible optical depth effect on the 80 GHz line, especially since the 464 GHz line, which lies lower in excitation, is expected to have a larger optical depth. Statistical equilibrium calculations indeed indicate opti-cal depths of ∼10−2 for the excitation temperatures and
brightness levels of HDO found here.
Table 6 lists the assumed sizes for all sources where HDO has been detected, and the resulting HDO excita-tion temperatures. The data do not rule out source sizes <12′′, and the assumed size may be regarded as an upper
limit. Smaller source sizes would influence all lines equally, though, and not change the excitation temperature esti-mates. In the case of W3 IRS5, the only firm detection of HDO is the 80 GHz line. The observational limits on the 225, 241 and 464 GHz lines indicate Tex=85–115 K, but
do not constrain the source size.
The excitation temperatures found for HDO may be used as a first clue to its chemical origin by comparison with SO2(a product of shock chemistry), CH3OH (a
prod-uct of ice evaporation), and C2H2 (a product of hot
gas-phase reactions). The excitation temperatures of HDO are similar to the values of 50 – 200 K derived for CH3OH
(Van der Tak et al. 2000a) and SO2 (Van der Tak et al.
2003), measured in (sub-)millimeter emission in 14 – 18′′
beams. These excitation temperatures are lower limits to the kinetic temperature of the emitting gas, but this prob-ably has little effect on the comparison with HDO since the molecules have similar dipole moments. The excita-tion temperatures are much lower than the values of 500 – 1000 K measured in mid-infrared absorption of C2H2
(Lahuis & van Dishoeck 2000) as expected for two rea-sons. First, the C2H2molecule does not have a permanent
dipole moment, and its excitation temperature directly
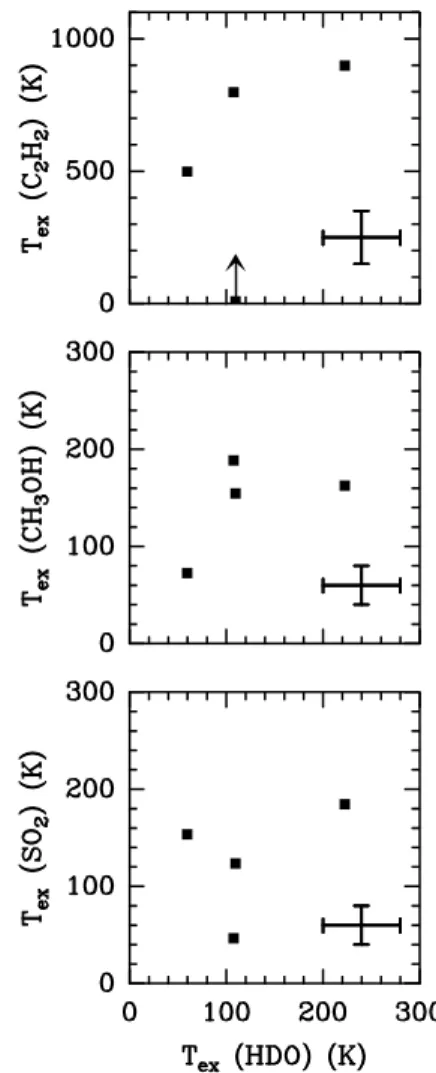
re-Fig. 4. Excitation temperatures of HDO plotted versus values of SO2(bottom), CH3OH (middle) and C2H2(top).
The low Texof C2H2in W33A may be affected by a high
continuum optical depth at 14 µm.
flects the kinetic temperature of its surroundings. Second, C2H2 is seen in absorption, which in these centrally
con-densed envelopes preferentially probes smaller radii, where the temperature is higher. The excitation temperatures of HCN 14 µm and H2O 6.2 µm absorption of 300 – 500 K
for these sources (Boonman & van Dishoeck 2003) are be-tween the values for HDO emission and C2H2absorption,
suggesting that the two effects contribute about equally. The HDO, CH3OH, SO2and C2H2in these objects are
thus located in warm (several 100 K) gas, such as found in the inner envelopes and outflow shocks of protostars. The exact temperature is hard to estimate because of the above caveats, so that we have searched for trends instead. Even here, the data appear inconclusive (Fig. 4). Further discussion of the origin of the HDO is deferred until after the radiative transfer model in § 5.
3.3. Column densities of HDO and H
2O
Knowing the excitation conditions, we derive molecular column densities from the observed line strengths. For
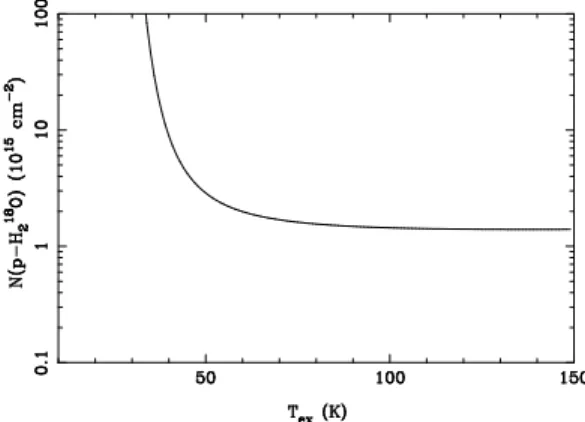
Fig. 5.Sensitivity of the derived p−H18
2 O column density
to the adopted excitation temperatures, for a line flux of 1.0 K km s−1.
HDO, these follow directly from the rotation diagrams. For H2O, these come from the H182 O data, assuming
op-tically thin H18
2 O emission with the same excitation
tem-perature as the HDO in that source. We use an oxygen isotope ratio of16O/18O=500 and assume an ortho/para
ratio of 3 for H2O, as expected for warm gas. The
result-ing column densities (Table 7) are uncertain by a factor of ≈2, mainly through the uncertain excitation temperature. The sensitivity of N (H2O) to Tex is such that increasing
Texfrom 110 to 220 K increases the derived column
den-sity just slightly, while decreasing Tex from 110 to 60 K
almost doubles it and further lowering Texleads to
implau-sibly high H2O column densities (Figure 5). In addition,
if the source size is smaller than the 12′′ assumed above,
the column density estimates would increase. For the four sources where HDO and H18
2 O were
not detected, the noise levels of the spectra imply lim-its on the column densities. Assuming Tex=110 K and
∆V =3.0 km s−1, the 3σ limits in an 11′′ beam are
N (HDO)<6.5×1013 cm−2 and N (H
2O)<6.4×1016cm−2,
which for both species is a factor of ≈2 below the weakest detection. In the cases of AFGL 490, S140 IRS1 and NGC 7538 IRS9, the non-detection of HDO and H18
2 O
emis-sion ties in with non-detections of H2O 6.2 µm absorption
(Boonman & van Dishoeck 2003; Schreyer et al. 2002) and low column densities of warm H2 as traced by13CO
4.7 µm absorption (Mitchell et al. 1990; Mitchell et al. 1995). In contrast, AFGL 2136 does have high H2O and
H2column densities measured in mid-infrared absorption,
but this gas must be compact, since the H2 column
den-sity from (sub-)millimeter data is low (Van der Tak et al. 2003).
The derived molecular column densities may be used as a clue to the source geometry by comparing them with values measured in mid-infrared absorption. The H2O
col-umn densities in Table 7 are consistent with the values from ISO 6.2 µm absorption (Boonman & van Dishoeck 2003) to within factors of a few. This situation is sim-ilar to that for CO and dust, where (sub-)millimeter data indicate column densities ∼3–5× higher than
mid-infrared data (Van der Tak et al. 2000b). Therefore, if these species are spherically distributed around the cen-tral star, this region must be extended on the scales of the single-dish beams (diameter >
∼1
′′, corresponding to
>
∼2000 AU at d=2 kpc), Alternatively, these molecules
do not have spherically symmetric distributions. In con-trast, for SO2 and HCN, mid-infrared absorption lines
in-dicate ∼100× higher column densities than (sub-)milli-meter emission lines (Keane et al. 2001; Boonman et al. 2001). These molecules must have distributions as com-pact as <
∼0.
′′1 (<
∼200 AU) which may or may not be
spher-ical. Additional constraints on the source geometry come from the interferometer data (§ 3.5).
The N (HDO) / N (H2O) ratios (Table 7, column 6)
are consistent with the limits on solid-state HDO/H2O
obtained for these same sources (Dartois et al. 2003), and similar to the values measured for ‘hot core’ type regions (Jacq et al. 1990; Gensheimer et al. 1996). The ratios cor-respond to enhancements of the HDO/H2O ratio over the
elemental abundance ratio (D/H=1.5×10−5; Linsky 1998)
of 7 for W3 IRS5, 50 for AFGL 2591, 200 for NGC 7538 IRS1 and 470 for W33A. The enhancement level shows a correlation with the mass-weighted average envelope tem-perature ¯T of these sources (Van der Tak et al. 2000b), listed in the fifth column of Table 7, in the sense that colder sources have higher HDO/H2O ratios. The decrease
of the HDO enhancement from 470 in W33A ( ¯T =20 K) to 7 in W3 IRS5 ( ¯T =33 K) is the combined result of a decrease in N (HDO) by a factor of 16 and an increase in N (H2O) by a factor of 4. The HDO/H2O ratios in
Table 7 are 10 – 100× higher than the equilibrium value at the estimated gas temperatures (∼few 100 K), which suggests that the HDO (and H2O) molecules are a
rem-nant from an earlier, colder phase of the protostars (like in the case of low-mass protostars; see § 5.3). A natural explanation is that HDO (and H2O) molecules are
subli-mated from the grain mantles in the warm region where the dust temperature exceeds 100 K, the ice sublimation temperature. In this scenario, the coldest sources would be also the youngest, where gas-phase reactions occurring in the warm region containing the sublimated ices have had less time to bring the HDO/H2O ratio back down to
the equilibrium ratio at ≥100 K.
3.4. Interferometric continuum images
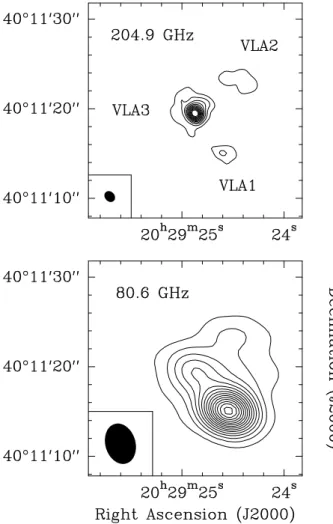
Figure 6 presents continuum maps of AFGL 2591, made by gridding and Fourier transforming the IRAM interfer-ometer data and deconvolving with the Clean algorithm. Using uniform weight, the size (FWHM) of the synthe-sized beam is (1.33×1.07)′′ at PA=47◦ at 205 GHz and
(4.60×3.38)′′at PA=74◦at 81 GHz. The rms noise level of
the maps is 0.34 mJy/beam at 81 GHz and 1.3 mJy/beam at 205 GHz.
The 205 GHz map shows three sources, and Table 8 lists their properties, derived by fitting two-dimensional Gaussians to the u,v data. The strongest, Eastern source
Table 7.Column densities of HDO and H2O in an 11′′beam, derived from the single-dish observations.
Source HDO H2O H2Oa T¯d HDO/H2O 1014cm−2 1017 cm−2 1017cm−2 K 10−4 W3 IRS5 0.3 – 0.6b 2.6 – 5.0c 3 33 1 W33A 6.9 1.4 <8 20 70 AFGL 2591 2.3 3.0 4 28 8 NGC 7538 IRS1 2.7 1.3 <5 25 30
a: From ISO 6.2 µm absorption (Boonman & van Dishoeck 2003) in a pencil beam. b: Values for source sizes of 30′′
and 12′′ .
c: Values for Tex=110 and 60 K.
d: Mass-weighted envelope temperature from Van der Tak et al. (2000b).
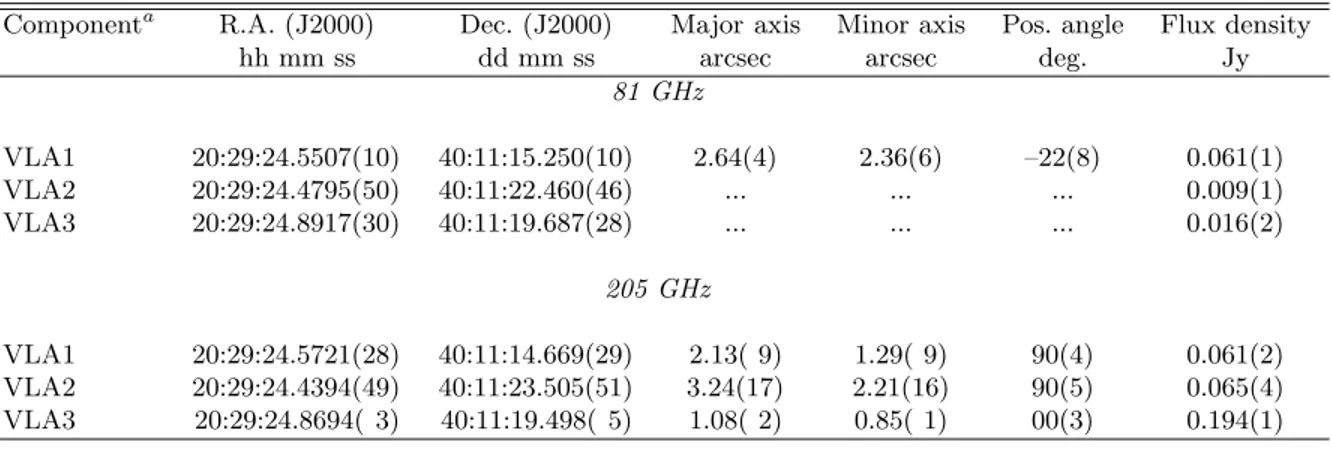
Table 8. Positions, deconvolved sizes, and strengths of continuum sources in the AFGL 2591 region, detected with the interferometer. Numbers in brackets denote uncertainties in units of the last decimal.
Componenta R.A. (J2000) Dec. (J2000) Major axis Minor axis Pos. angle Flux density hh mm ss dd mm ss arcsec arcsec deg. Jy
81 GHz VLA1 20:29:24.5507(10) 40:11:15.250(10) 2.64(4) 2.36(6) –22(8) 0.061(1) VLA2 20:29:24.4795(50) 40:11:22.460(46) ... ... ... 0.009(1) VLA3 20:29:24.8917(30) 40:11:19.687(28) ... ... ... 0.016(2) 205 GHz VLA1 20:29:24.5721(28) 40:11:14.669(29) 2.13( 9) 1.29( 9) 90(4) 0.061(2) VLA2 20:29:24.4394(49) 40:11:23.505(51) 3.24(17) 2.21(16) 90(5) 0.065(4) VLA3 20:29:24.8694( 3) 40:11:19.498( 5) 1.08( 2) 0.85( 1) 00(3) 0.194(1)
a: Nomenclature from Trinidad et al. (2003).
(VLA3) coincides with the ‘dust peak’ and the infrared source AFGL 2591. The South-Western source VLA1 is a compact H II region which dominates the field at fre-quencies <
∼100 GHz. The weakest, North-Western source
coincides with feature ‘VLA2’ in low-frequency (<10 GHz) VLA maps. Our 81 GHz map (Fig. 6, bottom) shows the same three features, but their emission is blended due to the lower angular resolution. These results are consistent with previous mapping at similar frequencies with the OVRO interferometer (Van der Tak et al. 1999). However, the Bure data have higher sensitivity, making these the first detections of the NW and SW H II regions at frequencies >200 GHz. On the other hand, the OVRO data have higher resolution, so that the infrared source and the H II regions are well separated at 87 GHz. Source VLA2 is visible in the OVRO 87 GHz data, but not firmly detected.
To study the physical nature of the continuum sources, we calculate their millimeter-wave spectral indices γ, de-fined as Sν ∝νγ. To do so we combine the 87 GHz data
from OVRO with the 205 GHz data from IRAM. The uv coverage of these telescopes is similar, and the effect of ‘missing flux’ on their comparison is probably small. The result is γ=0.0±0.05 for VLA1, γ=+2.1±0.2 for VLA2 and γ=+2.7±0.1 for VLA3. These values indicate opti-cally thin free-free emission for VLA1, optiopti-cally thick dust or free-free emission in VLA2, and optically thin dust
emission in VLA3. The brightness temperatures of the 205 GHz sources are 0.7 K for VLA1, 0.3 K for VLA2 and 6.1 K for VLA3. These values are much lower than the expected physical temperatures of either ionized gas or dust, and indicate either a low optical depth or a small filling factor.
For the ‘dust’ source VLA3, we calculate the mass from the observed 205 GHz flux density, assuming a dust temperature of 100 K, a standard gas to dust ratio of 100 and a mass opacity of 0.9 cm2 per gram of dust
(Ossenkopf & Henning 1994; Henning et al. 2000). The result is 0.8 M⊙, which is inversely proportional to the
assumed temperature. Interestingly, the spectral index of VLA3 indicates a value of the dust opacity index of β ≈ 1, which is smaller than the ‘usual’ value of ≈2 and suggests grain growth. This process is thought to occur in circum-stellar disks, which is not inconsistent with the observed elongated shape of VLA3. The very compact 43 GHz emission from ionized gas seen by Van der Tak & Menten (2005) may then originate in the ionized inner part of the disk, a disk atmosphere, or a disk wind (Hollenbach et al. 1994; Lugo et al. 2004).
Fig. 6. Maps of the continuum emission of AFGL 2591 made with the IRAM interferometer. Contours are drawn every 8 mJy/beam at 205 GHz (top) and every 3 mJy/beam at 81 GHz (bottom). Source nomenclature and synthesized beam size are indicated.
3.5. Interferometer observations of H
2O, HDO and
SO
2line emission
Figure 7 shows the maps of the HDO, H18
2 O and SO2
line emission observed with Bure. The beam sizes are the same as those of the continuum maps at that frequency. The rms noise levels of the line maps are 9 mJy/beam for HDO, 23 mJy/beam for H18
2 O, and 50 mJy/beam for
SO2. In the case of SO2, the noise is limited by dynamic
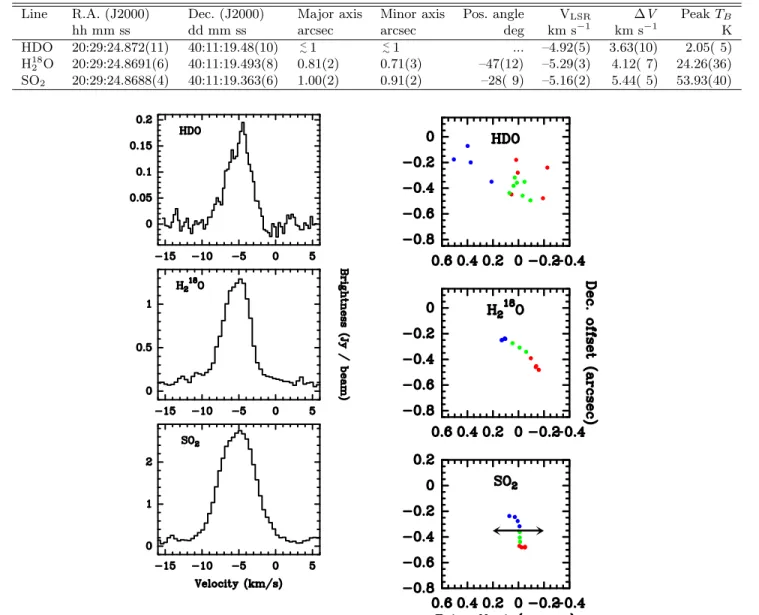
range problems. The line maps show compact emission, coincident with the ‘dust peak’ of AFGL 2591. Columns 2–6 of Table 9 list the position, size and shape of the emission, obtained by fitting 2D Gaussians to the u,v data. Figure 8 shows spectra of the line emission, taken at the peak positions of the images. Columns 7–9 of Table 9 list the central positions, widths, and peak strengths of the lines, obtained by fitting Gaussian profiles to the spectra at the image maxima. The central velocities of the lines are consistent with the values measured at the 30-m telescope (Table 4). The width of the SO2 line is consistent with
the single-dish value, while the H18
2 O line is 23% broader
and the HDO line 50% broader. Within the errors, all
Fig. 7. Interferometric maps of line emission toward AFGL 2591 at the central velocity. For HDO (top), first contour and contour step are 30 mJy/beam. For H18
2 O
(middle) and SO2(bottom), first contour is 0.15 Jy/beam
and contour step is 0.3 Jy/beam.
of the single-dish flux is recovered by the interferometer: apparently, both telescopes trace the same gas, which has a compact (<
∼1
′′) distribution. Given the constraints on
the source geometry from the comparison of single-dish and infrared column density estimates (§ 3.3), we conclude that the H18
2 O and HDO emitting regions have sizes of
∼1′′.
3.6. Velocity structure of the line emission
Channel maps of H18
2 O, HDO and SO2 do not show clear
changes of the emitting structure with velocity, but the signal to noise ratio of the Bure line data is high enough to locate the emission peak to a fraction of a synthesized beam width. Therefore, to study the velocity structure of the compact molecular gas, we have determined the position of the emission peak in each channel by a fit to the (u,v) data, and Fig. 9 shows the result. The H18
2 O and SO2
lines show a clear velocity gradient, where the redshifted gas is located in the South-West and the blueshifted gas in the North-East. The HDO shows the same trend, but not as clearly due to the lower angular resolution. In each case, the gradient is smooth, which suggests that the emission
Table 9.Positions, deconvolved sizes, velocities, and strengths of emission lines detected toward AFGL 2591 with the interferometer. Numbers in brackets denote uncertainties in units of the last decimal.
Line R.A. (J2000) Dec. (J2000) Major axis Minor axis Pos. angle VLSR ∆V Peak TB hh mm ss dd mm ss arcsec arcsec deg km s−1 km s−1 K HDO 20:29:24.872(11) 40:11:19.48(10) < ∼1 < ∼1 ... –4.92(5) 3.63(10) 2.05( 5) H18 2 O 20:29:24.8691(6) 40:11:19.493(8) 0.81(2) 0.71(3) –47(12) –5.29(3) 4.12( 7) 24.26(36) SO2 20:29:24.8688(4) 40:11:19.363(6) 1.00(2) 0.91(2) –28( 9) –5.16(2) 5.44( 5) 53.93(40)
Fig. 8. Interferometric spectra of line emission toward AFGL 2591 taken at the image maxima.
traces a physically coherent structure. Since the central position of the line emission coincides with that of the dust continuum peak, and its central velocity with that of the large-scale molecular envelope, the most plausible origins of the velocity gradient are outflowing motions in a bipolar cavity, or rotation in a circumstellar disk.
One central prediction of disk accretion models of low-mass star formation is that the outflow axis is perpen-dicular to the disk plane. The orientation of the struc-ture seen in Figure 9 does not agree with that of the large-scale outflow which is known to emanate from AFGL 2591. The position angle of the velocity gradient is 39◦ in
H18
2 O and 67◦ in SO2 (measured East from North). The
value for HDO is 13◦, but this number is uncertain due
to the large scatter in the data points, and not incon-sistent with the value for H18
2 O. In contrast, single-dish
CO 3–2 and HCO+ 4–3 mapping (Hasegawa & Mitchell
Fig. 9. Position of the emission peak in AFGL 2591 in each channel, as offset from the phase center of the Bure observations, for HDO (top), H18
2 O (middle) and SO2
(bottom). Colour coding corresponds to velocity offset: red = redshifted (–VLSR=2.5 – 4 km s−1), green = line center
(–VLSR=4.5 – 6 km s−1), blue = blueshifted (–VLSR=6.5
– 8 km s−1). The arrow in the bottom panel indicates the
orientation of the large-scale CO outflow.
1995b) shows an outflow of size 90×20′′, embedded in an
arcminute-scale outflow seen before in lower-J CO lines (e.g, Lada et al. 1984). The East-West orientation agrees with the positions of Herbig-Haro objects and spots of shock-excited H2 emission (Tamura & Yamashita 1992;
Poetzel et al. 1992). On smaller scales, VLBI observations of H2O masers by Trinidad et al. (2003) show a shell-like
structure which they interpret as an outflow cavity. The spots are spread over 0.02′′, in an elongated structure
On the other hand, if the line emission seen with Bure is due to a disk, the inclination is probably close to face-on. For example, the Gaussian fits presented in Table 9 imply axis ratios of 0.90±0.02 for H18
2 O and SO2, corresponding
to an inclination of (26±3)◦. A face-on disk is also
consis-tent with the much higher outflow velocities seen in CO mid-IR absorption than in mm emission. The outflow is thus directed almost along the line of sight.
The total magnitude of the velocity gradient is 4.6 km s−1 over an offset of 0.3′′. Adopting a distance
of 1 kpc and assuming the above inclination angle, the implied rotation period is ∼1000 yr. The central star has a mass of ≈16 M⊙, based on the luminosity of the region
(Van der Tak & Menten 2005). For this orbital period and stellar mass, Kepler’s third law implies an orbital radius of 250 AU, which is within a factor of 2 from the measured value. This agreement does not prove that the line emis-sion originates in a rotating disk, but it does indicate that the gas motion is controlled by stellar gravity. Higher res-olution observations are necessary to resolve the velocity field of the compact line emission.
4. Radiative transfer analysis
Dividing the single-dish column densities in Table 7 by the N (H2) values based on (sub-)millimeter observations
of dust continuum and C17O lines in ≈15′′beams (Table 1)
leads to beam-averaged abundances of 2×10⁻¹⁰– 1×10⁻⁹
for HDO and 2×10⁻⁷ – 2×10⁻⁶ for H
2O. On the other
hand, the interferometer data of AFGL 2591 indicate a H2O column density of 3.4×1019 cm−2, assuming
opti-cally thin emission with Tex=100 K, while the 205 GHz
continuum indicates N (H2)=2.1×1024 cm−2 for a dust
temperature of 100 K. The H2O/H2 column density
ra-tio of 1.6×10⁻⁵ is >
∼10× higher than estimated from the
single-dish data. To resolve this discrepancy, we have run radiative transfer models of the line emission.
4.1. Model description
The column density ratios evaluated in the previous sec-tion are crude estimates of the molecular abundances be-cause they do not take excitation gradients along the line of sight into account. In protostellar envelopes and disks, where density and temperature vary over orders of mag-nitude, these gradients are very significant. Furthermore, column densities and their ratios do not give insight into the location of the gas along the line of sight. To estimate more accurate abundances, the line emis-sion of H18
2 O and HDO in our sources has been
mod-eled with the Monte Carlo radiative transfer program of Hogerheijde & van der Tak (2000)5. The application of
this program to H2O has been explicitly tested in a
ded-icated benchmark campaign (Van der Tak et al. 2005)6.
Spectroscopic and collisional input for the modeling comes
5
http://www.mpifr-bonn.mpg.de/staff/fvandertak/ratran/ 6
http://www.mpifr-bonn.mpg.de/staff/fvandertak/H2O/
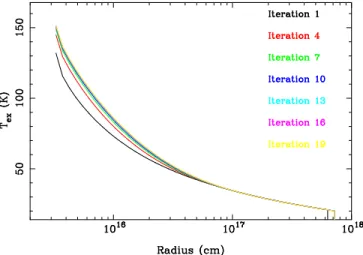
Fig. 10. Excitation temperature of the H2O 313–220 line
as a function of radius for the AFGL 2591 model. The curves for the last few iteration stages in the Monte Carlo calculation coincide, which shows that the simulation has converged.
from the molecular database by Sch¨oier et al. (2005)7.
Besides collisional excitation, dust radiation is taken into account using grain properties from Ossenkopf & Henning (1994), Model 5. Radial profiles of the temperature and density of the envelopes of our sources were determined by Van der Tak et al. (2000b) based on single-dish maps of dust continuum and molecular line emission at (sub-)millimeter wavelengths.
4.2. Constant-abundance models
We first assume that H2O and HDO are distributed evenly
over the protostellar envelopes. Table 10 reports the re-sults of these models. Stringent convergence criteria had to be applied, as the upper (emitting) level of the H18
2 O
line has a relative population of only ∼10−7in the outer
parts of the envelopes. Nevertheless, Figure 10 shows that the calculations are well converged. We calculate an op-tical depth for the H18
2 O line of ∼10−2. Maser action, as
often observed in the H2O 183 GHz line, does not occur
at H18
2 O abundances of ∼10
−8. The derived abundances
are factors of ∼30 higher than the line-of-sight averages from § 3.3, due to the strong excitation gradients in these sources.
4.3. Jump models
Although the constant-abundance models in the previous section fit the strength of the H18
2 O line and the average
strength of the HDO lines well, they have several short-comings. First, they predict FWHM sizes of the H18
2 O
and HDO emission in AFGL 2591 of 4–5′′, significantly
larger than the observed < ∼1
′′. Second, the fit residuals of
HDO are correlated with energy level, in the sense that low-excitation lines tend to be overproduced and
high-7
Table 10. Envelope-averaged abundancesa of HDO and
H2O relative to H2, derived from radiative transfer
mod-els.
Source HDO H2O 10−8 10−5 W3 IRS5 1 0.8 W33A 3 1.0 AFGL 2591 2 6.0 NGC 7538 IRS1 3 0.8
a: Average value over envelope
excitation lines underproduced. Both effects suggest that H2O and HDO are not distributed evenly throughout the
sources, but have enhanced abundances in the warm inner envelopes. Single-dish spectra and interferometer maps of H2CO and CH3OH (Van der Tak et al. 2000a) and of SO
and SO2 (Van der Tak et al. 2003) show the same effect.
Assuming that the water is produced by evaporation of icy grain mantles, we have run ‘jump’ models for H18
2 O
in AFGL 2591. The parameters of this model are the abundance in the warm inner region and the tempera-ture at which the ice evaporates. Laboratory studies in-dicate that the evaporation temperature lies in the 90 – 110 K range, depending on ice composition and structure (Pontoppidan et al. 2003; Fraser et al. 2005). With only one transition of H18
2 O observed, it is not possible to
con-strain both parameters simultaneously, so we have initially fixed the boundary of the inner region at the 100 K point. The water abundance is assumed negligible outside this radius, which for AFGL 2591 lies at 2000 AU. The upper level of the observed transition is too high to set useful limits on the water abundance in the outer envelope. We find that the observed line flux and source size are repro-duced for H2O/H2= 1.4×10⁻⁴which represents a major
fraction of the available oxygen.
Alternatively, the ice mantles may evaporate at a somewhat different temperature. We have run a model with the H2O abundance in the warm gas fixed at 2×10⁻⁴,
and varied the radius of the inner region to match the data. The best-fit model of this kind has the ice evapo-rating at T =115 K. We consider both H2O jump models
plausible; multi-line observations of H18
2 O are needed to
rule out either model. This result is consistent with mod-eling of the SWAS data of AFGL 2591 (Boonman et al. 2003) which indicates an evaporation temperature of 90 – 110 K.
The present data do not constrain the abundance of H2O/H2 in the outer envelope very well. Boonman et al.
(2003) derive an upper limit of ∼10−8 from a combined
analysis of ISO-SWS, ISO-LWS and SWAS data which cover a range of energy levels. However, such a low H2O
abundance would imply an HDO/H2O ratio of ∼unity
in the outer envelope, which is implausibly high for this type of object. Our best-fit model to the SWAS data has H2O/H2 ∼10−6 in the outer envelope, inconsistent with
the results by Boonman et al, but uncertain because based
on only one transition. Clearly, Herschel -HIFI data are needed to settle this issue.
For HDO, ‘jump’ models were run for each source ex-cept W3 IRS5, where too few lines were observed to con-strain such models. In these models, the jump occurs at the fixed location of T =100 K, and the HDO abundance inside and outside this radius are allowed to vary indepen-dently. The ‘jump’ models reproduce all the single-dish line fluxes to within 50%, which is about the expected er-ror margin. Table 11 reports the results of these models. For AFGL 2591, the size of the 81 GHz line emission mea-sured with Bure acts as an extra constraint. The best-fit constant-abundance model predicts an emitting region of ≈5′′FWHM, whereas the jump model predicts ≈2′′,
con-sistent with the measured value, so that this latter model is favoured.
The ‘jump’ models indicate that the HDO/H2O ratio
is ≈5×10⁻⁴ in the inner region. This value corresponds
to an enhancement over the interstellar D/H ratio by 100, and is consistent with the observational limits on the HDO/H2O ratio in the solid state. We conclude that the
bulk of the HDO and H2O seen with the 30m telescope
and the Plateau de Bure interferometer is evaporated ice.
5. Discussion
5.1. Geometry of AFGL 2591: A massive circumstellar
disk?
An important result from this study is that the H18
2 O
203 GHz emission from AFGL 2591 is very compact (800 AU diameter) and coincident within the errors with the continuum emission from VLA3. The 1.3 mm contin-uum data indicate a mass of 0.8 M⊙, which is ≈5%of the
stellar mass of ≈16 M⊙ (Van der Tak & Menten 2005).
One possible interpretation of these data is that we are observing the circumstellar disk surrounding the central star of AFGL 2591. The mass ratio seems plausible for a young protostar and given the observed axis ratios of the line and continuum emission (Tables 8 and 9), this putative disk is likely to be close to face-on (inclination 26 – 38 degrees). This inclination is compatible with the spectral energy distribution of the source in the near- to mid-infrared range (e.g., Whitney et al. 2003). However, there are certainly other possible interpretations of the data, at least as far as the line emission is concerned.
Another significant result from the interferometer ob-servations is that neither H18
2 O nor SO2 is distributed in
a spherically symmetric fashion around the central star. Figure 9 shows that the red and blue wings of the lines are offset from one another along a roughly NE – SW di-rection. The orientation seems to be somewhat different for water and SO2. While one clearly needs much better
angular resolution to interpret the data, we conclude that the velocity gradient in Fig. 9 is probably due to either disk rotation or the effect of the interaction of an outflow with the sides of a cavity (presumably directed toward us). SO2is a known outflow indicator (Schilke et al. 1997) and,
Table 11. Abundances of HDO and H2O in the inner and outer envelopes of the sources, derived from radiative
transfer models.
Source HDO/H2 H2O/H2 HDO/H2O 10−9 10−4 10−4 inner outer inner outer inner outer W33A 200 10 ... ... ... ... AFGL 2591 100 4 1.4 – 2a 10−2 – 10−4 b 5 40 – 4000 NGC 7538 IRS1 100 20 ... ... ... ...
a: Values for ice evaporating at T =100 K and T =115 K. b: From Boonman et al. (2003).
more in general, is found associated with shocked gas. It seems likely that in a wide-angle wind inclined at a mod-erate angle to the line of sight, different outflow tracers will show different orientations in a representation such as that of Fig. 9. Such differences in orientation may par-ticularly occur if the jet driving the outflow were to be precessing, which VLBI observations of H2O 22 GHz
in-dicate for AFGL 2591 (Trinidad et al. 2003). Although higher resolution imaging is required to settle this issue, we note that the column densities of H2O, SO2and H2are
well above the values in other massive molecular outflows (Beuther et al. 2002), making this scenario implausible.
Near-infrared speckle imaging of AFGL 2591 by Preibisch et al. (2003) supports our picture of the geome-try of the source. These images (as well as older ones) show several loops of emission extending due West from the cen-tral source, with major axes of ≈10′′and axis ratios of ≈3.
This emission presumably traces a limb-brightened cavity around the approaching outflow lobe. Since the outflow is expected to be perpendicular to the disk, the Western orientation of the loops is nicely consistent with the N–S orientation of the 205 GHz continuum emission. The near-infrared images thus indicate that the Western part of the disk is tilted away from us. The axis ratios of the loops are larger than that of the disk in the Bure images, as expected because the outflow is an intrinsically elongated structure, unlike the disk. The proposed outflow orientation is also consistent with the other observations mentioned in § 3.6. In these data, the general direction of the outflow is East-West, with some diversity among tracers as expected in the proposed pole-on orientation of the system.
It also is worth noting that the source-averaged N (H2O) toward AFGL 2591, corrected to a 0′′.8
source size, is 5×1019 cm−2, two orders of magnitude
higher than the value derived from ISO 6 µm data (Boonman & van Dishoeck 2003). This difference again suggests an asymmetrical distribution of material around the central source as, for example, in a disk geometry. Along the line of sight to the central source, one observes across the outflow cavity but column densities are much larger in the disk or perhaps (see above) toward the cav-ity edges where outflow and inner envelope interact. In this scenario, the high excitation temperatures derived from the ISO data indicate that the cavity is hot (sev-eral 100 K).
(VLA cm−wave continuum)
Ionized inner disk
(near−IR speckle imaging)
Outflow cavity walls
Molecular outflow
(high−velocity single−dish emission and mid−IR absorption lines)
*
Neutral outer disk
(mm−wave interferometry)
S
E W
N
0".1 1" 10"
Fig. 11.Sketch of the inner part of the AFGL 2591 region, as projected on the sky, with the observational character-istics of each physical component indicated. At a distance of 1 kpc, 1′′corresponds to 1000 AU.
Figure 11 summarizes our combined interpretation of the new and the existing observations of the central region of AFGL 2591. The circumstellar disk and the molecu-lar outflow are embedded in a molecu-large-scale molecumolecu-lar en-velope, observed as the low-velocity single-dish emission and mid-infrared absorption. For clarity, this large-scale envelope is not drawn here, but it is depicted in Fig. 11 of Van der Tak et al. (1999), along with additional large-scale features. Note that part of the cm-wave emission observed with the VLA may arise in the base of the out-flow.
5.2. Chemistry of water
It is also of great interest that the ‘jump’ models in Section 4.3 show that our observations are consistent with the idea that the H18
2 O emission traces gas with a
tem-perature above 100 K. Moreover, the H2O abundances
derived from these models are equal to or a few times higher than those estimated for H2O ice in these sources
(Van Dishoeck 1998; Boonman et al. 2003). Thus, we be-lieve that the 313–220 transition of H182 O can be used to
trace the behaviour of high temperature gas where wa-ter ice has evaporated. Since the inwa-terferomewa-ter recovers
all single-dish H18
2 O line flux, we conclude that the H182 O
emission appears to be an excellent tracer of the inner ∼1000 AU of protostars. In our model of AFGL 2591, the mass inside the 100 K point is 0.2 M⊙, similar to the mass
derived from the Bure continuum data.
The warm-up of the central region to 100 K is ev-idently sufficiently recent that gas-phase chemistry has not had time to modify the abundances substantially. The H2O/H3O+ ratio in W3 IRS5 is close to the
equi-librium value of 1000 (Phillips et al. 1992). For W33A, AFGL 2136, AFGL 2591, S140 IRS1 and NGC 7538 IRS9, our unpublished JCMT observations of the H3O+
364 GHz line indicate upper limits of TMB<0.13 – 0.21 K.
Because of the large Einstein A coefficient of the transi-tion, its excitation temperature is probably significantly below that of H2O and HDO. Assuming Tex=25 K and an
ortho/para ratio of 2, our upper limits on N (H3O+) are
(4–7)×1013cm−2. These numbers correspond to lower
lim-its on the H2O/H3O+ ratio of 2000 in W33A and 6000 in
AFGL 2591. Thus, in these sources, gas-phase chemistry seems not to have had time to return the H2O/H3O+ratio
to its equilibrium value since the evaporation of the grain mantles.
The time scale tion to reach chemical equilibrium
between H2O and H3O+ can be estimated by
realiz-ing that H3O+ is produced in reactions between H2O
and molecular ions, in particular HCO+, He+ and H+ 3.
Destruction of H3O+ is by dissociative recombination,
which for 25% re-forms water, but for 60% makes OH and 15% O (Jensen et al. 2000). We thus estimate tion
as (αLnX)−1, where αL is the Langevin reaction rate
of ∼10−9 cm−3 s−1, and the concentration of
molecu-lar ions nX is given by the balance of cosmic-ray
ion-ization on the one hand and reactions with CO and O on the other. Models by Van der Tak & van Dishoeck (2000) indicate nX ∼10−4 cm−3, so that tion∼3×10⁵yr.
We conclude that the evaporation of grain mantles in AFGL 2591 has taken place less than ∼0.1 Myr ago. The time scale may be even shorter, given the mass loss rate of ∼10−4 M
⊙yr−1 measured in the CO outflow
(Hasegawa & Mitchell 1995b). Assuming that the 0.8 M⊙
disk accretes at the same rate, the disk lifetime is only ∼104 yr. This value is similar to the age estimate of
3×10⁴yr from multi-species chemical modeling of the
en-velope of AFGL 2591 (Doty et al. 2002).
It may be asked whether the Monte Carlo treatment of radiative transfer in § 4 is useful given our uncertainty on the geometry. In fact, we think that our spherically sym-metric model is adequate to determine the mass of warm (>100 K) gas necessary to explain the observations, and this mass is, for an essentially optically thin line, geome-try independent. However, understanding line profiles as well as observations at still higher angular resolution will require a more sophisticated treatment such as axisym-metric modeling.
Figure 12 illustrates the limitations of our models by comparing them to the interferometer data in the uv plane. Although both models reproduce the total flux and
Fig. 12.Filled squares: Visibility amplitude of H18 2 O line
emission observed toward AFGL 2591 with the Plateau de Bure interferometer, integrated over velocity and binned. Superposed are model points for constant abundance (open squares) and for the ‘jump’ model (open circles).
the jump model also the source size as estimated through Gaussian fits, neither model reproduces the observations in detail. This discrepancy hints at the existence of ad-ditional geometrical structure which is not present in the model. The two models predict different source sizes, but the same overall emission shape, probably because the H18
2 O line is a tracer of warm gas.
Finally, our HDO data and the implied HDO/H2O
abundance ratios are interesting in combination with the result from the ‘jump’ models that the gas-phase water abundance is consistent with material which has recently evaporated off grains. Thus the observed HDO/H2O
should reflect the ratio of these species in the solid state and indeed, our result is consistent with current limits on HDO ice.
5.3. Comparison with low-mass protostars
The observations of H18
2 O presented here have shown that
in the studied high-mass protostars the water emission likely originates in the envelopes, and that the H2O
abun-dance jumps in the inner warm region where the grain mantles sublimate. A similar analysis of the ISO-LWS spectra of two low-mass protostars (Ceccarelli et al. 2000; Maret et al. 2002) shows that also in those cases, a jump in the water abundance at approximatively the radius where the dust temperature reaches 100 K is needed to explain the observed far-infrared water line spectrum. However, the water abundance in the warm gas is strikingly
differ-ent: ∼10−4 in the high-mass, and ∼3×10⁻⁶ in the
mass protostars respectively. Mid-infrared spectra of low-mass protostars give solid water abundances of ∼10−4 as
for high-mass protostars (Pontoppidan et al. 2004). It is not obvious why the water abundance in the warm gas should be only a few percent of the ice abundance. As §4.3 discusses, the exact ice evaporation temperature de-pends somewhat on the ice composition and structure, but not enough to make a factor of 100 difference. Unless the water abundances in the studied low-mass protostel-lar envelopes are affected by the protostel-large (80′′) ISO-LWS
beam, it seems that the break-down of evaporated wa-ter ice is faswa-ter around low-mass than around high-mass stars. This conclusion is somewhat surprising since wa-ter is destroyed by ion-molecule chemistry and the few available data suggest that if anything, the ionization rate is higher around high-mass than around low-mass stars (Van der Tak 2005). In the future, Herschel -HIFI data will be helpful to settle this issue.
HDO emission, practically at all the same frequen-cies of the present work, has been observed towards the low-mass protostar IRAS 16293-2422 (Parise et al. 2005). Similarly to the present work, the authors analyzed the observations with an abundance jump model. They found that the abundance of HDO has a jump from a value ≤ 10−9 in the outer envelope, where the dust
tempera-ture is lower than 100 K, to ∼ 10−7 in the inner
enve-lope. The abundance found in the region of sublimated ices is therefore very similar in high- and low-mass proto-stars. However, the HDO/H2O ratio is substantially
dif-ferent. In high-mass protostars it is at most 3 × 10⁻³,
whereas in the low-mass protostar IRAS 16293-2422 it is ∼ 0.03, namely ten times larger and close to to the ob-servational limit on solid HDO (Parise et al. 2003). This difference is as expected from recent measurements of ex-treme molecular deuteration around low-mass protostars, where doubly and triply deuterated molecules have been detected with fractionations of a few percent (for ref-erences, see Van der Tak 2005). The degree of deutera-tion in high-mass protostellar envelopes is much lower, starting from the failure to detect H2D+ in massive
pro-tostars (Pagani et al. 1992; Stark et al. 1999). Possibly, for high-mass protostars, the very cold and dense pre-collapse phase where the CO freezes out onto the grain mantles lasts only a short time. The present measurement of HDO/H2O in high mass protostars, compared with the
value found in IRAS 16293-2422, confirms this hypothesis: high-mass protostars show indeed a lower degree of water deuteration.
The water ice on grain surfaces is laid down in rela-tively low density molecular cloud gas (103 – 104 cm−3)
where H atoms are as abundant as O atoms and thus there is a relatively high probability of H2O forming subsequent
to O sticking to a grain. After formation, the ice presum-ably stays frozen until the dust is heated up by proto-stellar radiation. It is the temperature of this ‘primordial’ low-density molecular cloud gas that counts for the chem-istry of HDO/H2O. The present observations suggest that
this temperature is higher in the Giant Molecular Clouds producing high-mass stars than in low-mass star-forming regions such as Taurus and Ophiuchus.
6. Conclusion and Outlook
The chemical composition of star-forming matter depends on both temperature and time. For over a decade, people have tried to use the time dependence to estimate chem-ical ages of star-forming regions. These estimates, the so-called ‘chemical clocks’ remain unreliable, probably due to uncertainties in the initial conditions as well as in the physical structure (cf. Van der Tak 2005). This paper has shown that the temperature dependence may instead be used to apply ‘chemical filters’. In particular, we have used the H2O molecule to image the material at T > 100 K,
fil-tering out the surrounding cooler material. The success of this filter lies in the evaporation of icy grain mantles which enhance the H2O gas-phase abundance by two orders of
magnitude at T > 100 K.
By using this chemical filter, we have shown that the dust and water inside 2000 AU from the central star in the AFGL 2591 region is asymmetrically distributed. Most likely, the observations trace a circumstellar disk of diam-eter 800 AU which rotates at about Keplerian speed. The result of the SO2observations is qualitatively the same as
for H18
2 O, but differs in the details. In this case, the
‘chem-ical filter’ may be a bit leaky because the SO2 abundance
in the large-scale envelope is non-negligible, and because SO2is also abundant in the bipolar outflow of AFGL 2591.
Furthermore, comparison of our results with those for the prototypical low-mass system IRAS 16293 shows that the H2O abundance in the warm gas around young high-mass
stars is much higher, but the HDO/H2O ratio much lower
than around low-mass protostars.
In the future, observations with the PACS cam-era and the HIFI spectrometer onboard the Herschel space observatory will further refine this picture (Walmsley & van der Tak 2005). Observations of multi-ple H2O and H182 O lines will constrain the excitation and
ortho/para ratio of water much better than is possible from ground-based data. The high sensitivity will allow us to measure the water abundance in each chemical zone (disk/outflow/envelope), not only around high-mass pro-tostars, but also around lower-mass objects. Given our estimated outflow contribution of 10 – 20% to the H18
2 O
and HDO lines in HIFI-sized beams, the contribution from outflows to H16
2 O spectra from HIFI will probably be much
larger, which should be considered in the planning of the HIFI observations. New, deep searches for H3O+ in
high-mass protostellar envelopes with APEX, HIFI and ALMA would also be useful. Observations of the H18
2 O and SO2
lines in AFGL 2591 on longer baselines are necessary to resolve the velocity field and test other possibilities such as a binary system, as seen in the W3 (H2O) source by