Publisher’s version / Version de l'éditeur:
Materials Research and Standards, 7, 7, pp. 300-304, 1967-06-01
READ THESE TERMS AND CONDITIONS CAREFULLY BEFORE USING THIS WEBSITE.
https://nrc-publications.canada.ca/eng/copyright
Vous avez des questions? Nous pouvons vous aider. Pour communiquer directement avec un auteur, consultez la
première page de la revue dans laquelle son article a été publié afin de trouver ses coordonnées. Si vous n’arrivez pas à les repérer, communiquez avec nous à [email protected].
Questions? Contact the NRC Publications Archive team at
[email protected]. If you wish to email the authors directly, please see the first page of the publication for their contact information.
NRC Publications Archive
Archives des publications du CNRC
This publication could be one of several versions: author’s original, accepted manuscript or the publisher’s version. / La version de cette publication peut être l’une des suivantes : la version prépublication de l’auteur, la version acceptée du manuscrit ou la version de l’éditeur.
Access and use of this website and the material on it are subject to the Terms and Conditions set forth at
Time-dependent consolidation of a sensitive clay
Jarrett, P. M.
https://publications-cnrc.canada.ca/fra/droits
L’accès à ce site Web et l’utilisation de son contenu sont assujettis aux conditions présentées dans le site LISEZ CES CONDITIONS ATTENTIVEMENT AVANT D’UTILISER CE SITE WEB.
NRC Publications Record / Notice d'Archives des publications de CNRC:
https://nrc-publications.canada.ca/eng/view/object/?id=0fe89c72-0494-4f4c-8994-ed1487aeccb8 https://publications-cnrc.canada.ca/fra/voir/objet/?id=0fe89c72-0494-4f4c-8994-ed1487aeccb8Time-Dependent Consolidation
of a Sensitive Clay
P. M. Jarrett
REFERENCE: P. M. Jarrett, "Time-Dependent Consolidation of a Sensitive Clay, Materials Research & Standards, Vol. 7 , No. 7, July, 1967, pp. 300-304.
ABSTRACT: Consolidation tests have been carried out at vari- ous constant rates of loading in an effort to define the time-de- pendent aspects of the consolidation of Leda clay. The tests, last- ing from two days to three months, provide graphic evidence of the range of time effects for this clay. It has been found that the major time effects are concentrated around the preconsolidation stress level and that subsequently they diminish to more normal proportions. The tests have been assessed with regard to the probable structural behavior of the clay. The results further emphasize the error of normal consolidation analysis around the critical zone of major time effects. The tests also appear to in- dicate a minimum rate of laboratory loading below which the tinie factor is of far less importance. One further conclusion points to a practical necessity to allow for quite large settlements at loads around the preconsolidation value.
KEY WORDS: soil (material), clay (material), consolidation, time effects, viscosity, rheology
In a comprehensive study of consolidation, Taylor [111 noted a plastic resistance to compression within a clay structure, a resistance assumed to be dependent only on the speed of compression of the clay. Taylor believed that a film or thin zone of water covered the surface of clay particles and that adsorption and other surface phenomena occurred within this zone. He considered the film phase to act as a quasi-plastic ma- terial from which he developed the concept of a plas- tic flow of the multi-phase clay system leading to the development of what he termed a structural viscosity. This concept of a film of bound water surrounding the clay particles is still accepted in modern investiga- tions. The main points of discussion of the film phase now concern the extent of the layer and its degree of rigidity.
The generally accepted Terzaghi theory of consol- idation assumes that structural time effects are absent and that the dissipation of pore water pressure is the
= T h e i t a l i c n u m b e r s i n brackets refer t o t h e l i s t o f references appended t o t h i s paper.
Peter M. Jarrett holds a n honors B.Sc. degree f r o m N o t t i n g h a m University. England, a n d an M.Sc. degree f r o m Queen's U n i - versity, Canada. B o t h degrees are i n t h e f i e l d o f c i v i l engineer-
only retarding influence on compression. It was not until field investigations began to show disparity be- tween laboratory predictions and actual settlements and rates of settlements that major efforts were made to assess consolidation testing procedures.
Two papers by Crawford [ 2 , 3 ] , giving results from tests on sensitive Leda clays, have indicated substan- tial time effects other than those caused by dissipation of pore water pressure. The most obvious effect has been the variation of the preconsolidation load calcu- lated from results of tests made at various rates of loading or compression. These tests have shown that the slower rates of compression produce lower pre- consolidation loads and hence, for similar changes in effective stress, greater changes in void ratio. Fur- thermore, in a slow laboratory test in which much of the consolidation that takes place might normally be classed as secondary, it is believed that this compres- sion is structurally similar to that occurring as pri- mary settlement in a field case, where the dissipation of pore water pressure produces a similar slow rate of increase in effective stress to the elemental area with- in the soil mass. This seemingly anomalous behavior occurs due to the swiftness of the dissipation of the pore water pressure in the laboratory test. This leaves the structural viscosity as the predominant time ef- fect, whereas in the field slow pore water pressure dissipation masks the structural viscosity effects.
Barden and Berry [4] mention that the effects of structural viscosity are more dominant in thin speci- mens than in thick ones. They suggest further that in clays exhibiting no unusual properties, such as partial saturation, exceptional structure, or high compress- ibility. Terzaghi's theory nlay be used successfully. This is indeed true. but the exceptions should be noted to ernphasi~e the fact that Terzaghi's theory is not a panacea for consolidation problen~s. The soil de-
ing. Since g r a d u a t i o n f r o m Queen's, h e h a s been e m p l o y e d as a research officer i n t h e Soil Mechanics Section of t h e Di- vision o f B u i l d i n g Research. N a t i o n a l Research Council of Canada. Ottawa, Ont.. Canada. H i s work w i t h t h e Division h a s been concerned r n a ~ n l y w i t h consolidation studies i n relation t o b u i l d i n g settlements a n d also slope s t a b i l i t y problems.
4 5 6 7
V E R T I C A L S T R E S S , k g l s q crn
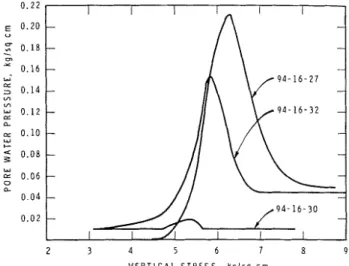
Fig. 1-Modified consolidation apparatus (A, transducer; B, Fig. 2-Relationship between pore water pressure and ap-
calibrated column). plied vertical stress for:various constant rates of loading.
scribed in this paper, a highly structured quite com- pressible material, does not respond exactly to Ter- zaghi's theory for rates of settlement.
As a development from Crawford's work, it was hoped that this series of tests, by eliminating incre- mental loading and excess pore water pressures, would give a more fundamental test procedure and a better understanding of the physical parameters involved in structural consolidation, especially as the slower tests more nearly approach field rates.
-
Test ProgramThe test program was carried out on specimens taken from an undisturbed block sample of sensitive Leda clay. The block was obtained from a depth of 34 ft in an excavation for the Ottawa sewage treatment plant. The general properties of this type of clay have pre- viously been described by Crawford and Eden 1-51
and by Crawford 131. The clay has a liquid limit of 6 4 per cent, a plastic limit of 27 per cent, a natural moisture content of 65 per cent, and 72 per cent clay- size particles.
type consolidometer with an 11 to 1 lever arm ratio. The load is provided by a mercury gravity system in which the mercury flows out of a calibrated container into a container on the loading arm. T h e flow is achieved by vertically raising the calibrated container (on a chain driven by a motorized gear box) and let- ting the mercury find its own level in the intercon- nected system.
Specimens were tested in Teflon coated, stainless steel consolidation rings (area 2 0 cm" height 2 cm). The rings were smeared with molybdenum disulfide grease prior to specimen trimming to minimize the ef- fects of side friction.
Pore water pressures were measured in most tests using a transducer [6] set into the base of the cell. The pore water pickup was through a '/2-in. diameter porous disk, set flush with the base of the cell, and then connected by a small drilled hole with the trans- ducer chamber. For pore water pressure measure- ments, the ring was sealed at the base with drainage allowed only at the upper surface. All tests were car- ried out in a temperature-controlled room at 20.5
t 0.5 C.
Procedure and Apparatus Test Results
The main tests in this program were carried out at Constant rate-of-loading tests were carried out at various constant rates of loading, using the apparatus five different rates, with the tests varying in length shown in Fig. 1 . This is an adaptation of the Bishop from 2 days to 3 months. Table 1 gives the rates of
Table 1-Constant Rates of Loading Tests
Calculated
Initial Preconsolida- Max. Pore Vertical Stress Pore Water Rate of Initial Moisture tion Water at Max. Pore Pressure as Sample Loading. Void Content, Pressure, Pressure, Water Pressure, Percentage of
No. kg/cm2/day Ratio, ea % kg/cmz kg/cm? kg/cm? Vertical Stress
- ~p - -- - -- 94-16-12.. . . 4 . 5 0 1.835 64.3 5.30 0.281 7 . 0 7 4 . 0 94-16-27.. . . 2 . 2 5 1.865 66.1 5.35 0 . 2 1 6.31 3 . 3 94-16-32.. . . .1.125 1.865 66.0 5.10 0.155 5.85 2.7 94- 16-30. . . 0.225 1.886 66.6 4.50 0.02 5.40 0 . 4 94-16-33.. . . .O. 125 1.855 65.9 4.30 . . . . . . . . .
0 i ~ i i 2.C I I I 1 I I I - 1 . 8 - - 0 . 1 - E 0 . 2 - + < E 0 - 5 . 1 - z - ", " z $ 0 . 4 - u 4 . 0 4 . 5 5 . 0 5 . 5 6 . 0 6 . 5 7 . 0 1 . 5 8 . 0 j.j 0 . 5 - - A V E R A G E ' J E R T I C & L S T R E S S . k y l r q t m
Fig. 6-Strain rate versus pressure for various rates of
0 . 6 L I loading.
1 . 0 2 0 3 . 0 0 . 0 5 . 0 6 . 0 8 . 0 V E R T I C A L S T R t S S . k g l l q rrn
Fig. 3-Relationship between applied vertical stress and change in void ratio for various constant rates of loading.
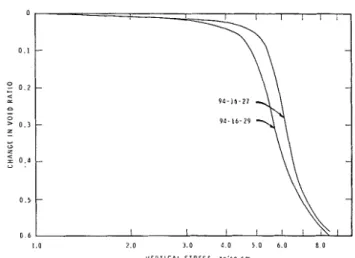
Fig. &Relationship between applied vertical stress and change in void ratio for two fastest rates of loading.
Fig. 5-Relationship between applied vertical stress and change in void ratio for two slowest rates of loading.
I 0 2 0 3 0 4 0 I 0 6 0 8 0 ' J E H T I C A L S T R E S S , l g , I q c m
Fig. 7-Relationship between applied vertical stress and change in void ratio for incremental and constant rate of loading tests.
Fig. 8-Combined plot of all tests for time, pressures, and void ratio change.
loading together with the significant results from these five tests. Pore water pressure readings were not taken for specimen 94-16-33 because of the insignifi- cant pressures obtained in specimen 94-16-30. Figure 2 gives examples of the over-all pore water pressure readings for specimens, 94-16-30, -32, and -27.
T o obtain good values of pore water pressures, specimtns were set up with the base beneath water. M1hen the rins was tightened in the cell, some pres- sure was built up in a small quantity of water trapped beneath the specimen. I n some specimens this was sufficient to lift the specimen in the ring. T o rectify this. an initial seating load had to be applied. Some apparent con~pression was observed in this range which is over and above any occurring in the clay. Plots of vertical stress against change in void ratio were therefore begun at a pressure of 1 kg/cm< Re- sults for specimens 94-16-30, -32, and -27 are plotted in Fig. 3. Figures 4 and 5 are con~parisons between specimens 94-16-12 and -27, and 94-16-30 and -33. respectively. These are presented separately for com- pleteness and because they contain some anomalies from the general trend, although it is believed that these were caused by small differences within the soil specimens. T h e strain rates that occurred under the influence of the various loading rates are presented in Fig. 6, where the term average vertical stress repre- sents the average applied vertical stress over the tim: period for which the strain rate was calculated.
One other series of tests was carried out to ascer- tain the effects of incremental loading on constant- rate testing. Specimens were loaded in constant incre- ments at the same over-all rates of loading as the standard constant-rate tests previously described. Some specimen difficulties created quantitative inac- curacies within this series, and so only a representa- tive example of these tests is given in Fig. 7. In this figure, 94-16-29 is the incremental test, for which de- tails are given in Table 1. The trend for the incremen- tal test to give lower preconsolidation pressures than the comparative constant-rate test was sustained whenever the tests were carried out. There appear to be two major reasons for this difference:
( 1 ) Shock loading affected the soil structure. ( 2 ) For each incremental period, the average ef- fective stress acting was greater in the incremental test than in a similar period of constant-rate loading. This is due to the initial rapid decrease in pore water pressure in the incremental tests.
Discussion
T h e effect of time on the laboratory tests is demon- strated quite clearly in the results shown in Fig. 3, and there are only minor pore water pressure effects. If the values of time, vertical pressure, and void ratio are combined, as in Fig. 8, a graphic demonstration of the region of influence of the time effects is provid- ed. T h e solid lines show constant vertical stress, with the various times taken toreach that stress under dif- ferent rates of loading plotted against the change in
void ratio up to that time. Dashed lines represent the time-change in void ratio curves for the five tests used. From this diagram, three stress zones may be considered to exist:
Zorqe I-The reloading zone of elastic compression where time effects are small and which extends from zero to approximately 4.0 kg/cmg vertical stress.
Zotle ?-The zone of major time effects in which major differences in consolidation occur for given stresses according to the rate of loading. A n ex- ample of this zone can be seen by following the stress line for 5.5 kg/cm2 in Fig. 8. Thus
if
a stress value of 5.5 k g / c m Y s reached by a constant rate of loading in 3200 min, then there is a void ratio change of about 0.12. If it takes 35,000 min, then there is a change of approximately 0.40. The zone appears to extend from 4.0 to perhaps 7.0 kg,!cm2. Zorle 3-This appears t o be the stage where themajor time effects diminish and where void ratio appears to establish domination as the prime criterion for equilibrium for all practical load rates. T h e latter boundary is far less definite than that be- tween Zones 1 and 2.
The behavior and presence of these three zones are compatible with Denissov's [ 7 ] postulations on un- derconsolidation in sensitive clays. H e proposes that clays forming bonds during deposition d o not consolidate in sit11 to the full amount as governed by stress-void ratio considerations. Thus instead of consolidating along a normal virgin curve these clays retain a higher void ratio due to bond forma- tion. This idea is also supported by the work of Leonards and Altschaeffl [8], who consider a quasi- preconsolidation load to develop with time, and Bjerrum and Wu [ 9 ] , who propose rigid bond for- mation in sensitive clays after deposition. The prob- lems in analysis arise when, due to further loading, these bonds are broken or destroyed. Denissov [7] states that, "underconsolidated soils are capable of decreasing their volume after the destruction of their natural structure, under constant stress rate." Taking an ideal example where all the bonds break simul- taneously at one stress, at that instant the material is at a void ratio much higher than that nccessary for equilibrium by stress-void ratio considerations. Con- solidation must therefore occur to restore an equi- librium. I t should be emphasized that this consolida- tion is a reduction in volume of the soil mass caused by the application of a sustained load to the mass and due principally to the adjustment of the internal structure of the soil mass. This is in part the standard definition of secondary consolidation (ASTM Defini- tion of Terms and Symbols Relating t o Soil Me- chanics, D 653 - 6 4 ) which in this ideal case occurs with virtually no primary consolidation preceding it. If a substantial load increment was applied over this zone, however, compression would appear to occur in the primary phase, the amount being deter- mined only by the test configuration. This idea is developed by Barden [ I 01.
Reverting to the practical casc, it is bel~eved that Zone 2 is the region wherc this form of consolida- tion occurs as the major structural change. Obvi- ously the clay is not ideal, and as such tlie bonds d o not break instantaneously but rather over a range of strcss, some of the physical effects of bonding rcmain. During this rcarrangenicnt of the intcrnal structure, thc structural viscosity imposes the major time effect as dcmonstratcd in Fig. 8.
As tlie material approaches cquilibriunl in void ratio, thc effects of structural viscosity lessen in com- parison with previous magnitudes, and Zonc 3 is rcaclicd, in which any major change in void ratio has to be acconlpanied by a cliange in strcss. This stage is close to the true virgin curve, although, due prcsumably to natural rcstraints such as any remain- ing structural effects, it is doubtful if the true curve is fully reached.
Further plausibility is given to this hypothesis by the form of the strain rate plots in Fig. 6. After breakdown occurs, the strain rate increases rapidly to a well-defined maximum. This maxinlun?, how- ever, is not sustained. It is believed that the reason is that the viscous deformation taking place before the maximum reaches a balance with the previously minor effect of particle separation. T h e deformation then becomes a mixture of viscous deformation and one controlled by the void ratio, as assumed in gen- eral consolidation theories. When the strain rates become more steady, after decreasing from tlie maxi- mum, as in specimen 93-16-30, the viscosity effects have taken a minor role in relation to thc void ratio. Finally, consideration of the pore water pressure characteristics in Fig. 2 supports the basic idea of an underconsolidated soil with its structure breaking down. As may be seen, there is a rapid peak and then decline in the pore water pressure which follows closely after the peak strain rates. From study of the initial and final values of the pore water pressures, it is obvious that the loading rates alone are not responsible for this increase. T h e sudden deforma- tion of the particle matrix must be transferring some small load to the pore water. It should b e stressed that it is the form of the pore water pressure curve that is important and not the magnitude of the pres- sures, which are almost negligible as percentages of other stresses.
Conclusions
Leda clay in its initial state possesses a strong floccu- lated clay matrix.
T h e consolidation process in Leda clay passes through three phases:
( 1 ) a n elastic deformation phase with little settle- ment, extending up to the preconsolidation area;
(2) breakdown of the initial bond between parti- cles, followed by a collapse of the flocculated clay structure, the rate of collapse being governed by a form of structural viscosity;
( 3 ) development of a more normal form of con- solidation behavior, with the void ratio being the
prime criterion for settlement as might occur in a normal clay without a highly flocculated structure.
It is belicved that the viscous type of deforma- tion exhibited by this clay in Zonc 2 is a major struc- tural phenomenon which must be recognized. In the practical case of settlement analvsis. this means that , ,
any load just above the preconsolidation load will probably cause major settlement which a standard analysis using "primary" consolidation curves would fail to show, due t o the small time involvcd in the test. Thus this "plastic flow" phase must be investi- gated by a slow rate of testing.
It appears that a rate of laboratory loading of about 0.225 kg/cm2/day for this type of material allows most of the time effects to develop, giving a "true" stress deformation curve for the material matrix.
Leda clay is all exceptional material, and these trends are - u n d o u b t e d l i magnified by its almost unique properties, but they point to the possibility that the same characteristics could be present to a lesser extent in other materials.
Acknowledgments
T h e author wishes to thank D. C . MacMillan for his invaluable help in carrying out these tests. Fur- ther thanks are due C. B. Crawford, head of the Soil Mechanics Section, for his continuing guidance and also to other colleagues in the Section for their helpful discussions. This paper is a contribution from the Division of Building Research, National Re- search Council, and is published with the approval of the director of the Division.
REFERENCES
[I] Taylor, D. W., "Research on Consolidation of Clays," Serial
82, 1942, Department of Civil and Sanitary Engineering, Massachuseits Institute of Technology, Cambridge, Mass.
[ 2 ] Crawford, C. B., "Interpretation of the Consolidation Test,"
Proceedings, American Society of Civil Engineers, Vol. 90, S.M.5, 1964, pp. 87-102.
[3] Crawford, C. B., "Resistance of Soil Structure to Consolida- tion," Canadian Geotechnical Journal, Vol. 11, No. 2, May 1965, pp. 90-97.
[4] Barden, L., and Berry, P. L., "Consolidation of a Normally Consolidated Clay." Proceedinas. American Society of Civil Engineers, ~ o l . ~<,'s.M. 5, pp. 15-35.
[5] Crawford, C. B., and Eden, W. J., "A Comparison of Lab- oratory Results with In-Situ Properties of Leda Clay," Pro-
ceedinas o f the Sixth international Soil Mechanics Confer- ence, ~ n i " e r s i t y of Toronto Press, Toronto, Vol. 1, 1965, pp. 31-35.
[6] Burn, K . N., "A Transducer to Measure Pore Water Pres- sures in Soil Tests," STP 361, 1963, Am. Soc. Testing Mats., Philadelphia, Pa.
[ 7 ] Denissov, N. Ya, "Pore Pressure and Strength of Undercon- solidated Clay Soils," Proceedings o f the Sixth International
Soil Mechanics Conference, University of Toronto Press, Toronto, Vol. 1, 1965, pp. 208-212.
[8] p o n a r d s , G. A., and Altschaeffl, A. G., "The Compressibil- ~ t y of Clay," Proceedings, American Society of Civil Engi- neers, Vol. 90, S.M.5, pp. 133-155.
[9] Bjerrum, L., and Wu, T . H., "Fundamental Shear-Strength Properties of the Lilla Edet Clav." Ge'otechniqrte, Vol. X, No. 3, September 1960, pp. 101-109.
[ l o ] Barden, L., "Consolidation of Clay with Non-Linear Vis- cosity, Ge'otechnique, Vol. XV, No. 4, December 1965, pp. 345-362.