HAL Id: hal-01240890
https://hal.archives-ouvertes.fr/hal-01240890
Submitted on 24 Dec 2015
HAL is a multi-disciplinary open access
archive for the deposit and dissemination of
sci-entific research documents, whether they are
pub-lished or not. The documents may come from
L’archive ouverte pluridisciplinaire HAL, est
destinée au dépôt et à la diffusion de documents
scientifiques de niveau recherche, publiés ou non,
émanant des établissements d’enseignement et de
Comparative analysis of human modeling tools
Emilie Poirson, Mathieu Delangle
To cite this version:
Emilie Poirson, Mathieu Delangle. Comparative analysis of human modeling tools. International
Digital Human Modeling Symposium, Jun 2013, Ann Arbor, United States. �hal-01240890�
Emilie Poirson & Matthieu Delangle
LUNAM, IRCCYN, Ecole Centrale de Nantes, France
April 25, 2013
Abstract
Digital Human Modeling tools simulate a task performed by a human in a virtual environment and provide useful indicators for ergonomic, universal design and represen-tation of product in situation. The latest developments in this field are in terms of appearance, behaviour and movement. With the considerable increase of power com-puters,some of these programs incorporate a number of key details that make the result closer and closer to a real situation. With the differences in terms of performance, qualities, limitations, the choice of the tool becomes com-plicated in this wide range of possibilities. In this context, we propose to study and compare the most human mod-elling software available on the market, and thus provide an aided decision tool to help the designer to get the most adaptable tool.
1
Introduction
In the recent decades, emerged commercial software based on numerical models of man: the virtual human [1]. The Digital Human Modeling Software (DHMS) have been introduced in industry firstly to facilitate a faster design process [2]. With the increasing of computer power, the use of DHM software became unavoidable in the life cycle of products, where the design has to answer to end-user expectations, including their need for usability [3]. With an iterative process of product evaluation, the correction and adjustments are quicker [4]. As in all categories of software package, the quality and accuracy increase continuously, to meet the demand of industrials and researchers ([5],[6]). The proliferation of tools becomes problematic for the designer who has
sometimes a multitude of functions that are not suitable for his application case.
The first step of our study consisted in listing all the comparable software and to select the comparison criteria. Then a list of indicators is proposed, in three major categories: degree of realism, functions and environment. Based on software use, literature searches [7] and technical reports ([8], [9], [10], for example), the table of indicator is filled and coded from text to a quinary format, in order to performed comparative analysis. The last part presents the results and the outlooks of the study.
2
DHM tools comparison :
method-ology
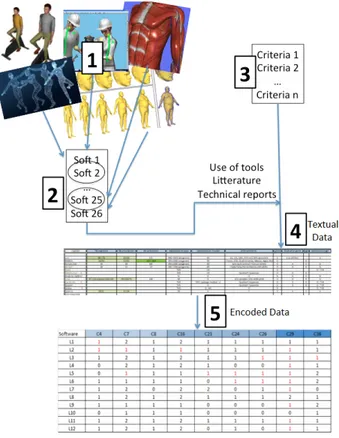
An exhaustive list of 32 commercially available 3D mod-eling software, computer programs used for developing a mathematical representation of any three-dimensional surface of objects was determined (step 1, Figure 1). A part of these tools defined as generic modelers (ie soft-ware allowing purely artistic entities modeling without real anthropometric approach) have been removed and a list of reachable human modelers was obtained (step 2, Figure 1). For example, Rhinoceros is a NURBS-based 3D modeling software, commonly used for indus-trial design, architecture, marine, jewelry design but not manikin design. It would have been inappropriate to keep them in the comparison. The same applies to the other generic modeler (not human dedicated design) as Blender, True SpaceMaya, 3D studio Max, Lightwave, (...), Pro/Engineer. The twelve DHM software selected
Emilie Poirson; Comparing DHM Tools
for our study are (Figures 2-4) Jack (Siemens), Ramsis (Human Solutions), HumanCad (Nexgen Ergonomics), 3DSSPP (University of Michigan), Poser (Smith Micro), MakeHuman (freeware), Anybody (Anybody Technol-ogy), Catia (Dassault Systemes), Daz Studio (DAZ 3D Inc), Quidam (N-Sided), Santos (University of Iowa), Sammie (Sammie CAD Ltd).
Figure 1: SYNOPTIC OF THE METHODOLOGY OF EVALUATION OF PRODUCTS
The step 3 (Figure 1) is the collection and selection of the differentiating criteria to evaluate the software.
3
Comparison table
3.1
Criteria
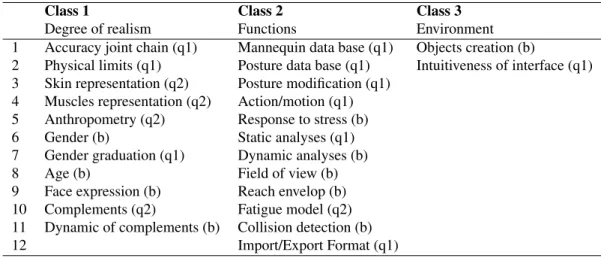
A list of indicators is defined to perform an objective com-parison between all software (Table 1). To generate this
Figure 2: MANIKIN OF JACK (a), RAMSIS (b), HU-MANCAD (c) AND 3DSSPP (d).
Figure 3: MANIKIN OF POSER (a), MAKEHUMAN (b), ANYBODY (c) AND DELMIA (d)
list, websites and forums about DHM tools are analyzed as technical manuals of Santos [11], Ramsis [12], Jack [13], 3DSSPP [14] for example. All the menus given a choice of functions are explored. The criteria are classi-fied in 3 main classes:
• Class 1 : Degree of realism. This class is used to com-pare the reliability of the representation of the model and its movements or respect of human physical constraints, for example.
• Class 2 : Functions. This class is very important for ergonomic and fatigue studies. It is associated with ex-isting functions in the software to perform some analysis on the virtual model (Reach envelop or Fatigue model for example).
• Class 3 : Environment. Includes criteria for the cre-ation and manipulcre-ation of the environment available in software.
Figure 4: MANIKIN OF DAZ (a), QUIDAM (b), SAN-TOS (c) AND SAMMIE (d)
If the criteria are mostly obvious, definition is to be pre-cise for others. Physical limits stands for taking into ac-count the physical constraints of articulations as knee and elbow. The Gender graduation stands for the the evolution of body forms, more or less pronounced. Complements are all the personalization of the manikin with clothes or accessories, and their movement during an animation (Dy-namic of complements).
Few simplifications on the criteria were done. The number of degrees of freedom, joints and segments seemed confusing for a non expert-user. They have been gathered under the label Accuracy joint chain. Secondly, the difference between motion and animation is low and not always understood; the criteria were aggregated. Fi-nally, in the data of environment, only the first, very im-portant for ergonomic and the last one (essential to reach all trades and new applications) were kept. With the dif-ferent transfer format, even if the software doesn’t allow to create an environment, the manikin can be included in an existing one in another tool. It seems to us not pri-mordial for this first study. The list of criteria has now 25 items.
3.2
Filling method (step 4, Figure 1)
A table containing software and the 25 criteria is built. Based on software use, literature searches, manual study and by contacting users of different softwares, each cell of this table is filled with textual data. This step, long and fastidious was led with rigor and completeness. The dif-ferent scales were not pre-defined, ignoring a priori which information will be collected.
3.3
Coding of criteria (step 5, Figure 1)
To perform a comparative analysis, it is essential to for-malize textual data contained in the table. Criteria (Ta-ble 1) were split in 3 categories. The first one is the binary criteria, answering yes or no for the presence of the func-tion (b). The second class (q1) contains those evaluated on a 5 points scale, quantifying the criteria (0-criterion not satisfied, 1-criterion partially satisfied, 2-criterion moder-ately satisfied, 3-criterion rather well satisfied, 4-criterion completely satisfied). The last category is also a quinary scale about the precision of data (q2): for example, the skin representation can be inexistant (0), existing but not very modifiable (1) to fully configurable (5).
4
Compairison of tools
After coding data from text to a coded format for the entire comparison table, multivariate statistical analysis (Principal Components Analysis and Hierarchical Ascen-dant Classification) are used to perform a decision tree (Figure 5).
4.1
Principal Component Analysis
The Principal Component Analysis (PCA) is used to re-duce the dimensions of the space allowing a representa-tion of the proximity between individuals and variables and to find the underlying dimensions. The matrix was analyzed using standardized PCA. The two first factors represent 64,04% of variability. In our case (Figure 5 ), the first Principal Component is mainly composed of criteria based on the realism of the manikin, including its movements. Software are clearly in 2 groups on this axis: a first on the right side of the graph, com-posed of Poser/Daz/MakeHuman/Quidam, software al-lowing DHM simulation with an high quality graphics rendering. The left group has a littler graphical defini-tion but with an higher number of analysis funcdefini-tionality. The second Principal Component is correlated to criteria based on analytic tools as collision detection or fatigue model. This confirms the intuitive classification of crite-ria performed.
On this first plan, Santos seems to be isolated, due to the fact that 15% of information stay on the 3rd principal
Emilie Poirson; Comparing DHM Tools
Table 1: CRITERIA OF THE 3 CLASSES
Class 1 Class 2 Class 3
Degree of realism Functions Environment 1 Accuracy joint chain (q1) Mannequin data base (q1) Objects creation (b)
2 Physical limits (q1) Posture data base (q1) Intuitiveness of interface (q1) 3 Skin representation (q2) Posture modification (q1)
4 Muscles representation (q2) Action/motion (q1) 5 Anthropometry (q2) Response to stress (b) 6 Gender (b) Static analyses (q1) 7 Gender graduation (q1) Dynamic analyses (b) 8 Age (b) Field of view (b) 9 Face expression (b) Reach envelop (b) 10 Complements (q2) Fatigue model (q2) 11 Dynamic of complements (b) Collision detection (b)
12 Import/Export Format (q1)
Figure 5: INDIVIDUALS REPRESENTATION INTO A TWO-DIMENSIONAL PLANE.
component not represented here. To precise this plan, we use the Hierarchical Ascendant Classification method.
4.2
Hierarchical Ascendant Classification
In order to provide a partition of the software and to de-fine groups, similar from an analytic point of view, a hi-erarchical ascendant classification (HAC) [15] has been
done. The principle of HAC is to build a hierarchical tree (dendrogram, Figure 6), which shows the level of each ag-gregation according to the dissimilarity between the prod-ucts. The parameters of the method are the definition of the distance for computing the dissimilarities and the link-age rule, computed through the Ward criteria.
The dotted line represents the truncation and visualizes that three homogeneous groups were identified :
• C1 composed of Santos, Jack and Catia/Delmia, • C2 composed of Anybody, 3DSSPP, Ramsis, Human-Cad and Sammie,
• C3 composed of MakeHuman, Quidam, Poser and Daz.
The classification perform by the HAC appears to be consistent with the geometrical representation of the proximity between individuals implement by the PCA. Firstly, the four software on the right of the Figure 5 are grouped together in C3, divided in the two same sub-groups Daz/Poser and Quidam/Makehuman resulting the proximity of these software. Secondly, the same couples Humancad/Sammie and Jack/Catia are found. In Figure 5, Ramsis and Anybody seem to be related (very close to each other), but not in the hierarchical tree. The cosine matrix of observations shows that the tools are strongly linked with the third component F3. That’s why L2 and L7 are not directly interconnected on the hierarchical tree.
Figure 6: DENDROGRAM OF THE HIERARCHICAL ASCENDANT CLASSIFICATION
The same event arrive between Santos and Delmia/Jack. The most relevant representation seems to be or a 3D mapping from the PCA or, the dendrogram of the CAH. We will use the last cited, representation of the Hierarchi-cal Ascendant Classification.
From the dendrogram, a protocol of choice of the best suited software to the expected use can be defined. The first step of the dissimilarity is performed between the class C3 and C1/C2 (Figure 6). The comparison of C3 link to C1/C2 on our criteria show a superiority of the per-formance of analysis (Table 1, column 2). The first ques-tion for the user will be about the analysis need. Then, the classes are divided in sub-classes. For example, in the class C3, two sub-classes are distinguished : the second group is autonomous to perform animations and motion capture (mocap), instead of the first group which have to export their digital human to another software allowing to perform animation and interaction with the avatars in mocap.
From the hierarchical tree and by identifying what are the main discriminating criteria, it is possible to define a protocol to determine from minimum questions, what is the best suited software to the expected use. Some
criteria (variables) identified through the PCA and HAC are grouped together in the form of questions to guide quickly the search towards a specific group of software. Other criteria are then explicitly evaluated allowing accurate selection of the software. Five questions (regarding the "capacity to perform analysis", "realism of mannequin", "Animation of mannequin", "dynamic of analysis" and "human appearance of mannequin"), involving some discriminants criteria, allow to quickly select corresponding software. These questions are coded in a friendly interface following the algorithm given below.
Algorithm of selection if Perform analysis ="no" then
if Animation="no" then
soft = MakeHuman or Quidam else soft = Poser or Daz Studio end if
else if Animation="yes" then if Realistic="yes" then
soft = Santos
else soft = Jack or Catia end if
else if Human appearance="yes" then soft = Anybody modeler
else if Dynamic analysis="yes" then soft = Ramsis or 3DSSP
else soft = Sammie or HumanCad end if
end if end if end if
where stands
Perform analysisfor "Do you need functions to perform analysis on the virtual mannequin (eg static analysis, field of vision, collision detection, reach envelop...) ?", Realisticfor "Do you need a realistic virtual mannequin with an high graphical rendering ?",
Animation for "Do you need to perform animation and mocap inside my software ?"
Dynamic analysisto "Do you need to do dynamic analysis Human appearanceseems obvious.
Emilie Poirson; Comparing DHM Tools
These simple questions can be answered by the designer to guide him in his choice of software.
5
Conclusion and perspectives
This paper presented a comparison of digital human mod-eling software allowing to perform a decision making tools to help the designer to choose his software. Twelve digital human modeling software have been presented and compared. From a table including characteristics of soft-ware through al list of 25 comparison criteria, Principal Components Analysis and Hierarchical Ascendant Clas-sification were used to build a decision tree. The proce-dure to select the most adaptable soft is finally exposed. The next step of the project is to guide the selection by vi-sual perception, not only questions. In the case of recom-mender for Design Human Modeling software, we want also to improve the acquisition of anthropometric data, extracted from pictures for example. The designer may present situations that he would like to represent, and after interpretation of images variations(postures, ergonomics, anthropometry ...) software would be advisable with a manikin to customize.
The human modeling is essential in the lifecycle of the product, allowing a very good communication between all the actors of the life of product. Integration of an adapted DHM tools in the product life cycle allows to perform both a more efficient design and more sustainable prod-ucts. The aim of the presented procedure is the concep-tion of a tool allowing to the designer to quickly determine what are the types of solutions that best suit his needs. In our study, the tools are dedicated to helping the designer to find the most suitable software. However, the method-ology can be adapted to all kinds of applications, for ex-ample in the design of products. Indeed, software of our study may be replaced by a sample of a product randomly generated (Monte Carlo’s method...) and also evaluated using criteria (height, width, color, texture, materials...). Thus, using our method, the discriminating criteria may be identified and automatically encoded in the decision making tools allowing to offer to the designer a sample of shapes adapted to their needs, by answering some ques-tions.
6
Acknowledgements
Thanks go to B.Novarini, for his contribution on software study.
References
[1] Badler, N., 1997. “Virtual humans for animation, ergonomics and simulation”. In Proceedings of the IEEE Workshop on Non-Rigid and Articulated Mo-tion.
[2] Mathiassen, S., Wells, R., Winkel, J., Forsman, M., and Medbo, L., 2002. “Tools for integrating engi-neering and ergonomics assessment of time aspects in industrial production”. In Proceedings of the 34th Annual Congress of the Nordic Ergonomics Society, Vol. 2, pp. 579–584.
[3] Mahdjoub, M., Monticolo, D., Gomes, S., and Sagot, J., 2009. A collaborative Design for Us-ability approach supported by Virtual Reality and a Multi-Agent System embedded in a PLM environ-ment. Prentice Hall.
[4] Chaffin, D., 2001. “Digital human modeling for ve-hicle and workplace design”. Society of Automotive Engineers, INC, Warrendale, PA, USA.
[5] Chaffin, D., 2005. “Improving digital human mod-elling for proactive ergonomics in design”. Er-gonomics, 48(5), April, pp. 478–491.
[6] Landau, K., 2000. Ergonomics software tools in product and workplace design - a review of recent developments in human modeling and other design aids. Tech. rep., ERGON GmbH, Stuttgart.
[7] Almeida Moura, D., de Andrade Volpe, L., and Tonin, L., 2010. “Analise comparativa de ferramen-tas computationais de modelagem e simulaçao hu-mana para aplicaçao em projetos de situaçoes pro-dutivas”. In XXX encontro nacional de engenharia de Produçao.
[8] Beagley, N., 1997. Human body modeling as a hu-man factors engineering tool. Tech. Rep. MP-54, RTO HFM, Orlando, USA, December.
[9] Blanchonette, 2009. Jack human modelling tool: A review. Tech. rep., Air Operations Division Defence Science and Technology Organisation, Australia. [10] Seidl, A., 1997. “Ramsis: a new cad-tool for
er-gonomics analysis of vehicles developed for the ger-man automotive industry. automotive concurrent/ si-multaneous engineering.”. In Society of Automo-tive Engineering, Special Publications, Vol. 1233, pp. 51–57.
[11] Abdel-Malek, K., Yang, J., Kim, J., Marler, T., Beck, S., Swan, C., Frey-Law, L., Mathai, A., Mur-phy, C., Rahmatallah, S., and Arora, J., 2007. “De-velopment of the virtual-human santos”. In Digital Human Modeling, V. D. (Ed.), ed., Springer-Verlag Berlin Heidelberg, pp. 490–499.
[12] Van der Meulen, P., and Seidl, A., 2007. “Ramsis – the leading cad tool for ergonomic analysis of vehi-cles”. In Digital Human Modeling, V. D. (Ed.), ed., Springer-Verlag Berlin Heidelberg, pp. 1008–1017. [13] UGS, 2006. Jack User Manual - Version 5.1a. [14] THE UNIVERSITY OF MICHIGAN - CENTER OF
ERGONOMICS, 2011. 3D Static Strength Prediction ProgramTM Version 6.0.5 User’s Manual, Mars. [15] Hair, J., Tatham, R., Anderson, R., and Black, W.,
1998. Multivariate Data Analysis (5th Edition). Prentice Hall.
[16] Goldberg, D. E., 1989. Genetic algorithms in search, optimisation and machine learning. Addi-son Wesley, Reading.
[17] Kelly, J. C., 2008. “Interactive genetic algorithms for shape preference assessment in engineering de-sign”. PhD thesis, University of Michigan.
[18] Z.Gu, Tang, M. X., and Frazer, J. H., 2006. Captur-ing aesthetic intention durCaptur-ing Interactive evolution, Vol. 38. Computer-Aided Design.